Free Statistics

of Irreproducible Research!

Author's title

Author*The author of this computation has been verified*
R Software Modulerwasp_notchedbox1.wasp
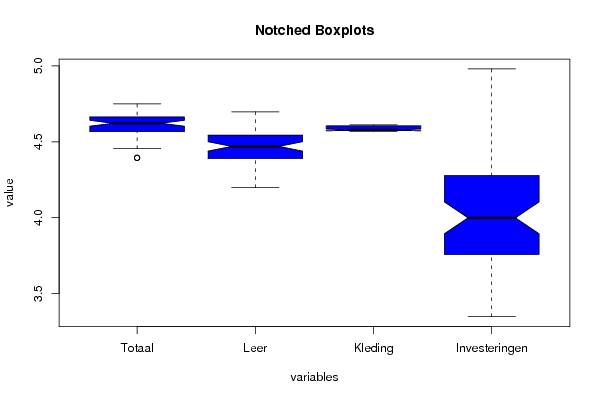
Title produced by softwareNotched Boxplots
Date of computationThu, 30 Oct 2008 03:08:28 -0600
Cite this page as followsStatistical Computations at FreeStatistics.org, Office for Research Development and Education, URL https://freestatistics.org/blog/index.php?v=date/2008/Oct/30/t1225357759j6drq1b8ec0qhn5.htm/, Retrieved Mon, 13 May 2024 23:46:09 +0000
Statistical Computations at FreeStatistics.org, Office for Research Development and Education, URL https://freestatistics.org/blog/index.php?pk=19967, Retrieved Mon, 13 May 2024 23:46:09 +0000
QR Codes:

Original text written by user:
IsPrivate?No (this computation is public)
User-defined keywordstaak 3
Estimated Impact236
Family? (F = Feedback message, R = changed R code, M = changed R Module, P = changed Parameters, D = changed Data)
F     [Mean Plot] [workshop 3] [2007-10-26 12:14:28] [e9ffc5de6f8a7be62f22b142b5b6b1a8]
F RMPD  [Notched Boxplots] [Notched boxplot a...] [2008-10-29 13:43:18] [b635de6fc42b001d22cbe6e730fec936]
F R       [Notched Boxplots] [Notched Boxplot l...] [2008-10-29 14:23:11] [b635de6fc42b001d22cbe6e730fec936]
F   P         [Notched Boxplots] [taak 3 ] [2008-10-30 09:08:28] [783db4b4a0f63b73ca8b14666b7f4329] [Current]
Feedback Forum
2008-11-11 11:25:17 [Stijn Loomans] [reply
Het invoegen van het logaritme zorgt ervoor dat de grote getallen veel kleiner worden. Hierdoor worden grote schommelingen afgevlakt en de kleine worden relatief groter. Doordat de outliers zo dichter bij het gemiddelde komen, wordt de spreiding verkleind.
2008-11-11 14:02:37 [Bernard Femont] [reply
Als de outliers eruit gelaten worden door invoeren van een logaritmische functie die grote schommelingen afvlakt. (z wordt vervangen door log z), ziet men veel duidelijker dat serie4 (investeringen) de grootste relatieve daling kent sinds maart 2001. Dit komt door het feit dat de outliers de andere 3 series niet meer kunnen beinvloeden. En de mediaan hoger is.

Post a new message
Dataseries X:
110.40	109.20	99.90	72.50
96.40	88.60	99.80	59.40
101.90	94.30	99.80	85.70
106.20	98.30	100.30	88.20
81.00	86.40	99.90	62.80
94.70	80.60	99.90	87.00
101.00	104.10	100.00	79.20
109.40	108.20	100.10	112.00
102.30	93.40	100.10	79.20
90.70	71.90	100.20	132.10
96.20	94.10	100.30	40.10
96.10	94.90	100.60	69.00
106.00	96.40	100.00	59.40
103.10	91.10	100.10	73.80
102.00	84.40	100.20	57.40
104.70	86.40	100.00	81.10
86.00	88.00	100.10	46.60
92.10	75.10	100.10	41.40
106.90	109.70	100.10	71.20
112.60	103.00	100.50	67.90
101.70	82.10	100.50	72.00
92.00	68.00	100.50	145.50
97.40	96.40	96.30	39.70
97.00	94.30	96.30	51.90
105.40	90.00	96.80	73.70
102.70	88.00	96.80	70.90
98.10	76.10	96.90	60.80
104.50	82.50	96.80	61.00
87.40	81.40	96.80	54.50
89.90	66.50	96.80	39.10
109.80	97.20	96.80	66.60
111.70	94.10	97.00	58.50
98.60	80.70	97.00	59.80
96.90	70.50	97.00	80.90
95.10	87.80	96.80	37.30
97.00	89.50	96.90	44.60
112.70	99.60	97.20	48.70
102.90	84.20	97.30	54.00
97.40	75.10	97.30	49.50
111.40	92.00	97.20	61.60
87.40	80.80	97.30	35.00
96.80	73.10	97.30	35.70
114.10	99.80	97.30	51.30
110.30	90.00	97.30	49.00
103.90	83.10	97.30	41.50
101.60	72.40	97.30	72.50
94.60	78.80	98.10	42.10
95.90	87.30	96.80	44.10
104.70	91.00	96.80	45.10
102.80	80.10	96.80	50.30
98.10	73.60	96.80	40.90
113.90	86.40	96.80	47.20
80.90	74.50	96.80	36.90
95.70	71.20	96.80	40.90
113.20	92.40	96.80	38.30
105.90	81.50	96.80	46.30
108.80	85.30	96.80	28.40
102.30	69.90	96.80	78.40
99.00	84.20	96.90	36.80
100.70	90.70	97.10	50.70
115.50	100.30	97.10	42.80


Summary of computational transaction
Raw Inputview raw input (R code)
Raw Outputview raw output of R engine
Computing time6 seconds
R Server'Herman Ole Andreas Wold' @ 193.190.124.10:1001

\begin{tabular}{lllllllll}
\hline
Summary of computational transaction \tabularnewline
Raw Input & view raw input (R code)  \tabularnewline
Raw Output & view raw output of R engine  \tabularnewline
Computing time & 6 seconds \tabularnewline
R Server & 'Herman Ole Andreas Wold' @ 193.190.124.10:1001 \tabularnewline
\hline
\end{tabular}
%Source: https://freestatistics.org/blog/index.php?pk=19967&T=0

[TABLE]
[ROW][C]Summary of computational transaction[/C][/ROW]
[ROW][C]Raw Input[/C][C]view raw input (R code) [/C][/ROW]
[ROW][C]Raw Output[/C][C]view raw output of R engine [/C][/ROW]
[ROW][C]Computing time[/C][C]6 seconds[/C][/ROW]
[ROW][C]R Server[/C][C]'Herman Ole Andreas Wold' @ 193.190.124.10:1001[/C][/ROW]
[/TABLE]
Source: https://freestatistics.org/blog/index.php?pk=19967&T=0

Globally Unique Identifier (entire table): ba.freestatistics.org/blog/index.php?pk=19967&T=0

As an alternative you can also use a QR Code:  

The GUIDs for individual cells are displayed in the table below:

Summary of computational transaction
Raw Inputview raw input (R code)
Raw Outputview raw output of R engine
Computing time6 seconds
R Server'Herman Ole Andreas Wold' @ 193.190.124.10:1001


Boxplot statistics
Variablelower whiskerlower hingemedianupper hingeupper whisker
Totaal4.454347296253514.566429357671664.622027303054514.663439094112074.74927052996185
Leer4.197201947661814.389498649512584.469350462845564.544358046591334.69774936728118
Kleding4.567468318804084.572646994282534.577798989191964.605170185988094.61115225766564
Investeringen3.346389145167163.756538102587753.99820070166924.276666119016064.98017608661155

\begin{tabular}{lllllllll}
\hline
Boxplot statistics \tabularnewline
Variable & lower whisker & lower hinge & median & upper hinge & upper whisker \tabularnewline
Totaal & 4.45434729625351 & 4.56642935767166 & 4.62202730305451 & 4.66343909411207 & 4.74927052996185 \tabularnewline
Leer & 4.19720194766181 & 4.38949864951258 & 4.46935046284556 & 4.54435804659133 & 4.69774936728118 \tabularnewline
Kleding & 4.56746831880408 & 4.57264699428253 & 4.57779898919196 & 4.60517018598809 & 4.61115225766564 \tabularnewline
Investeringen & 3.34638914516716 & 3.75653810258775 & 3.9982007016692 & 4.27666611901606 & 4.98017608661155 \tabularnewline
\hline
\end{tabular}
%Source: https://freestatistics.org/blog/index.php?pk=19967&T=1

[TABLE]
[ROW][C]Boxplot statistics[/C][/ROW]
[ROW][C]Variable[/C][C]lower whisker[/C][C]lower hinge[/C][C]median[/C][C]upper hinge[/C][C]upper whisker[/C][/ROW]
[ROW][C]Totaal[/C][C]4.45434729625351[/C][C]4.56642935767166[/C][C]4.62202730305451[/C][C]4.66343909411207[/C][C]4.74927052996185[/C][/ROW]
[ROW][C]Leer[/C][C]4.19720194766181[/C][C]4.38949864951258[/C][C]4.46935046284556[/C][C]4.54435804659133[/C][C]4.69774936728118[/C][/ROW]
[ROW][C]Kleding[/C][C]4.56746831880408[/C][C]4.57264699428253[/C][C]4.57779898919196[/C][C]4.60517018598809[/C][C]4.61115225766564[/C][/ROW]
[ROW][C]Investeringen[/C][C]3.34638914516716[/C][C]3.75653810258775[/C][C]3.9982007016692[/C][C]4.27666611901606[/C][C]4.98017608661155[/C][/ROW]
[/TABLE]
Source: https://freestatistics.org/blog/index.php?pk=19967&T=1

Globally Unique Identifier (entire table): ba.freestatistics.org/blog/index.php?pk=19967&T=1

As an alternative you can also use a QR Code:  

The GUIDs for individual cells are displayed in the table below:

Boxplot statistics
Variablelower whiskerlower hingemedianupper hingeupper whisker
Totaal4.454347296253514.566429357671664.622027303054514.663439094112074.74927052996185
Leer4.197201947661814.389498649512584.469350462845564.544358046591334.69774936728118
Kleding4.567468318804084.572646994282534.577798989191964.605170185988094.61115225766564
Investeringen3.346389145167163.756538102587753.99820070166924.276666119016064.98017608661155


Boxplot Notches
Variablelower boundmedianupper bound
Totaal4.602402401170954.622027303054514.64165220493808
Leer4.438022674677764.469350462845564.50067825101336
Kleding4.571219603765484.577798989191964.58437837461843
Investeringen3.892979703614323.99820070166924.10342169972408

\begin{tabular}{lllllllll}
\hline
Boxplot Notches \tabularnewline
Variable & lower bound & median & upper bound \tabularnewline
Totaal & 4.60240240117095 & 4.62202730305451 & 4.64165220493808 \tabularnewline
Leer & 4.43802267467776 & 4.46935046284556 & 4.50067825101336 \tabularnewline
Kleding & 4.57121960376548 & 4.57779898919196 & 4.58437837461843 \tabularnewline
Investeringen & 3.89297970361432 & 3.9982007016692 & 4.10342169972408 \tabularnewline
\hline
\end{tabular}
%Source: https://freestatistics.org/blog/index.php?pk=19967&T=2

[TABLE]
[ROW][C]Boxplot Notches[/C][/ROW]
[ROW][C]Variable[/C][C]lower bound[/C][C]median[/C][C]upper bound[/C][/ROW]
[ROW][C]Totaal[/C][C]4.60240240117095[/C][C]4.62202730305451[/C][C]4.64165220493808[/C][/ROW]
[ROW][C]Leer[/C][C]4.43802267467776[/C][C]4.46935046284556[/C][C]4.50067825101336[/C][/ROW]
[ROW][C]Kleding[/C][C]4.57121960376548[/C][C]4.57779898919196[/C][C]4.58437837461843[/C][/ROW]
[ROW][C]Investeringen[/C][C]3.89297970361432[/C][C]3.9982007016692[/C][C]4.10342169972408[/C][/ROW]
[/TABLE]
Source: https://freestatistics.org/blog/index.php?pk=19967&T=2

Globally Unique Identifier (entire table): ba.freestatistics.org/blog/index.php?pk=19967&T=2

As an alternative you can also use a QR Code:  

The GUIDs for individual cells are displayed in the table below:

Boxplot Notches
Variablelower boundmedianupper bound
Totaal4.602402401170954.622027303054514.64165220493808
Leer4.438022674677764.469350462845564.50067825101336
Kleding4.571219603765484.577798989191964.58437837461843
Investeringen3.892979703614323.99820070166924.10342169972408


Parameters (Session):
par1 = blue ;
Parameters (R input):
par1 = blue ;
R code (references can be found in the software module):
z <- as.data.frame(t(y))
bitmap(file='test1.png')
(r<-boxplot
(log(z) ,xlab=xlab,ylab=ylab,main=main,notch=TRUE,col=par1))
dev.off()
load(file='createtable')
a<-table.start()
a<-table.row.start(a)
a<-table.element(a,hyperlink('overview.htm','Boxplot statistics','Boxplot overview'),6,TRUE)
a<-table.row.end(a)
a<-table.row.start(a)
a<-table.element(a,'Variable',1,TRUE)
a<-table.element(a,hyperlink('lower_whisker.htm','lower whisker','definition of lower whisker'),1,TRUE)
a<-table.element(a,hyperlink('lower_hinge.htm','lower hinge','definition of lower hinge'),1,TRUE)
a<-table.element(a,hyperlink('central_tendency.htm','median','definitions about measures of central tendency'),1,TRUE)
a<-table.element(a,hyperlink('upper_hinge.htm','upper hinge','definition of upper hinge'),1,TRUE)
a<-table.element(a,hyperlink('upper_whisker.htm','upper whisker','definition of upper whisker'),1,TRUE)
a<-table.row.end(a)
for (i in 1:length(y[,1]))
{
a<-table.row.start(a)
a<-table.element(a,dimnames(t(x))[[2]][i],1,TRUE)
for (j in 1:5)
{
a<-table.element(a,r$stats[j,i])
}
a<-table.row.end(a)
}
a<-table.end(a)
table.save(a,file='mytable.tab')
a<-table.start()
a<-table.row.start(a)
a<-table.element(a,'Boxplot Notches',4,TRUE)
a<-table.row.end(a)
a<-table.row.start(a)
a<-table.element(a,'Variable',1,TRUE)
a<-table.element(a,'lower bound',1,TRUE)
a<-table.element(a,'median',1,TRUE)
a<-table.element(a,'upper bound',1,TRUE)
a<-table.row.end(a)
for (i in 1:length(y[,1]))
{
a<-table.row.start(a)
a<-table.element(a,dimnames(t(x))[[2]][i],1,TRUE)
a<-table.element(a,r$conf[1,i])
a<-table.element(a,r$stats[3,i])
a<-table.element(a,r$conf[2,i])
a<-table.row.end(a)
}
a<-table.end(a)
table.save(a,file='mytable1.tab')