Free Statistics

of Irreproducible Research!

Author's title

Author*The author of this computation has been verified*
R Software Modulerwasp_meanplot.wasp
Title produced by softwareMean Plot
Date of computationWed, 29 Oct 2008 08:43:42 -0600
Cite this page as followsStatistical Computations at FreeStatistics.org, Office for Research Development and Education, URL https://freestatistics.org/blog/index.php?v=date/2008/Oct/29/t1225291486vlc9wiu8wbosj25.htm/, Retrieved Tue, 14 May 2024 02:21:59 +0000
Statistical Computations at FreeStatistics.org, Office for Research Development and Education, URL https://freestatistics.org/blog/index.php?pk=19875, Retrieved Tue, 14 May 2024 02:21:59 +0000
QR Codes:

Original text written by user:
IsPrivate?No (this computation is public)
User-defined keywords
Estimated Impact220
Family? (F = Feedback message, R = changed R code, M = changed R Module, P = changed Parameters, D = changed Data)
F     [Mean Plot] [workshop 3] [2007-10-26 12:14:28] [e9ffc5de6f8a7be62f22b142b5b6b1a8]
F    D  [Mean Plot] [Herproducering ta...] [2008-10-29 12:00:40] [819b576fab25b35cfda70f80599828ec]
F R         [Mean Plot] [Mean plot task 4] [2008-10-29 14:43:42] [e08fee3874f3333d6b7a377a061b860d] [Current]
Feedback Forum
2008-11-08 09:16:35 [Astrid Sniekers] [reply
De vraag was om te kijken of bij het trimmen de resultaten van vraag Q2 en Q3 anders zouden zijn. De student doet een hele uitleg, die totaal irrelevant is.
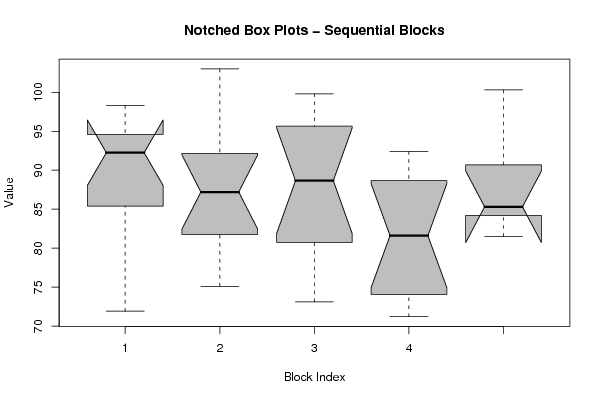
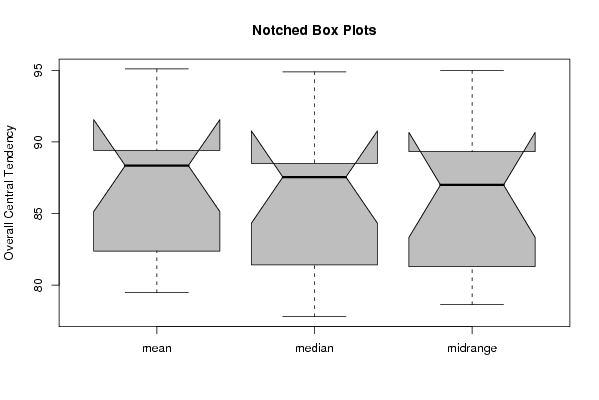
We kunnen besluiten dat er een verschil is met de resultaten van vraag Q2 en Q3. Dit komt omdat we door het trimmen van de tijdreeks, de outliers uit onze tijdreeks hebben gehaald. Bijgevolg wordt de spreiding kleiner.
2008-11-10 10:57:41 [Kevin Neelen] [reply
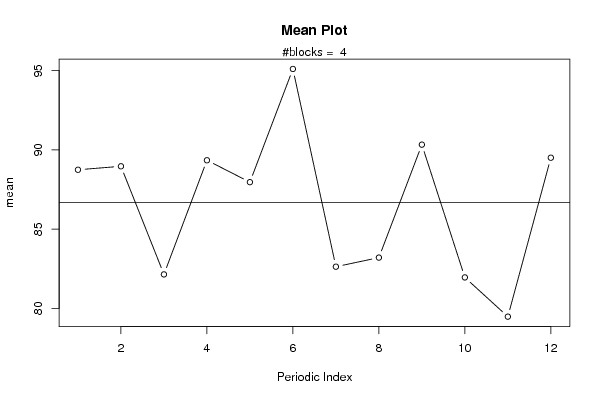
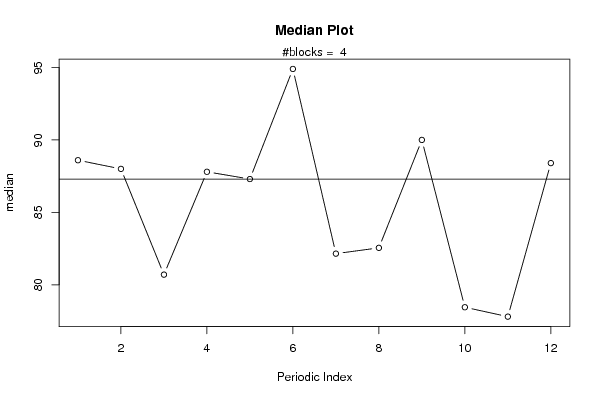
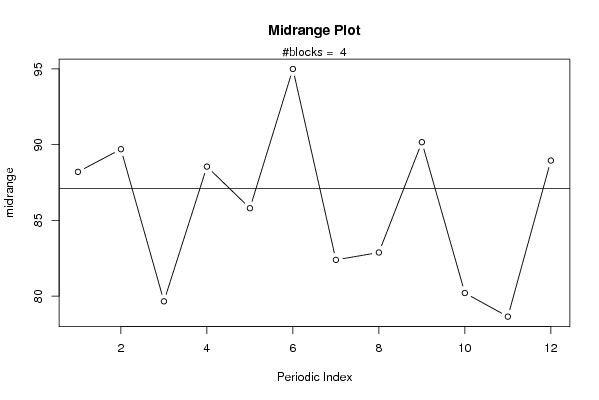
Doordat we hier de 5% hoogste en 5% laagste waarden wegfilteren, verdwijnen de outliers uit de datareeks. Hierdoor wordt het verloop van de grafiek stabieler (met andere woorden, de verticale spreiding van de grafiek verkleint).
2008-11-10 17:25:36 [Michael Van Spaandonck] [reply
In tegenstelling tot Astrid ben ik van mening dat de gegeven uitleg in het document wel relevant is, aangezien na het wegtrimmen van de 5% hoogste en 5% laagste waarden iedere bekomen grafiek besproken wordt en vergeleken wordt met de grafieken uit Q2 en Q3.
Naar mijn mening gebeurt deze bespreking juist en worden er ook juiste conclusies getrokken.

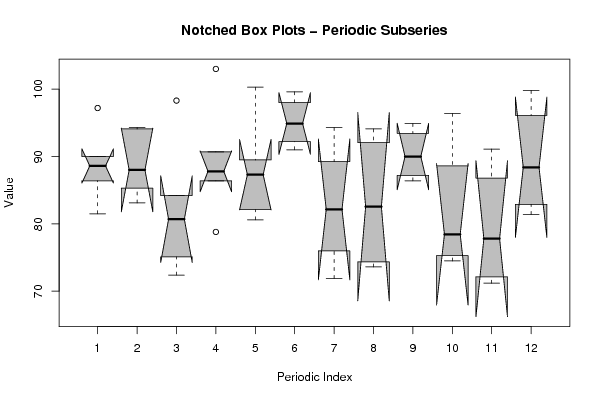
Graag wil ik nog toevoegen dat we significante verschillen zien tussen de maanden 2 en 3, 3 en 4, 5 en 6 en tot slot 6 en 7. Dit op basis van onbestaande overlapping van hun respectievelijke box plots op grafiek 'periodic subseries'
2008-11-10 20:40:21 [Inge Meelberghs] [reply
Als men in de berekening rekening houdt met de 5% hoogste en laagste observaties kunnen we zeggen dat dit zeker een verschillend resultaat oplevert.

Dit is duidelijk aan de grafiek te zien. Ook is er hier nog steeds invloed van seizoenaliteit maar dan vinden de plotse stijgingen en dalingen in andere maanden plaats en zijn ze niet meer zo groot. Zo zijn er onder andere in maand 3, 7 en 10 plotse dalingen en in maand 6, 9 en 11 plotse stijgingen. Dezelfde vaststelling kunnen we maken als we naar de Notched box plot – periodic subseries kijken. Als je dus de staarten 'knipt', verkleint de spreiding en vallen veel outliers weg. Het verloop van de grafiek wordt dus stabieler.

Post a new message
Dataseries X:
109.20
88.60
94.30
98.30
86.40
80.60
104.10
108.20
93.40
71.90
94.10
94.90
96.40
91.10
84.40
86.40
88.00
75.10
109.70
103.00
82.10
68.00
96.40
94.30
90.00
88.00
76.10
82.50
81.40
66.50
97.20
94.10
80.70
70.50
87.80
89.50
99.60
84.20
75.10
92.00
80.80
73.10
99.80
90.00
83.10
72.40
78.80
87.30
91.00
80.10
73.60
86.40
74.50
71.20
92.40
81.50
85.30
69.90
84.20
90.70
100.30


Summary of computational transaction
Raw Inputview raw input (R code)
Raw Outputview raw output of R engine
Computing time4 seconds
R Server'Herman Ole Andreas Wold' @ 193.190.124.10:1001

\begin{tabular}{lllllllll}
\hline
Summary of computational transaction \tabularnewline
Raw Input & view raw input (R code)  \tabularnewline
Raw Output & view raw output of R engine  \tabularnewline
Computing time & 4 seconds \tabularnewline
R Server & 'Herman Ole Andreas Wold' @ 193.190.124.10:1001 \tabularnewline
\hline
\end{tabular}
%Source: https://freestatistics.org/blog/index.php?pk=19875&T=0

[TABLE]
[ROW][C]Summary of computational transaction[/C][/ROW]
[ROW][C]Raw Input[/C][C]view raw input (R code) [/C][/ROW]
[ROW][C]Raw Output[/C][C]view raw output of R engine [/C][/ROW]
[ROW][C]Computing time[/C][C]4 seconds[/C][/ROW]
[ROW][C]R Server[/C][C]'Herman Ole Andreas Wold' @ 193.190.124.10:1001[/C][/ROW]
[/TABLE]
Source: https://freestatistics.org/blog/index.php?pk=19875&T=0

Globally Unique Identifier (entire table): ba.freestatistics.org/blog/index.php?pk=19875&T=0

As an alternative you can also use a QR Code:  

The GUIDs for individual cells are displayed in the table below:

Summary of computational transaction
Raw Inputview raw input (R code)
Raw Outputview raw output of R engine
Computing time4 seconds
R Server'Herman Ole Andreas Wold' @ 193.190.124.10:1001


Parameters (Session):
par1 = 12 ;
Parameters (R input):
par1 = 12 ;
R code (references can be found in the software module):
par1 <- as.numeric(par1)
(n <- length(x))
(np <- floor(n / par1))
arr <- array(NA,dim=c(par1,np+1))
ari <- array(0,dim=par1)
j <- 0
for (i in 1:n)
{
j = j + 1
ari[j] = ari[j] + 1
arr[j,ari[j]] <- x[i]
if (j == par1) j = 0
}
ari
arr
arr.mean <- array(NA,dim=par1)
arr.median <- array(NA,dim=par1)
arr.midrange <- array(NA,dim=par1)
for (j in 1:par1)
{
arr.mean[j] <- mean(arr[j,],na.rm=TRUE)
arr.median[j] <- median(arr[j,],na.rm=TRUE)
arr.midrange[j] <- (quantile(arr[j,],0.75,na.rm=TRUE) + quantile(arr[j,],0.25,na.rm=TRUE)) / 2
}
overall.mean <- mean(x)
overall.median <- median(x)
overall.midrange <- (quantile(x,0.75) + quantile(x,0.25)) / 2
bitmap(file='plot1.png')
plot(arr.mean,type='b',ylab='mean',main='Mean Plot',xlab='Periodic Index')
mtext(paste('#blocks = ',np))
abline(overall.mean,0)
dev.off()
bitmap(file='plot2.png')
plot(arr.median,type='b',ylab='median',main='Median Plot',xlab='Periodic Index')
mtext(paste('#blocks = ',np))
abline(overall.median,0)
dev.off()
bitmap(file='plot3.png')
plot(arr.midrange,type='b',ylab='midrange',main='Midrange Plot',xlab='Periodic Index')
mtext(paste('#blocks = ',np))
abline(overall.midrange,0)
dev.off()
bitmap(file='plot4.png')
z <- data.frame(t(arr))
names(z) <- c(1:par1)
(boxplot(z,notch=TRUE,col='grey',xlab='Periodic Index',ylab='Value',main='Notched Box Plots - Periodic Subseries'))
dev.off()
bitmap(file='plot5.png')
z <- data.frame(arr)
names(z) <- c(1:np)
(boxplot(z,notch=TRUE,col='grey',xlab='Block Index',ylab='Value',main='Notched Box Plots - Sequential Blocks'))
dev.off()
bitmap(file='plot6.png')
z <- data.frame(cbind(arr.mean,arr.median,arr.midrange))
names(z) <- list('mean','median','midrange')
(boxplot(z,notch=TRUE,col='grey',ylab='Overall Central Tendency',main='Notched Box Plots'))
dev.off()