Free Statistics

of Irreproducible Research!

Author's title

Author*Unverified author*
R Software Modulerwasp_meanplot.wasp
Title produced by softwareMean Plot
Date of computationWed, 29 Oct 2008 08:26:50 -0600
Cite this page as followsStatistical Computations at FreeStatistics.org, Office for Research Development and Education, URL https://freestatistics.org/blog/index.php?v=date/2008/Oct/29/t1225290741kce5smf0at03nhb.htm/, Retrieved Tue, 14 May 2024 07:21:19 +0000
Statistical Computations at FreeStatistics.org, Office for Research Development and Education, URL https://freestatistics.org/blog/index.php?pk=19868, Retrieved Tue, 14 May 2024 07:21:19 +0000
QR Codes:

Original text written by user:
IsPrivate?No (this computation is public)
User-defined keywords
Estimated Impact283
Family? (F = Feedback message, R = changed R code, M = changed R Module, P = changed Parameters, D = changed Data)
F     [Mean Plot] [workshop 3] [2007-10-26 12:14:28] [e9ffc5de6f8a7be62f22b142b5b6b1a8]
F   PD    [Mean Plot] [seasonality on cl...] [2008-10-29 14:26:50] [46e0445318a71ab85f6f82e54c656dac] [Current]
- RMPD      [Harrell-Davis Quantiles] [Task 4: Harrell-D...] [2008-10-29 17:06:21] [495cd80c1a9baafb03c09cd9ab8d8fb5]
F R PD      [Mean Plot] [90% Quantielen kl...] [2008-10-29 17:31:07] [495cd80c1a9baafb03c09cd9ab8d8fb5]
F   P         [Mean Plot] [Afgevlakte meanpl...] [2008-11-02 14:40:15] [2d9298e0f43790a501ecec52b0f4048b]
F R PD      [Mean Plot] [Mean plot - Algem...] [2008-10-29 18:03:35] [495cd80c1a9baafb03c09cd9ab8d8fb5]
-   P         [Mean Plot] [feedback op hypot...] [2008-11-06 16:57:24] [b635de6fc42b001d22cbe6e730fec936]
-   P       [Mean Plot] [feedback op hypot...] [2008-11-06 16:25:50] [b635de6fc42b001d22cbe6e730fec936]
Feedback Forum
2008-11-06 14:17:29 [Dana Molenberghs] [reply
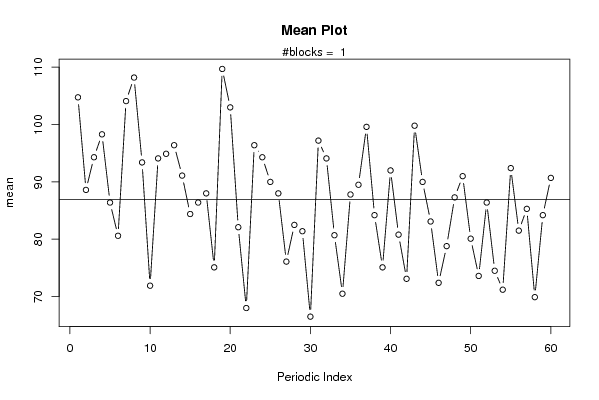
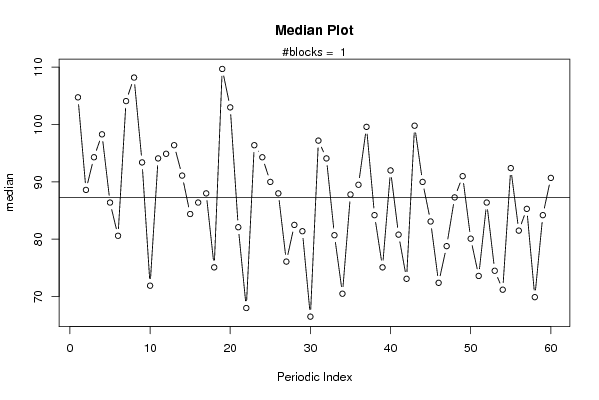
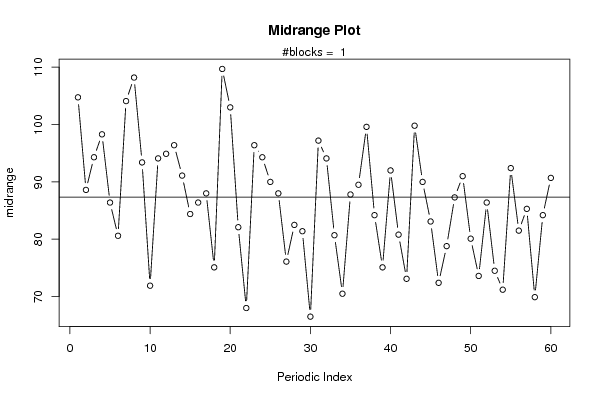
Je mag de blockwidth niet op 60 instellen, zo kan er niet vergeleken worden. Het is zo dan de mean plot, de gemiddelde berekend van de verschillende jaren. 1 jaar is 12 maanden, dus hij moet de jaren echt kunnen vergelijken. Blockwidth moet dus op 12 staan
2008-11-06 16:27:02 [Bas van Keken] [reply
Link naar computatie bij blockwith = 12:
http://www.freestatistics.org/blog/index.php?v=date/2008/Nov/06/t1225988779abnoaq038l1b5xt.htm

De drie vragen die ontstaan bij deze meanplot zijn dan (EDA 1.3.3.20):

1. Are there any shifts in location?
Antwoord: Ja
2. What is the magnitude of the shifts in location?
Antwoord: Van 6 tot 7 aanzienlijk en van 10 tot 11 groot.
3. Is there a distinct pattern in the shifts in location?
Antwoord: Nee.
2008-11-06 16:28:30 [Bas van Keken] [reply
Verder heeft u ook bij deze blog uw accountnaam en wachtwoord niet vermeld waardoor de blog op 'unverified author' staat.
2008-11-08 10:19:31 [Gert De la Haye] [reply
seizoenaliteit kan het beste nagegaan worden als de blockwidth op 12 staat!
2008-11-08 10:27:07 [Gert De la Haye] [reply
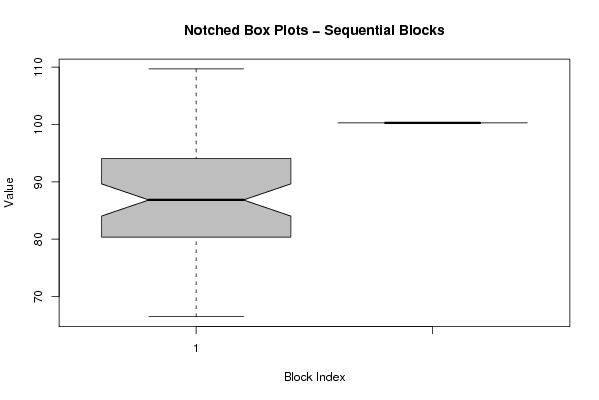
omdat je dus de blockwidth verhoogd hebt, staat er bij de grafiek notched boxplots-sequential blocks slechts 1 blokje. deze grafiek is relevant voor task 1, q3! Hier kan je zien dat de mediaan in de loop der jaren daalt
2008-11-09 15:47:29 [8e2cc0b2ef568da46d009b2f601285b2] [reply
Foutief het blog opgeslagen, mogelijk vergeten passwoord in te vullen.

Het aantal blockwidths moet op 12 staan en niet op 60. De 12 staat voor het aantal meetingen per jaar. Hierdoor krijg je een grafiek waarvan de x-as de 12 meetingen/maanden voorstellen en de waarde bekomen op de y-as het gemiddelde van al deze meetingen over de verschillende jaren voor die maand.

Van deze grafiek kan je dan seizoenaliteit aflezen.
2008-11-09 16:00:12 [8e2cc0b2ef568da46d009b2f601285b2] [reply
Ik verwijs naar de reproductie met width 12 van bas http://www.freestatistics.org/blog/index.php?v=date/2008/Nov/06/t1225988779abnoaq038l1b5xt.htm

Als je de 'notched box plots - sequential blocks' grafiek bekijkt kan je eenvoudig aflezen of je met een eerder toevallige daling of een significante daling te maken hebt.

De inkepingen geven het betrouwbaarheids interval 95% weer hierin kan de mediaan verschuiven. We merken dat alle intervallen overlappen van jaar 1 tot 4 dus deze 'daling' kunnen we toeschrijven aan toeval. Enkel tussen jaar 1 en jaar 5 is er een randgeval. Toch kunnen we besluiten dat de daling niet significant is.
2008-11-11 19:43:45 [An De Koninck] [reply
Het was fout om de blockwidth van 12 naar 60 te veranderen. Ik had dit echter gedaan omdat ik dacht dat je zo beter seizonaliteit kon aflezen, omdat je dan kan vergelijken over verschillende jaren. één jaar kan immers sterk beïnvloed worden door een economische crisis en dergelijke.
Ik dacht dus dat het getal 12 voor het aantal maanden staat, maar dit staat voor het aantal metingen per jaar.
Ook als je de grafiek van 'notched box plots - sequential blocks' erbij neemt kan je duidelijk zien dat het over een daling gaat en dat deze betrouwbaar is. Dit kan je afleiden doordat de 5 boxen mooi met elkaar overlappen.
2008-12-01 18:26:35 [0762c65deec3d397cd9f26b3749a0847] [reply
je hebt de blockwith verandert van 12 naar 60, Het is de bedoeling dat deze op 12 blijft staan zodat er een periodiek gemiddelde kan berekent worden (telkens van dezelfde maand over verschillende jaren bv.) Dan kunnen we concluderen dat er een siginificant verschil is.

Post a new message
Dataseries X:
109.20
88.60
94.30
98.30
86.40
80.60
104.10
108.20
93.40
71.90
94.10
94.90
96.40
91.10
84.40
86.40
88.00
75.10
109.70
103.00
82.10
68.00
96.40
94.30
90.00
88.00
76.10
82.50
81.40
66.50
97.20
94.10
80.70
70.50
87.80
89.50
99.60
84.20
75.10
92.00
80.80
73.10
99.80
90.00
83.10
72.40
78.80
87.30
91.00
80.10
73.60
86.40
74.50
71.20
92.40
81.50
85.30
69.90
84.20
90.70
100.30


Summary of computational transaction
Raw Inputview raw input (R code)
Raw Outputview raw output of R engine
Computing time2 seconds
R Server'George Udny Yule' @ 72.249.76.132

\begin{tabular}{lllllllll}
\hline
Summary of computational transaction \tabularnewline
Raw Input & view raw input (R code)  \tabularnewline
Raw Output & view raw output of R engine  \tabularnewline
Computing time & 2 seconds \tabularnewline
R Server & 'George Udny Yule' @ 72.249.76.132 \tabularnewline
\hline
\end{tabular}
%Source: https://freestatistics.org/blog/index.php?pk=19868&T=0

[TABLE]
[ROW][C]Summary of computational transaction[/C][/ROW]
[ROW][C]Raw Input[/C][C]view raw input (R code) [/C][/ROW]
[ROW][C]Raw Output[/C][C]view raw output of R engine [/C][/ROW]
[ROW][C]Computing time[/C][C]2 seconds[/C][/ROW]
[ROW][C]R Server[/C][C]'George Udny Yule' @ 72.249.76.132[/C][/ROW]
[/TABLE]
Source: https://freestatistics.org/blog/index.php?pk=19868&T=0

Globally Unique Identifier (entire table): ba.freestatistics.org/blog/index.php?pk=19868&T=0

As an alternative you can also use a QR Code:  

The GUIDs for individual cells are displayed in the table below:

Summary of computational transaction
Raw Inputview raw input (R code)
Raw Outputview raw output of R engine
Computing time2 seconds
R Server'George Udny Yule' @ 72.249.76.132


Parameters (Session):
par1 = 60 ;
Parameters (R input):
par1 = 60 ;
R code (references can be found in the software module):
par1 <- as.numeric(par1)
(n <- length(x))
(np <- floor(n / par1))
arr <- array(NA,dim=c(par1,np+1))
ari <- array(0,dim=par1)
j <- 0
for (i in 1:n)
{
j = j + 1
ari[j] = ari[j] + 1
arr[j,ari[j]] <- x[i]
if (j == par1) j = 0
}
ari
arr
arr.mean <- array(NA,dim=par1)
arr.median <- array(NA,dim=par1)
arr.midrange <- array(NA,dim=par1)
for (j in 1:par1)
{
arr.mean[j] <- mean(arr[j,],na.rm=TRUE)
arr.median[j] <- median(arr[j,],na.rm=TRUE)
arr.midrange[j] <- (quantile(arr[j,],0.75,na.rm=TRUE) + quantile(arr[j,],0.25,na.rm=TRUE)) / 2
}
overall.mean <- mean(x)
overall.median <- median(x)
overall.midrange <- (quantile(x,0.75) + quantile(x,0.25)) / 2
bitmap(file='plot1.png')
plot(arr.mean,type='b',ylab='mean',main='Mean Plot',xlab='Periodic Index')
mtext(paste('#blocks = ',np))
abline(overall.mean,0)
dev.off()
bitmap(file='plot2.png')
plot(arr.median,type='b',ylab='median',main='Median Plot',xlab='Periodic Index')
mtext(paste('#blocks = ',np))
abline(overall.median,0)
dev.off()
bitmap(file='plot3.png')
plot(arr.midrange,type='b',ylab='midrange',main='Midrange Plot',xlab='Periodic Index')
mtext(paste('#blocks = ',np))
abline(overall.midrange,0)
dev.off()
bitmap(file='plot4.png')
z <- data.frame(t(arr))
names(z) <- c(1:par1)
(boxplot(z,notch=TRUE,col='grey',xlab='Periodic Index',ylab='Value',main='Notched Box Plots - Periodic Subseries'))
dev.off()
bitmap(file='plot5.png')
z <- data.frame(arr)
names(z) <- c(1:np)
(boxplot(z,notch=TRUE,col='grey',xlab='Block Index',ylab='Value',main='Notched Box Plots - Sequential Blocks'))
dev.off()
bitmap(file='plot6.png')
z <- data.frame(cbind(arr.mean,arr.median,arr.midrange))
names(z) <- list('mean','median','midrange')
(boxplot(z,notch=TRUE,col='grey',ylab='Overall Central Tendency',main='Notched Box Plots'))
dev.off()