Free Statistics

of Irreproducible Research!

Author's title

Q7: Investigate the validity of the model uitvoer VK/totaal uitvoer belgie ...

Author*The author of this computation has been verified*
R Software Modulerwasp_edauni.wasp
Title produced by softwareUnivariate Explorative Data Analysis
Date of computationMon, 27 Oct 2008 11:41:08 -0600
Cite this page as followsStatistical Computations at FreeStatistics.org, Office for Research Development and Education, URL https://freestatistics.org/blog/index.php?v=date/2008/Oct/27/t1225129331uwm04hp8jgyex2k.htm/, Retrieved Sat, 18 May 2024 19:21:13 +0000
Statistical Computations at FreeStatistics.org, Office for Research Development and Education, URL https://freestatistics.org/blog/index.php?pk=19319, Retrieved Sat, 18 May 2024 19:21:13 +0000
QR Codes:

Original text written by user:
IsPrivate?No (this computation is public)
User-defined keywords
Estimated Impact172
Family? (F = Feedback message, R = changed R code, M = changed R Module, P = changed Parameters, D = changed Data)
F     [Univariate Explorative Data Analysis] [Investigating dis...] [2007-10-22 19:45:25] [b9964c45117f7aac638ab9056d451faa]
-    D  [Univariate Explorative Data Analysis] [Q7: Investigate t...] [2008-10-24 11:37:03] [1e1d8320a8a1170c475bf6e4ce119de6]
F   P       [Univariate Explorative Data Analysis] [Q7: Investigate t...] [2008-10-27 17:41:08] [fdd69703d301fae09456f660b2f52997] [Current]
-   P         [Univariate Explorative Data Analysis] [Seizoenailteit] [2008-11-03 21:14:56] [85841a4a203c2f9589565c024425a91b]
Feedback Forum
2008-10-30 14:33:36 [Gert De la Haye] [reply
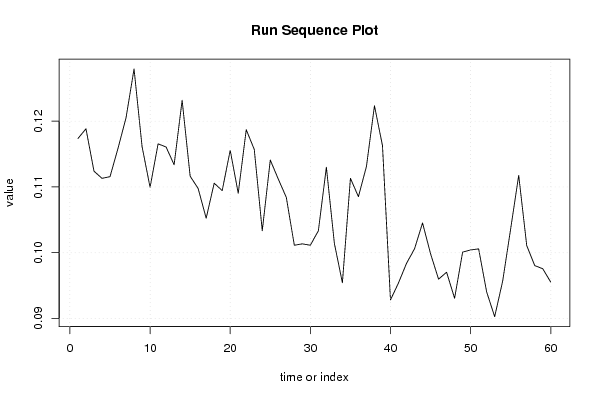
er is zeker geen gelijke spreiding voor de vierde assumptie, als je de grafiek in 2 kapt kan er gezien worden dat de 2 delen zeker geen gelijke spreiding bevatten, vooral de piek rond de 40ste observatie toont dit aan!
2008-11-02 18:31:43 [Ilknur Günes] [reply
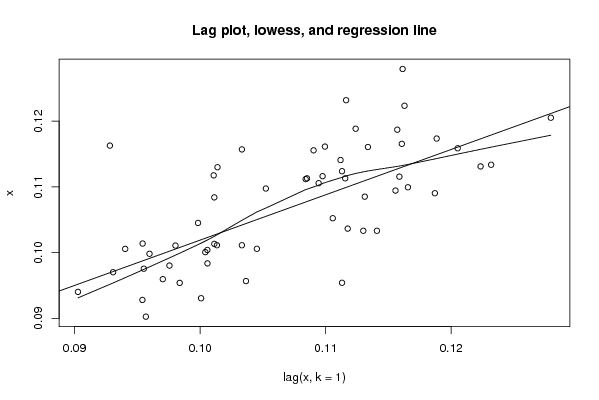
Zoals bij vraag 2: assumptie 1 af te lezen op lag-plot grafiek
2008-11-02 18:38:32 [Ilknur Günes] [reply
Voor Q10: ook best lag plot!
2008-11-03 20:08:04 [Thomas Baken] [reply
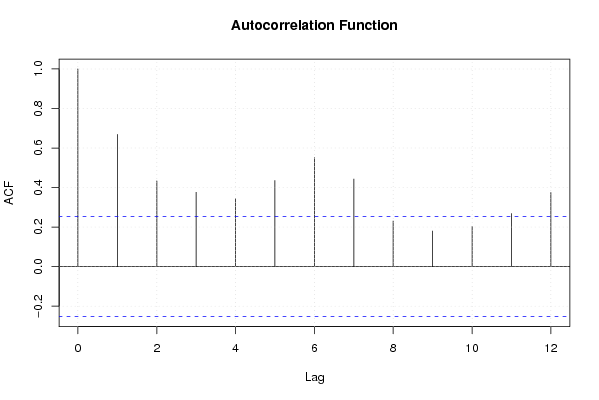
De student geeft de bij de eerste assumptie niet de oplossing weer. Hij zegt niet of de data autocorrelated is of niet, bijgevolg ben ik tot de conclusie gekomen, na het bestuderen van de Autocorrelated function, dat er wel degelijk geen autocorrelatie bestaat. De student heeft zich met de foute grafiek beholpen. Voor de derde assumptie was het van belang naar het Run Sequence Plot te kijken waar we een fluctuerend verloop bemerken. Bijgevolg kunnen we nu al besluiten dat dit geen goed model is, er is niet aan alle voorwaarden voldaan.
2008-11-03 20:11:08 [Thomas Baken] [reply
Bij nader inzien bemerk is toch geen terugkerend patroon in het run sequence plot, we kunnen dus niet spreken van seizoensgebondenheid.
2008-11-03 21:17:31 [Bart Haemels] [reply
Assumptie 1: Je kijkt hier eerst naar de Run Sequence plot, dit is echter niet nodig. Kijk Direct naar de Lag plot. Dan bemerk je dat er toch wel een autocorrelatie is.

Assumpie 2: Dit antwoord is goed. er is een gelijke sprijding.

Assumptie 3: Hier moet je kijken naar de Run Sequence plot. En hierop zie je dat er een daling is.

Assumptie 4: Je moet niet naar de lag pmlot kijken maar naar de autocorrelation functie.
Zet je lag ook op 36 dan bekom je dit

http://www.freestatistics.org/blog/index.php?v=date/2008/Nov/03/t122574695069dpvq25tngvfix.htm

Hier kun je een halfjaarlijkse seizoenaliteit in opmerken. Ze gaat wel in dalende trend.
2008-11-03 21:19:35 [Bart Haemels] [reply
Q10: Er is zeker en vast seizoenaliteit, kijk mijn voorgande link.

Post a new message
Dataseries X:
0.117354396717212
0.118845681032272
0.112391885267935
0.111306414892192
0.111557866161293
0.115874513020299
0.120518600028397
0.127937652516104
0.11613316666403
0.109945475878252
0.116553866162416
0.116068157652546
0.113370026071156
0.123182199760877
0.111632647202366
0.109758101752217
0.105238647621144
0.110567657536647
0.109445829081846
0.115565377944385
0.109040168162481
0.118699838338174
0.115706070657763
0.103330532839008
0.114086556139986
0.111186708004422
0.108409409523554
0.101131998751098
0.101340239460215
0.101132392401369
0.103330089281936
0.112997274264224
0.101388063209412
0.0954252014189293
0.111307936120104
0.108517581966327
0.113117723156533
0.12234246171967
0.116281802327739
0.092816312987346
0.0954083259281368
0.0983760049075001
0.100589152001216
0.104522549361392
0.0998363447670241
0.0959721467215449
0.097031371532279
0.093072585629373
0.100082898456186
0.100416078984485
0.10057893372505
0.0940357410855729
0.0902738332694873
0.0956823578799632
0.103656114777059
0.111759459418603
0.10108471855862
0.0980399013830847
0.0975611265478894
0.0955190702462385


Summary of computational transaction
Raw Inputview raw input (R code)
Raw Outputview raw output of R engine
Computing time3 seconds
R Server'George Udny Yule' @ 72.249.76.132

\begin{tabular}{lllllllll}
\hline
Summary of computational transaction \tabularnewline
Raw Input & view raw input (R code)  \tabularnewline
Raw Output & view raw output of R engine  \tabularnewline
Computing time & 3 seconds \tabularnewline
R Server & 'George Udny Yule' @ 72.249.76.132 \tabularnewline
\hline
\end{tabular}
%Source: https://freestatistics.org/blog/index.php?pk=19319&T=0

[TABLE]
[ROW][C]Summary of computational transaction[/C][/ROW]
[ROW][C]Raw Input[/C][C]view raw input (R code) [/C][/ROW]
[ROW][C]Raw Output[/C][C]view raw output of R engine [/C][/ROW]
[ROW][C]Computing time[/C][C]3 seconds[/C][/ROW]
[ROW][C]R Server[/C][C]'George Udny Yule' @ 72.249.76.132[/C][/ROW]
[/TABLE]
Source: https://freestatistics.org/blog/index.php?pk=19319&T=0

Globally Unique Identifier (entire table): ba.freestatistics.org/blog/index.php?pk=19319&T=0

As an alternative you can also use a QR Code:  

The GUIDs for individual cells are displayed in the table below:

Summary of computational transaction
Raw Inputview raw input (R code)
Raw Outputview raw output of R engine
Computing time3 seconds
R Server'George Udny Yule' @ 72.249.76.132


Descriptive Statistics
# observations60
minimum0.0902738332694873
Q10.100332783852410
median0.108778875064404
mean0.107138920647910
Q30.113549158588364
maximum0.127937652516104

\begin{tabular}{lllllllll}
\hline
Descriptive Statistics \tabularnewline
# observations & 60 \tabularnewline
minimum & 0.0902738332694873 \tabularnewline
Q1 & 0.100332783852410 \tabularnewline
median & 0.108778875064404 \tabularnewline
mean & 0.107138920647910 \tabularnewline
Q3 & 0.113549158588364 \tabularnewline
maximum & 0.127937652516104 \tabularnewline
\hline
\end{tabular}
%Source: https://freestatistics.org/blog/index.php?pk=19319&T=1

[TABLE]
[ROW][C]Descriptive Statistics[/C][/ROW]
[ROW][C]# observations[/C][C]60[/C][/ROW]
[ROW][C]minimum[/C][C]0.0902738332694873[/C][/ROW]
[ROW][C]Q1[/C][C]0.100332783852410[/C][/ROW]
[ROW][C]median[/C][C]0.108778875064404[/C][/ROW]
[ROW][C]mean[/C][C]0.107138920647910[/C][/ROW]
[ROW][C]Q3[/C][C]0.113549158588364[/C][/ROW]
[ROW][C]maximum[/C][C]0.127937652516104[/C][/ROW]
[/TABLE]
Source: https://freestatistics.org/blog/index.php?pk=19319&T=1

Globally Unique Identifier (entire table): ba.freestatistics.org/blog/index.php?pk=19319&T=1

As an alternative you can also use a QR Code:  

The GUIDs for individual cells are displayed in the table below:

Descriptive Statistics
# observations60
minimum0.0902738332694873
Q10.100332783852410
median0.108778875064404
mean0.107138920647910
Q30.113549158588364
maximum0.127937652516104


Parameters (Session):
par1 = 0 ; par2 = 12 ;
Parameters (R input):
par1 = 0 ; par2 = 12 ;
R code (references can be found in the software module):
par1 <- as.numeric(par1)
par2 <- as.numeric(par2)
x <- as.ts(x)
library(lattice)
bitmap(file='pic1.png')
plot(x,type='l',main='Run Sequence Plot',xlab='time or index',ylab='value')
grid()
dev.off()
bitmap(file='pic2.png')
hist(x)
grid()
dev.off()
bitmap(file='pic3.png')
if (par1 > 0)
{
densityplot(~x,col='black',main=paste('Density Plot bw = ',par1),bw=par1)
} else {
densityplot(~x,col='black',main='Density Plot')
}
dev.off()
bitmap(file='pic4.png')
qqnorm(x)
grid()
dev.off()
if (par2 > 0)
{
bitmap(file='lagplot.png')
dum <- cbind(lag(x,k=1),x)
dum
dum1 <- dum[2:length(x),]
dum1
z <- as.data.frame(dum1)
z
plot(z,main=paste('Lag plot, lowess, and regression line'))
lines(lowess(z))
abline(lm(z))
dev.off()
bitmap(file='pic5.png')
acf(x,lag.max=par2,main='Autocorrelation Function')
grid()
dev.off()
}
summary(x)
load(file='createtable')
a<-table.start()
a<-table.row.start(a)
a<-table.element(a,'Descriptive Statistics',2,TRUE)
a<-table.row.end(a)
a<-table.row.start(a)
a<-table.element(a,'# observations',header=TRUE)
a<-table.element(a,length(x))
a<-table.row.end(a)
a<-table.row.start(a)
a<-table.element(a,'minimum',header=TRUE)
a<-table.element(a,min(x))
a<-table.row.end(a)
a<-table.row.start(a)
a<-table.element(a,'Q1',header=TRUE)
a<-table.element(a,quantile(x,0.25))
a<-table.row.end(a)
a<-table.row.start(a)
a<-table.element(a,'median',header=TRUE)
a<-table.element(a,median(x))
a<-table.row.end(a)
a<-table.row.start(a)
a<-table.element(a,'mean',header=TRUE)
a<-table.element(a,mean(x))
a<-table.row.end(a)
a<-table.row.start(a)
a<-table.element(a,'Q3',header=TRUE)
a<-table.element(a,quantile(x,0.75))
a<-table.row.end(a)
a<-table.row.start(a)
a<-table.element(a,'maximum',header=TRUE)
a<-table.element(a,max(x))
a<-table.row.end(a)
a<-table.end(a)
table.save(a,file='mytable.tab')