Free Statistics

of Irreproducible Research!

Author's title

Author*The author of this computation has been verified*
R Software Modulerwasp_tukeylambda.wasp
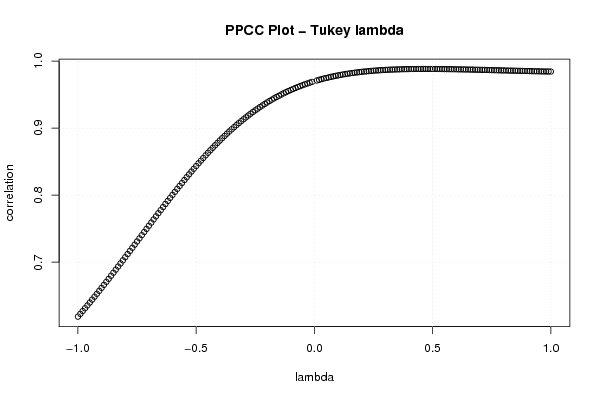
Title produced by softwareTukey lambda PPCC Plot
Date of computationSun, 26 Oct 2008 11:09:26 -0600
Cite this page as followsStatistical Computations at FreeStatistics.org, Office for Research Development and Education, URL https://freestatistics.org/blog/index.php?v=date/2008/Oct/26/t1225041026gmpynzozmqa2wtf.htm/, Retrieved Sun, 19 May 2024 00:25:58 +0000
Statistical Computations at FreeStatistics.org, Office for Research Development and Education, URL https://freestatistics.org/blog/index.php?pk=18983, Retrieved Sun, 19 May 2024 00:25:58 +0000
QR Codes:

Original text written by user:
IsPrivate?No (this computation is public)
User-defined keywords
Estimated Impact173
Family? (F = Feedback message, R = changed R code, M = changed R Module, P = changed Parameters, D = changed Data)
F     [Tukey lambda PPCC Plot] [Investigating dis...] [2007-10-22 19:59:15] [b9964c45117f7aac638ab9056d451faa]
-    D    [Tukey lambda PPCC Plot] [Q8 Invest distrib...] [2008-10-26 17:09:26] [e81ac192d6ae6d77191d83851a692999] [Current]
Feedback Forum

Post a new message
Dataseries X:
459191
466617
477604
482132
488837
490761
495016
491156
502519
509405
516184
525109
536953
543315
554950
574343
600423
605963
605672
626140
650740
644045
659971
677720
685500
692880
713398
726815
726448
722721
712776
707154
721030
698097
697694
696268
669371
642615
639078
632034
651048
652996
651578
672179
684741
685734
691557
717499
739340
760643
769425
790364
782748
799182
817333
834295
851736
849382
838158
817005


Summary of computational transaction
Raw Inputview raw input (R code)
Raw Outputview raw output of R engine
Computing time1 seconds
R Server'George Udny Yule' @ 72.249.76.132

\begin{tabular}{lllllllll}
\hline
Summary of computational transaction \tabularnewline
Raw Input & view raw input (R code)  \tabularnewline
Raw Output & view raw output of R engine  \tabularnewline
Computing time & 1 seconds \tabularnewline
R Server & 'George Udny Yule' @ 72.249.76.132 \tabularnewline
\hline
\end{tabular}
%Source: https://freestatistics.org/blog/index.php?pk=18983&T=0

[TABLE]
[ROW][C]Summary of computational transaction[/C][/ROW]
[ROW][C]Raw Input[/C][C]view raw input (R code) [/C][/ROW]
[ROW][C]Raw Output[/C][C]view raw output of R engine [/C][/ROW]
[ROW][C]Computing time[/C][C]1 seconds[/C][/ROW]
[ROW][C]R Server[/C][C]'George Udny Yule' @ 72.249.76.132[/C][/ROW]
[/TABLE]
Source: https://freestatistics.org/blog/index.php?pk=18983&T=0

Globally Unique Identifier (entire table): ba.freestatistics.org/blog/index.php?pk=18983&T=0

As an alternative you can also use a QR Code:  

The GUIDs for individual cells are displayed in the table below:

Summary of computational transaction
Raw Inputview raw input (R code)
Raw Outputview raw output of R engine
Computing time1 seconds
R Server'George Udny Yule' @ 72.249.76.132


Tukey Lambda - Key Values
Distribution (lambda)Correlation
Approx. Cauchy (lambda=-1)0.618719506414452
Exact Logistic (lambda=0)0.970039112682063
Approx. Normal (lambda=0.14)0.981189350090035
U-shaped (lambda=0.5)0.988298288590018
Exactly Uniform (lambda=1)0.984379935230257

\begin{tabular}{lllllllll}
\hline
Tukey Lambda - Key Values \tabularnewline
Distribution (lambda) & Correlation \tabularnewline
Approx. Cauchy (lambda=-1) & 0.618719506414452 \tabularnewline
Exact Logistic (lambda=0) & 0.970039112682063 \tabularnewline
Approx. Normal (lambda=0.14) & 0.981189350090035 \tabularnewline
U-shaped (lambda=0.5) & 0.988298288590018 \tabularnewline
Exactly Uniform (lambda=1) & 0.984379935230257 \tabularnewline
\hline
\end{tabular}
%Source: https://freestatistics.org/blog/index.php?pk=18983&T=1

[TABLE]
[ROW][C]Tukey Lambda - Key Values[/C][/ROW]
[ROW][C]Distribution (lambda)[/C][C]Correlation[/C][/ROW]
[ROW][C]Approx. Cauchy (lambda=-1)[/C][C]0.618719506414452[/C][/ROW]
[ROW][C]Exact Logistic (lambda=0)[/C][C]0.970039112682063[/C][/ROW]
[ROW][C]Approx. Normal (lambda=0.14)[/C][C]0.981189350090035[/C][/ROW]
[ROW][C]U-shaped (lambda=0.5)[/C][C]0.988298288590018[/C][/ROW]
[ROW][C]Exactly Uniform (lambda=1)[/C][C]0.984379935230257[/C][/ROW]
[/TABLE]
Source: https://freestatistics.org/blog/index.php?pk=18983&T=1

Globally Unique Identifier (entire table): ba.freestatistics.org/blog/index.php?pk=18983&T=1

As an alternative you can also use a QR Code:  

The GUIDs for individual cells are displayed in the table below:

Tukey Lambda - Key Values
Distribution (lambda)Correlation
Approx. Cauchy (lambda=-1)0.618719506414452
Exact Logistic (lambda=0)0.970039112682063
Approx. Normal (lambda=0.14)0.981189350090035
U-shaped (lambda=0.5)0.988298288590018
Exactly Uniform (lambda=1)0.984379935230257


Parameters (Session):
Parameters (R input):
R code (references can be found in the software module):
gp <- function(lambda, p)
{
(p^lambda-(1-p)^lambda)/lambda
}
sortx <- sort(x)
c <- array(NA,dim=c(201))
for (i in 1:201)
{
if (i != 101) c[i] <- cor(gp(ppoints(x), lambda=(i-101)/100),sortx)
}
bitmap(file='test1.png')
plot((-100:100)/100,c[1:201],xlab='lambda',ylab='correlation',main='PPCC Plot - Tukey lambda')
grid()
dev.off()
load(file='createtable')
a<-table.start()
a<-table.row.start(a)
a<-table.element(a,'Tukey Lambda - Key Values',2,TRUE)
a<-table.row.end(a)
a<-table.row.start(a)
a<-table.element(a,'Distribution (lambda)',1,TRUE)
a<-table.element(a,'Correlation',1,TRUE)
a<-table.row.end(a)
a<-table.row.start(a)
a<-table.element(a,'Approx. Cauchy (lambda=-1)',header=TRUE)
a<-table.element(a,c[1])
a<-table.row.end(a)
a<-table.row.start(a)
a<-table.element(a,'Exact Logistic (lambda=0)',header=TRUE)
a<-table.element(a,(c[100]+c[102])/2)
a<-table.row.end(a)
a<-table.row.start(a)
a<-table.element(a,'Approx. Normal (lambda=0.14)',header=TRUE)
a<-table.element(a,c[115])
a<-table.row.end(a)
a<-table.row.start(a)
a<-table.element(a,'U-shaped (lambda=0.5)',header=TRUE)
a<-table.element(a,c[151])
a<-table.row.end(a)
a<-table.row.start(a)
a<-table.element(a,'Exactly Uniform (lambda=1)',header=TRUE)
a<-table.element(a,c[201])
a<-table.row.end(a)
a<-table.end(a)
table.save(a,file='mytable.tab')