Free Statistics

of Irreproducible Research!

Author's title

Author*The author of this computation has been verified*
R Software Modulerwasp_correlation.wasp
Title produced by softwarePearson Correlation
Date of computationMon, 20 Oct 2008 16:14:06 -0600
Cite this page as followsStatistical Computations at FreeStatistics.org, Office for Research Development and Education, URL https://freestatistics.org/blog/index.php?v=date/2008/Oct/21/t1224540900kq8ysja3m8tkbg2.htm/, Retrieved Sat, 18 May 2024 15:26:49 +0000
Statistical Computations at FreeStatistics.org, Office for Research Development and Education, URL https://freestatistics.org/blog/index.php?pk=18248, Retrieved Sat, 18 May 2024 15:26:49 +0000
QR Codes:

Original text written by user:
IsPrivate?No (this computation is public)
User-defined keywords
Estimated Impact183
Family? (F = Feedback message, R = changed R code, M = changed R Module, P = changed Parameters, D = changed Data)
-     [Pearson Correlation] [investigating Ass...] [2007-10-22 22:15:01] [8cd6641b921d30ebe00b648d1481bba0]
F    D    [Pearson Correlation] [correlatie] [2008-10-20 22:14:06] [0d500ce70fb61d771562626855e78bdd] [Current]
Feedback Forum
2008-10-24 09:56:05 [Siem Van Opstal] [reply
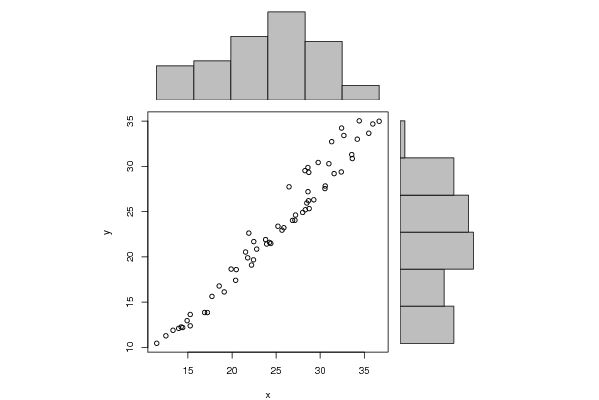
hier maakt de student een verkeerde conclusie. de correlatie is zeer groot, namelijk 0.98. Ook uit de scatteplot kunnen we zien dat het bijna een perfect stijgende rechte is, wat wijst op een zeer grote correlatie.

Post a new message
Dataseries X:
14.403
18.543
19.900
21.532
22.465
28.479
30.568
33.574
35.964
32.419
28.272
14.908
17.210
22.210
24.256
25.666
26.859
28.311
30.536
33.638
36.683
34.428
29.770
15.258
16.889
20.408
23.926
27.133
28.007
28.748
29.270
32.389
35.505
32.682
28.702
13.950
15.260
19.115
22.433
24.395
25.875
27.199
28.674
31.577
34.202
31.300
26.465
12.497
14.234
17.722
20.479
21.772
22.797
23.808
25.206
28.613
30.982
28.600
21.902
11.458
13.308
Dataseries Y:
12.196
16.781
18.646
20.533
21.683
25.945
27.829
31.290
34.675
34.223
29.522
12.952
13.850
19.093
21.588
22.948
24.024
25.200
27.542
30.858
34.977
35.019
30.420
13.635
13.855
17.409
21.417
24.042
24.906
25.330
26.298
29.376
33.648
33.401
29.330
12.104
12.383
16.128
19.670
21.475
23.217
24.615
26.197
29.192
32.995
32.720
27.735
11.282
12.251
15.632
18.593
19.894
20.854
21.904
23.379
27.197
30.284
29.864
22.622
10.454
11.891


Summary of computational transaction
Raw Inputview raw input (R code)
Raw Outputview raw output of R engine
Computing time2 seconds
R Server'Sir Ronald Aylmer Fisher' @ 193.190.124.24

\begin{tabular}{lllllllll}
\hline
Summary of computational transaction \tabularnewline
Raw Input & view raw input (R code)  \tabularnewline
Raw Output & view raw output of R engine  \tabularnewline
Computing time & 2 seconds \tabularnewline
R Server & 'Sir Ronald Aylmer Fisher' @ 193.190.124.24 \tabularnewline
\hline
\end{tabular}
%Source: https://freestatistics.org/blog/index.php?pk=18248&T=0

[TABLE]
[ROW][C]Summary of computational transaction[/C][/ROW]
[ROW][C]Raw Input[/C][C]view raw input (R code) [/C][/ROW]
[ROW][C]Raw Output[/C][C]view raw output of R engine [/C][/ROW]
[ROW][C]Computing time[/C][C]2 seconds[/C][/ROW]
[ROW][C]R Server[/C][C]'Sir Ronald Aylmer Fisher' @ 193.190.124.24[/C][/ROW]
[/TABLE]
Source: https://freestatistics.org/blog/index.php?pk=18248&T=0

Globally Unique Identifier (entire table): ba.freestatistics.org/blog/index.php?pk=18248&T=0

As an alternative you can also use a QR Code:  

The GUIDs for individual cells are displayed in the table below:

Summary of computational transaction
Raw Inputview raw input (R code)
Raw Outputview raw output of R engine
Computing time2 seconds
R Server'Sir Ronald Aylmer Fisher' @ 193.190.124.24


Pearson Product Moment Correlation - Ungrouped Data
StatisticVariable XVariable Y
Mean24.972688524590223.2618524590164
Biased Variance44.391434542327349.9359050110185
Biased Standard Deviation6.662689737810657.0665341583423
Covariance46.9617852032787
Correlation0.981092511142856
Determination0.962542515420595
T-Test38.9373742828853
p-value (2 sided)0
p-value (1 sided)0
Degrees of Freedom59
Number of Observations61

\begin{tabular}{lllllllll}
\hline
Pearson Product Moment Correlation - Ungrouped Data \tabularnewline
Statistic & Variable X & Variable Y \tabularnewline
Mean & 24.9726885245902 & 23.2618524590164 \tabularnewline
Biased Variance & 44.3914345423273 & 49.9359050110185 \tabularnewline
Biased Standard Deviation & 6.66268973781065 & 7.0665341583423 \tabularnewline
Covariance & 46.9617852032787 \tabularnewline
Correlation & 0.981092511142856 \tabularnewline
Determination & 0.962542515420595 \tabularnewline
T-Test & 38.9373742828853 \tabularnewline
p-value (2 sided) & 0 \tabularnewline
p-value (1 sided) & 0 \tabularnewline
Degrees of Freedom & 59 \tabularnewline
Number of Observations & 61 \tabularnewline
\hline
\end{tabular}
%Source: https://freestatistics.org/blog/index.php?pk=18248&T=1

[TABLE]
[ROW][C]Pearson Product Moment Correlation - Ungrouped Data[/C][/ROW]
[ROW][C]Statistic[/C][C]Variable X[/C][C]Variable Y[/C][/ROW]
[ROW][C]Mean[/C][C]24.9726885245902[/C][C]23.2618524590164[/C][/ROW]
[ROW][C]Biased Variance[/C][C]44.3914345423273[/C][C]49.9359050110185[/C][/ROW]
[ROW][C]Biased Standard Deviation[/C][C]6.66268973781065[/C][C]7.0665341583423[/C][/ROW]
[ROW][C]Covariance[/C][C]46.9617852032787[/C][/ROW]
[ROW][C]Correlation[/C][C]0.981092511142856[/C][/ROW]
[ROW][C]Determination[/C][C]0.962542515420595[/C][/ROW]
[ROW][C]T-Test[/C][C]38.9373742828853[/C][/ROW]
[ROW][C]p-value (2 sided)[/C][C]0[/C][/ROW]
[ROW][C]p-value (1 sided)[/C][C]0[/C][/ROW]
[ROW][C]Degrees of Freedom[/C][C]59[/C][/ROW]
[ROW][C]Number of Observations[/C][C]61[/C][/ROW]
[/TABLE]
Source: https://freestatistics.org/blog/index.php?pk=18248&T=1

Globally Unique Identifier (entire table): ba.freestatistics.org/blog/index.php?pk=18248&T=1

As an alternative you can also use a QR Code:  

The GUIDs for individual cells are displayed in the table below:

Pearson Product Moment Correlation - Ungrouped Data
StatisticVariable XVariable Y
Mean24.972688524590223.2618524590164
Biased Variance44.391434542327349.9359050110185
Biased Standard Deviation6.662689737810657.0665341583423
Covariance46.9617852032787
Correlation0.981092511142856
Determination0.962542515420595
T-Test38.9373742828853
p-value (2 sided)0
p-value (1 sided)0
Degrees of Freedom59
Number of Observations61


Parameters (Session):
Parameters (R input):
R code (references can be found in the software module):
bitmap(file='test1.png')
histx <- hist(x, plot=FALSE)
histy <- hist(y, plot=FALSE)
maxcounts <- max(c(histx$counts, histx$counts))
xrange <- c(min(x),max(x))
yrange <- c(min(y),max(y))
nf <- layout(matrix(c(2,0,1,3),2,2,byrow=TRUE), c(3,1), c(1,3), TRUE)
par(mar=c(4,4,1,1))
plot(x, y, xlim=xrange, ylim=yrange, xlab=xlab, ylab=ylab)
par(mar=c(0,4,1,1))
barplot(histx$counts, axes=FALSE, ylim=c(0, maxcounts), space=0)
par(mar=c(4,0,1,1))
barplot(histy$counts, axes=FALSE, xlim=c(0, maxcounts), space=0, horiz=TRUE)
dev.off()
lx = length(x)
makebiased = (lx-1)/lx
varx = var(x)*makebiased
vary = var(y)*makebiased
corxy <- cor.test(x,y,method='pearson')
cxy <- as.matrix(corxy$estimate)[1,1]
load(file='createtable')
a<-table.start()
a<-table.row.start(a)
a<-table.element(a,'Pearson Product Moment Correlation - Ungrouped Data',3,TRUE)
a<-table.row.end(a)
a<-table.row.start(a)
a<-table.element(a,'Statistic',1,TRUE)
a<-table.element(a,'Variable X',1,TRUE)
a<-table.element(a,'Variable Y',1,TRUE)
a<-table.row.end(a)
a<-table.row.start(a)
a<-table.element(a,hyperlink('arithmetic_mean.htm','Mean',''),header=TRUE)
a<-table.element(a,mean(x))
a<-table.element(a,mean(y))
a<-table.row.end(a)
a<-table.row.start(a)
a<-table.element(a,hyperlink('biased.htm','Biased Variance',''),header=TRUE)
a<-table.element(a,varx)
a<-table.element(a,vary)
a<-table.row.end(a)
a<-table.row.start(a)
a<-table.element(a,hyperlink('biased1.htm','Biased Standard Deviation',''),header=TRUE)
a<-table.element(a,sqrt(varx))
a<-table.element(a,sqrt(vary))
a<-table.row.end(a)
a<-table.row.start(a)
a<-table.element(a,hyperlink('covariance.htm','Covariance',''),header=TRUE)
a<-table.element(a,cov(x,y),2)
a<-table.row.end(a)
a<-table.row.start(a)
a<-table.element(a,hyperlink('pearson_correlation.htm','Correlation',''),header=TRUE)
a<-table.element(a,cxy,2)
a<-table.row.end(a)
a<-table.row.start(a)
a<-table.element(a,hyperlink('coeff_of_determination.htm','Determination',''),header=TRUE)
a<-table.element(a,cxy*cxy,2)
a<-table.row.end(a)
a<-table.row.start(a)
a<-table.element(a,hyperlink('ttest_statistic.htm','T-Test',''),header=TRUE)
a<-table.element(a,as.matrix(corxy$statistic)[1,1],2)
a<-table.row.end(a)
a<-table.row.start(a)
a<-table.element(a,'p-value (2 sided)',header=TRUE)
a<-table.element(a,(p2 <- as.matrix(corxy$p.value)[1,1]),2)
a<-table.row.end(a)
a<-table.row.start(a)
a<-table.element(a,'p-value (1 sided)',header=TRUE)
a<-table.element(a,p2/2,2)
a<-table.row.end(a)
a<-table.row.start(a)
a<-table.element(a,'Degrees of Freedom',header=TRUE)
a<-table.element(a,lx-2,2)
a<-table.row.end(a)
a<-table.row.start(a)
a<-table.element(a,'Number of Observations',header=TRUE)
a<-table.element(a,lx,2)
a<-table.row.end(a)
a<-table.end(a)
table.save(a,file='mytable.tab')