Free Statistics
of Irreproducible Research!
Description of Statistical Computation | |||||||||||||||||||||
|---|---|---|---|---|---|---|---|---|---|---|---|---|---|---|---|---|---|---|---|---|---|
| Author's title | |||||||||||||||||||||
| Author | *The author of this computation has been verified* | ||||||||||||||||||||
| R Software Module | rwasp_backtobackhist.wasp | ||||||||||||||||||||
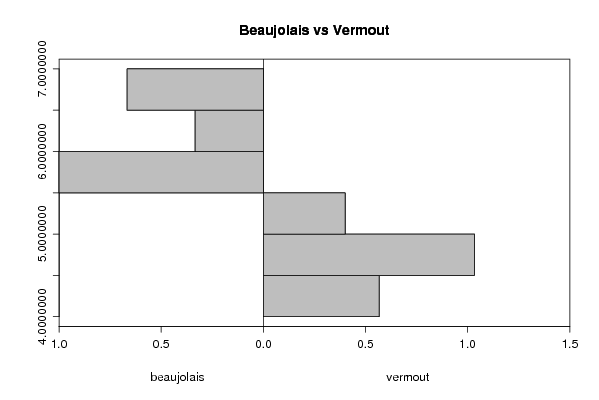
| Title produced by software | Back to Back Histogram | ||||||||||||||||||||
| Date of computation | Mon, 20 Oct 2008 14:50:17 -0600 | ||||||||||||||||||||
| Cite this page as follows | Statistical Computations at FreeStatistics.org, Office for Research Development and Education, URL https://freestatistics.org/blog/index.php?v=date/2008/Oct/20/t1224535865qiux7wlv5w14fja.htm/, Retrieved Sun, 19 May 2024 06:29:28 +0000 | ||||||||||||||||||||
| Statistical Computations at FreeStatistics.org, Office for Research Development and Education, URL https://freestatistics.org/blog/index.php?pk=18122, Retrieved Sun, 19 May 2024 06:29:28 +0000 | |||||||||||||||||||||
| QR Codes: | |||||||||||||||||||||
|
| |||||||||||||||||||||
| Original text written by user: | |||||||||||||||||||||
| IsPrivate? | No (this computation is public) | ||||||||||||||||||||
| User-defined keywords | |||||||||||||||||||||
| Estimated Impact | 154 | ||||||||||||||||||||
Tree of Dependent Computations | |||||||||||||||||||||
| Family? (F = Feedback message, R = changed R code, M = changed R Module, P = changed Parameters, D = changed Data) | |||||||||||||||||||||
| - [Back to Back Histogram] [Investigating Ass...] [2007-10-22 21:58:05] [b9964c45117f7aac638ab9056d451faa] - PD [Back to Back Histogram] [btb Beaujolais Vi...] [2008-10-20 20:50:17] [3efbb18563b4564408d69b3c9a8e9a6e] [Current] | |||||||||||||||||||||
| Feedback Forum | |||||||||||||||||||||
Post a new message | |||||||||||||||||||||
Dataset | |||||||||||||||||||||
| Dataseries X: | |||||||||||||||||||||
6.76 6.79 6.79 6.74 6.76 6.76 6.76 6.76 6.73 6.72 6.68 6.62 6.6 6.56 6.53 6.58 6.59 6.58 6.54 6.51 6.36 6.18 6.1 6.01 5.92 5.93 5.9 5.91 5.88 5.91 5.95 6 6.01 6.03 6.03 6.08 6.02 6.01 5.95 5.99 6 5.99 5.93 5.93 5.92 5.97 5.98 5.96 5.97 5.96 5.92 5.97 5.96 5.96 5.94 5.97 5.99 5.98 5.99 5.99 | |||||||||||||||||||||
| Dataseries Y: | |||||||||||||||||||||
5.04 5.12 5.15 5.16 5.16 5.18 5.19 5.16 5.15 5.16 5.12 5.03 4.97 4.99 4.98 4.97 4.99 4.94 4.9 4.89 4.82 4.7 4.73 4.7 4.68 4.72 4.74 4.75 4.71 4.67 4.64 4.62 4.63 4.63 4.63 4.63 4.6 4.62 4.62 4.58 4.51 4.48 4.45 4.43 4.43 4.44 4.44 4.44 4.41 4.45 4.46 4.45 4.49 4.51 4.51 4.49 4.47 4.46 4.46 4.47 | |||||||||||||||||||||
Tables (Output of Computation) | |||||||||||||||||||||
| |||||||||||||||||||||
Figures (Output of Computation) | |||||||||||||||||||||
Input Parameters & R Code | |||||||||||||||||||||
| Parameters (Session): | |||||||||||||||||||||
| par1 = grey ; par2 = grey ; par3 = TRUE ; par4 = beaujolais ; par5 = vermout ; | |||||||||||||||||||||
| Parameters (R input): | |||||||||||||||||||||
| par1 = grey ; par2 = grey ; par3 = TRUE ; par4 = beaujolais ; par5 = vermout ; | |||||||||||||||||||||
| R code (references can be found in the software module): | |||||||||||||||||||||
if (par3 == 'TRUE') par3 <- TRUE | |||||||||||||||||||||