Free Statistics

of Irreproducible Research!

Author's title

Author*The author of this computation has been verified*
R Software Modulerwasp_correlation.wasp
Title produced by softwarePearson Correlation
Date of computationMon, 20 Oct 2008 07:23:02 -0600
Cite this page as followsStatistical Computations at FreeStatistics.org, Office for Research Development and Education, URL https://freestatistics.org/blog/index.php?v=date/2008/Oct/20/t122450903608fhdlrkkvfok1p.htm/, Retrieved Fri, 17 May 2024 08:36:31 +0000
Statistical Computations at FreeStatistics.org, Office for Research Development and Education, URL https://freestatistics.org/blog/index.php?pk=17239, Retrieved Fri, 17 May 2024 08:36:31 +0000
QR Codes:

Original text written by user:
IsPrivate?No (this computation is public)
User-defined keywords
Estimated Impact158
Family? (F = Feedback message, R = changed R code, M = changed R Module, P = changed Parameters, D = changed Data)
F     [Pearson Correlation] [Q5 Relationship b...] [2007-10-20 14:40:02] [b731da8b544846036771bbf9bf2f34ce]
F R  D    [Pearson Correlation] [Correlatie produc...] [2008-10-20 13:23:02] [f1a30f1149cef3ef3ef69d586c6c3c1c] [Current]
Feedback Forum
2008-10-26 11:51:07 [Kenny Simons] [reply
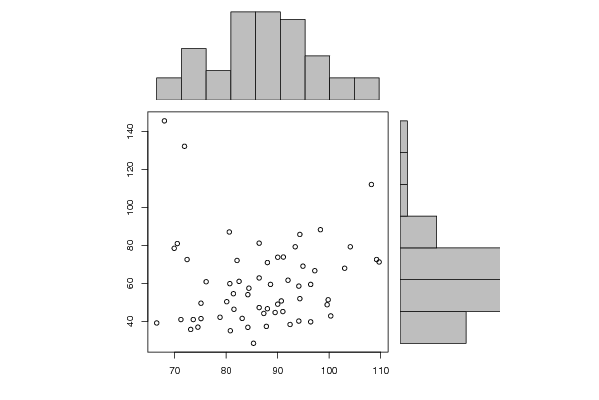
We hebben hier een correlatie van 0.04, wat wil zeggen dat er geen relatie is. Als we naar het scatter plot gaan kijken, merken we op dat 2 outliers ons plot beïnvloeden. Als we deze outliers zouden weglaten, had er wellicht wel een positieve relatie geweest.
2008-10-27 00:16:02 [Kristof Augustyns] [reply
4% is in ieder geval bijna niets en dus heeft de student gelijk door te zeggen dat er eigelijk geen correlatie van doen is.
Er is maar voor 4% samenhang tussen de productie van kledij en de investeringen.
Er zal dus niet veel gebeuren met die productie van kledij als er iets bij de investeringen zou wijzigen.
Spijtig dat de student niets heeft gezegd over die twee pestkoppen links vanboven op de grafiek.
Dit zijn wellicht outliers en het is door die twee puntjes dat de correlatie zo laag licht want anders kon men een mooie stijgende rechte trekken en nu kan dit niet.
2008-10-27 19:01:01 [Yara Van Overstraeten] [reply
De correlatie tussen de productie van kledij en investeringen is slechts 4% dus inderdaad zo goed als onbestaande. Er zijn inderdaad 2 outliers die een zeer sterke invloed uitoefenen op de plot-grafiek.

Post a new message
Dataseries X:
109.20
88.60
94.30
98.30
86.40
80.60
104.10
108.20
93.40
71.90
94.10
94.90
96.40
91.10
84.40
86.40
88.00
75.10
109.70
103.00
82.10
68.00
96.40
94.30
90.00
88.00
76.10
82.50
81.40
66.50
97.20
94.10
80.70
70.50
87.80
89.50
99.60
84.20
75.10
92.00
80.80
73.10
99.80
90.00
83.10
72.40
78.80
87.30
91.00
80.10
73.60
86.40
74.50
71.20
92.40
81.50
85.30
69.90
84.20
90.70
100.30
Dataseries Y:
72,50
59,40
85,70
88,20
62,80
87,00
79,20
112,00
79,20
132,10
40,10
69,00
59,40
73,80
57,40
81,10
46,60
41,40
71,20
67,90
72,00
145,50
39,70
51,90
73,70
70,90
60,80
61,00
54,50
39,10
66,60
58,50
59,80
80,90
37,30
44,60
48,70
54,00
49,50
61,60
35,00
35,70
51,30
49,00
41,50
72,50
42,10
44,10
45,10
50,30
40,90
47,20
36,90
40,90
38,30
46,30
28,40
78,40
36,80
50,70
42,80


Summary of computational transaction
Raw Inputview raw input (R code)
Raw Outputview raw output of R engine
Computing time1 seconds
R Server'George Udny Yule' @ 72.249.76.132

\begin{tabular}{lllllllll}
\hline
Summary of computational transaction \tabularnewline
Raw Input & view raw input (R code)  \tabularnewline
Raw Output & view raw output of R engine  \tabularnewline
Computing time & 1 seconds \tabularnewline
R Server & 'George Udny Yule' @ 72.249.76.132 \tabularnewline
\hline
\end{tabular}
%Source: https://freestatistics.org/blog/index.php?pk=17239&T=0

[TABLE]
[ROW][C]Summary of computational transaction[/C][/ROW]
[ROW][C]Raw Input[/C][C]view raw input (R code) [/C][/ROW]
[ROW][C]Raw Output[/C][C]view raw output of R engine [/C][/ROW]
[ROW][C]Computing time[/C][C]1 seconds[/C][/ROW]
[ROW][C]R Server[/C][C]'George Udny Yule' @ 72.249.76.132[/C][/ROW]
[/TABLE]
Source: https://freestatistics.org/blog/index.php?pk=17239&T=0

Globally Unique Identifier (entire table): ba.freestatistics.org/blog/index.php?pk=17239&T=0

As an alternative you can also use a QR Code:  

The GUIDs for individual cells are displayed in the table below:

Summary of computational transaction
Raw Inputview raw input (R code)
Raw Outputview raw output of R engine
Computing time1 seconds
R Server'George Udny Yule' @ 72.249.76.132


Pearson Product Moment Correlation - Ungrouped Data
StatisticVariable XVariable Y
Mean86.893442622950859.8491803278689
Biased Variance109.891760279495494.798892770761
Biased Standard Deviation10.482927085480222.2440754532698
Covariance10.0804945355191
Correlation0.0425212799870432
Determination0.00180805925173652
T-Test0.326907817024733
p-value (2 sided)0.744894582950823
p-value (1 sided)0.372447291475412
Degrees of Freedom59
Number of Observations61

\begin{tabular}{lllllllll}
\hline
Pearson Product Moment Correlation - Ungrouped Data \tabularnewline
Statistic & Variable X & Variable Y \tabularnewline
Mean & 86.8934426229508 & 59.8491803278689 \tabularnewline
Biased Variance & 109.891760279495 & 494.798892770761 \tabularnewline
Biased Standard Deviation & 10.4829270854802 & 22.2440754532698 \tabularnewline
Covariance & 10.0804945355191 \tabularnewline
Correlation & 0.0425212799870432 \tabularnewline
Determination & 0.00180805925173652 \tabularnewline
T-Test & 0.326907817024733 \tabularnewline
p-value (2 sided) & 0.744894582950823 \tabularnewline
p-value (1 sided) & 0.372447291475412 \tabularnewline
Degrees of Freedom & 59 \tabularnewline
Number of Observations & 61 \tabularnewline
\hline
\end{tabular}
%Source: https://freestatistics.org/blog/index.php?pk=17239&T=1

[TABLE]
[ROW][C]Pearson Product Moment Correlation - Ungrouped Data[/C][/ROW]
[ROW][C]Statistic[/C][C]Variable X[/C][C]Variable Y[/C][/ROW]
[ROW][C]Mean[/C][C]86.8934426229508[/C][C]59.8491803278689[/C][/ROW]
[ROW][C]Biased Variance[/C][C]109.891760279495[/C][C]494.798892770761[/C][/ROW]
[ROW][C]Biased Standard Deviation[/C][C]10.4829270854802[/C][C]22.2440754532698[/C][/ROW]
[ROW][C]Covariance[/C][C]10.0804945355191[/C][/ROW]
[ROW][C]Correlation[/C][C]0.0425212799870432[/C][/ROW]
[ROW][C]Determination[/C][C]0.00180805925173652[/C][/ROW]
[ROW][C]T-Test[/C][C]0.326907817024733[/C][/ROW]
[ROW][C]p-value (2 sided)[/C][C]0.744894582950823[/C][/ROW]
[ROW][C]p-value (1 sided)[/C][C]0.372447291475412[/C][/ROW]
[ROW][C]Degrees of Freedom[/C][C]59[/C][/ROW]
[ROW][C]Number of Observations[/C][C]61[/C][/ROW]
[/TABLE]
Source: https://freestatistics.org/blog/index.php?pk=17239&T=1

Globally Unique Identifier (entire table): ba.freestatistics.org/blog/index.php?pk=17239&T=1

As an alternative you can also use a QR Code:  

The GUIDs for individual cells are displayed in the table below:

Pearson Product Moment Correlation - Ungrouped Data
StatisticVariable XVariable Y
Mean86.893442622950859.8491803278689
Biased Variance109.891760279495494.798892770761
Biased Standard Deviation10.482927085480222.2440754532698
Covariance10.0804945355191
Correlation0.0425212799870432
Determination0.00180805925173652
T-Test0.326907817024733
p-value (2 sided)0.744894582950823
p-value (1 sided)0.372447291475412
Degrees of Freedom59
Number of Observations61


Parameters (Session):
Parameters (R input):
par1 = ; par2 = ; par3 = ; par4 = ; par5 = ; par6 = ; par7 = ; par8 = ; par9 = ; par10 = ; par11 = ; par12 = ; par13 = ; par14 = ; par15 = ; par16 = ; par17 = ; par18 = ; par19 = ; par20 = ;
R code (references can be found in the software module):
bitmap(file='test1.png')
histx <- hist(x, plot=FALSE)
histy <- hist(y, plot=FALSE)
maxcounts <- max(c(histx$counts, histx$counts))
xrange <- c(min(x),max(x))
yrange <- c(min(y),max(y))
nf <- layout(matrix(c(2,0,1,3),2,2,byrow=TRUE), c(3,1), c(1,3), TRUE)
par(mar=c(4,4,1,1))
plot(x, y, xlim=xrange, ylim=yrange, xlab=xlab, ylab=ylab)
par(mar=c(0,4,1,1))
barplot(histx$counts, axes=FALSE, ylim=c(0, maxcounts), space=0)
par(mar=c(4,0,1,1))
barplot(histy$counts, axes=FALSE, xlim=c(0, maxcounts), space=0, horiz=TRUE)
dev.off()
lx = length(x)
makebiased = (lx-1)/lx
varx = var(x)*makebiased
vary = var(y)*makebiased
corxy <- cor.test(x,y,method='pearson')
cxy <- as.matrix(corxy$estimate)[1,1]
load(file='createtable')
a<-table.start()
a<-table.row.start(a)
a<-table.element(a,'Pearson Product Moment Correlation - Ungrouped Data',3,TRUE)
a<-table.row.end(a)
a<-table.row.start(a)
a<-table.element(a,'Statistic',1,TRUE)
a<-table.element(a,'Variable X',1,TRUE)
a<-table.element(a,'Variable Y',1,TRUE)
a<-table.row.end(a)
a<-table.row.start(a)
a<-table.element(a,hyperlink('arithmetic_mean.htm','Mean',''),header=TRUE)
a<-table.element(a,mean(x))
a<-table.element(a,mean(y))
a<-table.row.end(a)
a<-table.row.start(a)
a<-table.element(a,hyperlink('biased.htm','Biased Variance',''),header=TRUE)
a<-table.element(a,varx)
a<-table.element(a,vary)
a<-table.row.end(a)
a<-table.row.start(a)
a<-table.element(a,hyperlink('biased1.htm','Biased Standard Deviation',''),header=TRUE)
a<-table.element(a,sqrt(varx))
a<-table.element(a,sqrt(vary))
a<-table.row.end(a)
a<-table.row.start(a)
a<-table.element(a,hyperlink('covariance.htm','Covariance',''),header=TRUE)
a<-table.element(a,cov(x,y),2)
a<-table.row.end(a)
a<-table.row.start(a)
a<-table.element(a,hyperlink('pearson_correlation.htm','Correlation',''),header=TRUE)
a<-table.element(a,cxy,2)
a<-table.row.end(a)
a<-table.row.start(a)
a<-table.element(a,hyperlink('coeff_of_determination.htm','Determination',''),header=TRUE)
a<-table.element(a,cxy*cxy,2)
a<-table.row.end(a)
a<-table.row.start(a)
a<-table.element(a,hyperlink('ttest_statistic.htm','T-Test',''),header=TRUE)
a<-table.element(a,as.matrix(corxy$statistic)[1,1],2)
a<-table.row.end(a)
a<-table.row.start(a)
a<-table.element(a,'p-value (2 sided)',header=TRUE)
a<-table.element(a,(p2 <- as.matrix(corxy$p.value)[1,1]),2)
a<-table.row.end(a)
a<-table.row.start(a)
a<-table.element(a,'p-value (1 sided)',header=TRUE)
a<-table.element(a,p2/2,2)
a<-table.row.end(a)
a<-table.row.start(a)
a<-table.element(a,'Degrees of Freedom',header=TRUE)
a<-table.element(a,lx-2,2)
a<-table.row.end(a)
a<-table.row.start(a)
a<-table.element(a,'Number of Observations',header=TRUE)
a<-table.element(a,lx,2)
a<-table.row.end(a)
a<-table.end(a)
table.save(a,file='mytable.tab')