Free Statistics

of Irreproducible Research!

Author's title

Author*Unverified author*
R Software Modulerwasp_correlation.wasp
Title produced by softwarePearson Correlation
Date of computationMon, 20 Oct 2008 06:14:33 -0600
Cite this page as followsStatistical Computations at FreeStatistics.org, Office for Research Development and Education, URL https://freestatistics.org/blog/index.php?v=date/2008/Oct/20/t12245049280105x0dyxnk89so.htm/, Retrieved Fri, 17 May 2024 08:33:07 +0000
Statistical Computations at FreeStatistics.org, Office for Research Development and Education, URL https://freestatistics.org/blog/index.php?pk=17217, Retrieved Fri, 17 May 2024 08:33:07 +0000
QR Codes:

Original text written by user:
IsPrivate?No (this computation is public)
User-defined keywords
Estimated Impact181
Family? (F = Feedback message, R = changed R code, M = changed R Module, P = changed Parameters, D = changed Data)
F     [Pearson Correlation] [Q5 Relationship b...] [2007-10-20 14:40:02] [b731da8b544846036771bbf9bf2f34ce]
F    D    [Pearson Correlation] [q5 clothing prod ...] [2008-10-20 12:14:33] [98d4dcce3945c5e24d79adca98955049] [Current]
Feedback Forum
2008-10-22 12:09:37 [Bas van Keken] [reply
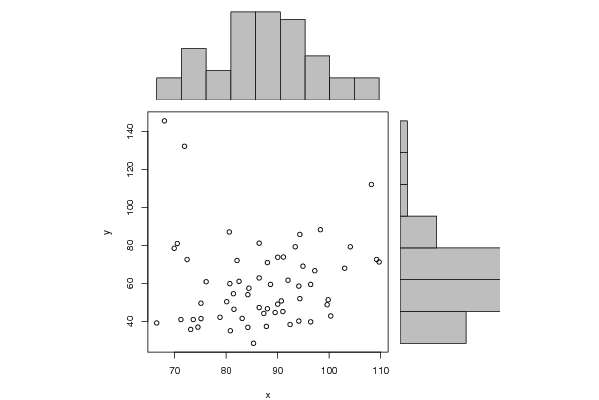
Hier kunt u de optische conclusie aan verbinden door het verloop van de grafieken ten opzichte van elkaar te beschrijven. Het noteren van de titel van de assen kan hier aan bijdragen. De notering van de berekeningen (correlatie) zijn overigens aanzienlijk krachtiger bij het onderbouwen van de conclusie.
2008-10-26 10:13:28 [Wim Golsteyn] [reply
Bij deze grafiek valt nog op te merken dat, wanneer we de outliers zouden elimineren, we waarschijnlijk wel van correlatie zouden kunnen spreken, en er dus misschien toch wel een verband zou kunnen bestaan.
2008-10-26 10:58:20 [Ruben Jacobs] [reply
Je neemt inderdaad de juiste conclusie. De grafiek met de hoogste correlatie is deze waar je een rechte rond de bolletjes kan doortrekken zoals in Q3. Hier zou je dan kunnen opmerken dat dit bij Q5 ook mogelijk is. Alleen wordt deze grafiek/correlatie verstoort door 2 outliers, zoals Wim zegt.
2008-10-27 09:33:49 [Dorien Peeters] [reply
Aan de hand van de scatterplot hebben we onderzocht of er een relatie is tussen de productie
van kleding en de investeringen. Op de grafiek zien we dat de punten tussen twee evenwijdige rechten
liggen. De punten boven de denkbeeldige lijn gesitueerd bij y-waarde = 88 zijn de zogenaamde
outliers of extreme waarden. Met deze waarden houden we best geen rekening om een
besluit te nemen.
Er is weinig tot geen corellatie, zelfs al laten we de meeste extreme waarden buiten beschouwing. Het is dus correct wat deze student zegt, namelijk dat de grafiek/correlatie wordt verstoord door 2 outliers.

Post a new message
Dataseries X:
109.20
88.60
94.30
98.30
86.40
80.60
104.10
108.20
93.40
71.90
94.10
94.90
96.40
91.10
84.40
86.40
88.00
75.10
109.70
103.00
82.10
68.00
96.40
94.30
90.00
88.00
76.10
82.50
81.40
66.50
97.20
94.10
80.70
70.50
87.80
89.50
99.60
84.20
75.10
92.00
80.80
73.10
99.80
90.00
83.10
72.40
78.80
87.30
91.00
80.10
73.60
86.40
74.50
71.20
92.40
81.50
85.30
69.90
84.20
90.70
100.30
Dataseries Y:
72.50
59.40
85.70
88.20
62.80
87.00
79.20
112.00
79.20
132.10
40.10
69.00
59.40
73.80
57.40
81.10
46.60
41.40
71.20
67.90
72.00
145.50
39.70
51.90
73.70
70.90
60.80
61.00
54.50
39.10
66.60
58.50
59.80
80.90
37.30
44.60
48.70
54.00
49.50
61.60
35.00
35.70
51.30
49.00
41.50
72.50
42.10
44.10
45.10
50.30
40.90
47.20
36.90
40.90
38.30
46.30
28.40
78.40
36.80
50.70
42.80


Summary of computational transaction
Raw Inputview raw input (R code)
Raw Outputview raw output of R engine
Computing time1 seconds
R Server'Gwilym Jenkins' @ 72.249.127.135

\begin{tabular}{lllllllll}
\hline
Summary of computational transaction \tabularnewline
Raw Input & view raw input (R code)  \tabularnewline
Raw Output & view raw output of R engine  \tabularnewline
Computing time & 1 seconds \tabularnewline
R Server & 'Gwilym Jenkins' @ 72.249.127.135 \tabularnewline
\hline
\end{tabular}
%Source: https://freestatistics.org/blog/index.php?pk=17217&T=0

[TABLE]
[ROW][C]Summary of computational transaction[/C][/ROW]
[ROW][C]Raw Input[/C][C]view raw input (R code) [/C][/ROW]
[ROW][C]Raw Output[/C][C]view raw output of R engine [/C][/ROW]
[ROW][C]Computing time[/C][C]1 seconds[/C][/ROW]
[ROW][C]R Server[/C][C]'Gwilym Jenkins' @ 72.249.127.135[/C][/ROW]
[/TABLE]
Source: https://freestatistics.org/blog/index.php?pk=17217&T=0

Globally Unique Identifier (entire table): ba.freestatistics.org/blog/index.php?pk=17217&T=0

As an alternative you can also use a QR Code:  

The GUIDs for individual cells are displayed in the table below:

Summary of computational transaction
Raw Inputview raw input (R code)
Raw Outputview raw output of R engine
Computing time1 seconds
R Server'Gwilym Jenkins' @ 72.249.127.135


Pearson Product Moment Correlation - Ungrouped Data
StatisticVariable XVariable Y
Mean86.893442622950859.8491803278689
Biased Variance109.891760279495494.798892770761
Biased Standard Deviation10.482927085480222.2440754532698
Covariance10.0804945355191
Correlation0.0425212799870432
Determination0.00180805925173652
T-Test0.326907817024733
p-value (2 sided)0.744894582950823
p-value (1 sided)0.372447291475412
Degrees of Freedom59
Number of Observations61

\begin{tabular}{lllllllll}
\hline
Pearson Product Moment Correlation - Ungrouped Data \tabularnewline
Statistic & Variable X & Variable Y \tabularnewline
Mean & 86.8934426229508 & 59.8491803278689 \tabularnewline
Biased Variance & 109.891760279495 & 494.798892770761 \tabularnewline
Biased Standard Deviation & 10.4829270854802 & 22.2440754532698 \tabularnewline
Covariance & 10.0804945355191 \tabularnewline
Correlation & 0.0425212799870432 \tabularnewline
Determination & 0.00180805925173652 \tabularnewline
T-Test & 0.326907817024733 \tabularnewline
p-value (2 sided) & 0.744894582950823 \tabularnewline
p-value (1 sided) & 0.372447291475412 \tabularnewline
Degrees of Freedom & 59 \tabularnewline
Number of Observations & 61 \tabularnewline
\hline
\end{tabular}
%Source: https://freestatistics.org/blog/index.php?pk=17217&T=1

[TABLE]
[ROW][C]Pearson Product Moment Correlation - Ungrouped Data[/C][/ROW]
[ROW][C]Statistic[/C][C]Variable X[/C][C]Variable Y[/C][/ROW]
[ROW][C]Mean[/C][C]86.8934426229508[/C][C]59.8491803278689[/C][/ROW]
[ROW][C]Biased Variance[/C][C]109.891760279495[/C][C]494.798892770761[/C][/ROW]
[ROW][C]Biased Standard Deviation[/C][C]10.4829270854802[/C][C]22.2440754532698[/C][/ROW]
[ROW][C]Covariance[/C][C]10.0804945355191[/C][/ROW]
[ROW][C]Correlation[/C][C]0.0425212799870432[/C][/ROW]
[ROW][C]Determination[/C][C]0.00180805925173652[/C][/ROW]
[ROW][C]T-Test[/C][C]0.326907817024733[/C][/ROW]
[ROW][C]p-value (2 sided)[/C][C]0.744894582950823[/C][/ROW]
[ROW][C]p-value (1 sided)[/C][C]0.372447291475412[/C][/ROW]
[ROW][C]Degrees of Freedom[/C][C]59[/C][/ROW]
[ROW][C]Number of Observations[/C][C]61[/C][/ROW]
[/TABLE]
Source: https://freestatistics.org/blog/index.php?pk=17217&T=1

Globally Unique Identifier (entire table): ba.freestatistics.org/blog/index.php?pk=17217&T=1

As an alternative you can also use a QR Code:  

The GUIDs for individual cells are displayed in the table below:

Pearson Product Moment Correlation - Ungrouped Data
StatisticVariable XVariable Y
Mean86.893442622950859.8491803278689
Biased Variance109.891760279495494.798892770761
Biased Standard Deviation10.482927085480222.2440754532698
Covariance10.0804945355191
Correlation0.0425212799870432
Determination0.00180805925173652
T-Test0.326907817024733
p-value (2 sided)0.744894582950823
p-value (1 sided)0.372447291475412
Degrees of Freedom59
Number of Observations61


Parameters (Session):
Parameters (R input):
R code (references can be found in the software module):
bitmap(file='test1.png')
histx <- hist(x, plot=FALSE)
histy <- hist(y, plot=FALSE)
maxcounts <- max(c(histx$counts, histx$counts))
xrange <- c(min(x),max(x))
yrange <- c(min(y),max(y))
nf <- layout(matrix(c(2,0,1,3),2,2,byrow=TRUE), c(3,1), c(1,3), TRUE)
par(mar=c(4,4,1,1))
plot(x, y, xlim=xrange, ylim=yrange, xlab=xlab, ylab=ylab)
par(mar=c(0,4,1,1))
barplot(histx$counts, axes=FALSE, ylim=c(0, maxcounts), space=0)
par(mar=c(4,0,1,1))
barplot(histy$counts, axes=FALSE, xlim=c(0, maxcounts), space=0, horiz=TRUE)
dev.off()
lx = length(x)
makebiased = (lx-1)/lx
varx = var(x)*makebiased
vary = var(y)*makebiased
corxy <- cor.test(x,y,method='pearson')
cxy <- as.matrix(corxy$estimate)[1,1]
load(file='createtable')
a<-table.start()
a<-table.row.start(a)
a<-table.element(a,'Pearson Product Moment Correlation - Ungrouped Data',3,TRUE)
a<-table.row.end(a)
a<-table.row.start(a)
a<-table.element(a,'Statistic',1,TRUE)
a<-table.element(a,'Variable X',1,TRUE)
a<-table.element(a,'Variable Y',1,TRUE)
a<-table.row.end(a)
a<-table.row.start(a)
a<-table.element(a,hyperlink('arithmetic_mean.htm','Mean',''),header=TRUE)
a<-table.element(a,mean(x))
a<-table.element(a,mean(y))
a<-table.row.end(a)
a<-table.row.start(a)
a<-table.element(a,hyperlink('biased.htm','Biased Variance',''),header=TRUE)
a<-table.element(a,varx)
a<-table.element(a,vary)
a<-table.row.end(a)
a<-table.row.start(a)
a<-table.element(a,hyperlink('biased1.htm','Biased Standard Deviation',''),header=TRUE)
a<-table.element(a,sqrt(varx))
a<-table.element(a,sqrt(vary))
a<-table.row.end(a)
a<-table.row.start(a)
a<-table.element(a,hyperlink('covariance.htm','Covariance',''),header=TRUE)
a<-table.element(a,cov(x,y),2)
a<-table.row.end(a)
a<-table.row.start(a)
a<-table.element(a,hyperlink('pearson_correlation.htm','Correlation',''),header=TRUE)
a<-table.element(a,cxy,2)
a<-table.row.end(a)
a<-table.row.start(a)
a<-table.element(a,hyperlink('coeff_of_determination.htm','Determination',''),header=TRUE)
a<-table.element(a,cxy*cxy,2)
a<-table.row.end(a)
a<-table.row.start(a)
a<-table.element(a,hyperlink('ttest_statistic.htm','T-Test',''),header=TRUE)
a<-table.element(a,as.matrix(corxy$statistic)[1,1],2)
a<-table.row.end(a)
a<-table.row.start(a)
a<-table.element(a,'p-value (2 sided)',header=TRUE)
a<-table.element(a,(p2 <- as.matrix(corxy$p.value)[1,1]),2)
a<-table.row.end(a)
a<-table.row.start(a)
a<-table.element(a,'p-value (1 sided)',header=TRUE)
a<-table.element(a,p2/2,2)
a<-table.row.end(a)
a<-table.row.start(a)
a<-table.element(a,'Degrees of Freedom',header=TRUE)
a<-table.element(a,lx-2,2)
a<-table.row.end(a)
a<-table.row.start(a)
a<-table.element(a,'Number of Observations',header=TRUE)
a<-table.element(a,lx,2)
a<-table.row.end(a)
a<-table.end(a)
table.save(a,file='mytable.tab')