Free Statistics
of Irreproducible Research!
Description of Statistical Computation | |||||||||||||||||||||
|---|---|---|---|---|---|---|---|---|---|---|---|---|---|---|---|---|---|---|---|---|---|
| Author's title | |||||||||||||||||||||
| Author | *The author of this computation has been verified* | ||||||||||||||||||||
| R Software Module | rwasp_backtobackhist.wasp | ||||||||||||||||||||
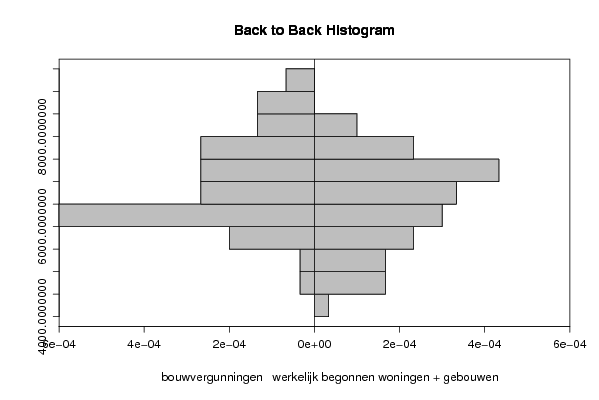
| Title produced by software | Back to Back Histogram | ||||||||||||||||||||
| Date of computation | Sun, 19 Oct 2008 12:39:04 -0600 | ||||||||||||||||||||
| Cite this page as follows | Statistical Computations at FreeStatistics.org, Office for Research Development and Education, URL https://freestatistics.org/blog/index.php?v=date/2008/Oct/19/t1224441719s119pw02e3tzcp8.htm/, Retrieved Sun, 19 May 2024 06:45:40 +0000 | ||||||||||||||||||||
| Statistical Computations at FreeStatistics.org, Office for Research Development and Education, URL https://freestatistics.org/blog/index.php?pk=17042, Retrieved Sun, 19 May 2024 06:45:40 +0000 | |||||||||||||||||||||
| QR Codes: | |||||||||||||||||||||
|
| |||||||||||||||||||||
| Original text written by user: | de bouwvergunningen werden genomen op zowel de woningen als de gebouwen. vandaar dat het ook logisch is om even een vergelijk te maken tussen het totaal van de bouwvergunningen en het totaal van de werkelijk begonnen woningen en gebouwen! | ||||||||||||||||||||
| IsPrivate? | No (this computation is public) | ||||||||||||||||||||
| User-defined keywords | |||||||||||||||||||||
| Estimated Impact | 156 | ||||||||||||||||||||
Tree of Dependent Computations | |||||||||||||||||||||
| Family? (F = Feedback message, R = changed R code, M = changed R Module, P = changed Parameters, D = changed Data) | |||||||||||||||||||||
| - [Back to Back Histogram] [Investigating Ass...] [2007-10-22 21:58:05] [b9964c45117f7aac638ab9056d451faa] - R PD [Back to Back Histogram] [b2b histogram ree...] [2008-10-19 18:39:04] [95d95b0e883740fcbc85e18ec42dcafb] [Current] - RMPD [Kendall tau Correlation Matrix] [kendall tau corre...] [2008-12-10 13:43:13] [7173087adebe3e3a714c80ea2417b3eb] - RMPD [Cross Correlation Function] [cross correlation] [2008-12-22 11:03:52] [7173087adebe3e3a714c80ea2417b3eb] | |||||||||||||||||||||
| Feedback Forum | |||||||||||||||||||||
Post a new message | |||||||||||||||||||||
Dataset | |||||||||||||||||||||
| Dataseries X: | |||||||||||||||||||||
5014 6153 6441 5584 6427 6062 5589 6216 5809 4989 6706 7174 6122 8075 6292 6337 8576 6077 5931 6288 7167 6054 6468 6401 6927 7914 7728 8699 8522 6481 7502 7778 7424 6941 8574 9169 7701 9035 7158 8195 8124 7073 7017 7390 7776 6197 6889 7087 6485 7654 6501 6313 7826 6589 6729 5684 8105 6391 5901 6758 | |||||||||||||||||||||
| Dataseries Y: | |||||||||||||||||||||
4892 6792 6290 5557 6105 4134 5590 7895 5947 5270 4864 5184 6093 7245 7041 6468 7210 4975 6699 6598 6426 6071 4913 5525 6403 6785 7481 7616 7825 5549 7257 8149 7837 7328 5973 6623 7007 8296 7358 8028 7609 5133 7308 7495 7597 7154 5543 6089 6572 6935 7269 7686 6994 5112 6576 6987 7035 6271 5082 4803 | |||||||||||||||||||||
Tables (Output of Computation) | |||||||||||||||||||||
| |||||||||||||||||||||
Figures (Output of Computation) | |||||||||||||||||||||
Input Parameters & R Code | |||||||||||||||||||||
| Parameters (Session): | |||||||||||||||||||||
| par1 = grey ; par2 = grey ; par3 = TRUE ; par4 = bouwvergunningen ; par5 = werkelijk begonnen woningen ; | |||||||||||||||||||||
| Parameters (R input): | |||||||||||||||||||||
| par1 = grey ; par2 = grey ; par3 = TRUE ; par4 = bouwvergunningen ; par5 = werkelijk begonnen woningen + gebouwen ; | |||||||||||||||||||||
| R code (references can be found in the software module): | |||||||||||||||||||||
if (par3 == 'TRUE') par3 <- TRUE | |||||||||||||||||||||