Free Statistics
of Irreproducible Research!
Description of Statistical Computation | |||||||||||||||||||||
|---|---|---|---|---|---|---|---|---|---|---|---|---|---|---|---|---|---|---|---|---|---|
| Author's title | |||||||||||||||||||||
| Author | *The author of this computation has been verified* | ||||||||||||||||||||
| R Software Module | rwasp_backtobackhist.wasp | ||||||||||||||||||||
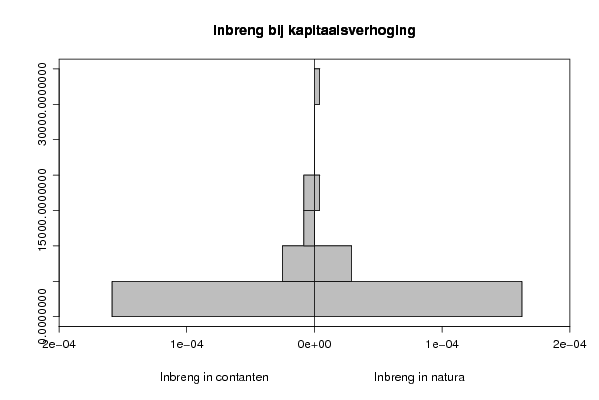
| Title produced by software | Back to Back Histogram | ||||||||||||||||||||
| Date of computation | Sun, 19 Oct 2008 08:13:53 -0600 | ||||||||||||||||||||
| Cite this page as follows | Statistical Computations at FreeStatistics.org, Office for Research Development and Education, URL https://freestatistics.org/blog/index.php?v=date/2008/Oct/19/t1224425809iomr3knw2gs9hd4.htm/, Retrieved Sun, 19 May 2024 00:05:08 +0000 | ||||||||||||||||||||
| Statistical Computations at FreeStatistics.org, Office for Research Development and Education, URL https://freestatistics.org/blog/index.php?pk=16865, Retrieved Sun, 19 May 2024 00:05:08 +0000 | |||||||||||||||||||||
| QR Codes: | |||||||||||||||||||||
|
| |||||||||||||||||||||
| Original text written by user: | |||||||||||||||||||||
| IsPrivate? | No (this computation is public) | ||||||||||||||||||||
| User-defined keywords | |||||||||||||||||||||
| Estimated Impact | 152 | ||||||||||||||||||||
Tree of Dependent Computations | |||||||||||||||||||||
| Family? (F = Feedback message, R = changed R code, M = changed R Module, P = changed Parameters, D = changed Data) | |||||||||||||||||||||
| - [Back to Back Histogram] [Investigating Ass...] [2007-10-22 22:01:16] [b9964c45117f7aac638ab9056d451faa] F PD [Back to Back Histogram] [Task 2 - Q8 - Inb...] [2008-10-19 14:13:53] [dafd615cb3e0decc017580d68ecea30a] [Current] | |||||||||||||||||||||
| Feedback Forum | |||||||||||||||||||||
Post a new message | |||||||||||||||||||||
Dataset | |||||||||||||||||||||
| Dataseries X: | |||||||||||||||||||||
17501 2127 6187 5006 6005 5127 3022 2291 6084 8323 2338 1432 4019 3167 1292 4622 1631 4783 3417 4858 3057 16061 1533 11544 4115 850 501 1148 224 185 1083 478 815 1932 643 472 14367 920 997 2834 466 912 894 491 371 1422 343 1047 | |||||||||||||||||||||
| Dataseries Y: | |||||||||||||||||||||
31560 19327 1628 2237 307 2152 3414 3466 761 1902 358 354 6676 2963 449 6225 458 9768 3497 760 565 422 290 1324 7092 1051 2614 346 130 1040 1629 374 176 1547 171 906 5798 2391 164 743 921 5911 535 72 6734 1024 1210 249 | |||||||||||||||||||||
Tables (Output of Computation) | |||||||||||||||||||||
| |||||||||||||||||||||
Figures (Output of Computation) | |||||||||||||||||||||
Input Parameters & R Code | |||||||||||||||||||||
| Parameters (Session): | |||||||||||||||||||||
| par1 = grey ; par2 = grey ; par3 = TRUE ; par4 = Inbreng in contanten ; par5 = Inbreng in natura ; | |||||||||||||||||||||
| Parameters (R input): | |||||||||||||||||||||
| par1 = grey ; par2 = grey ; par3 = TRUE ; par4 = Inbreng in contanten ; par5 = Inbreng in natura ; | |||||||||||||||||||||
| R code (references can be found in the software module): | |||||||||||||||||||||
if (par3 == 'TRUE') par3 <- TRUE | |||||||||||||||||||||