Free Statistics
of Irreproducible Research!
Description of Statistical Computation | |||||||||||||||||||||
|---|---|---|---|---|---|---|---|---|---|---|---|---|---|---|---|---|---|---|---|---|---|
| Author's title | |||||||||||||||||||||
| Author | *Unverified author* | ||||||||||||||||||||
| R Software Module | rwasp_backtobackhist.wasp | ||||||||||||||||||||
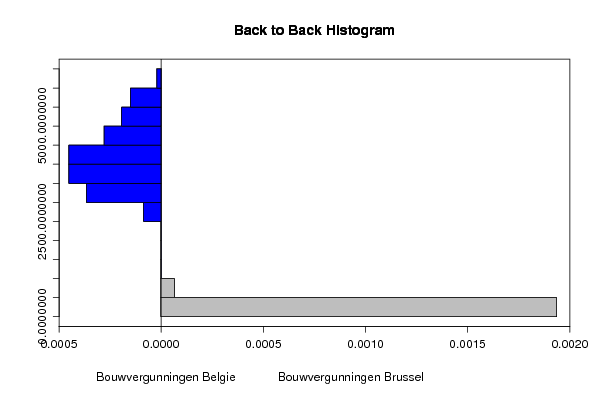
| Title produced by software | Back to Back Histogram | ||||||||||||||||||||
| Date of computation | Fri, 17 Oct 2008 08:31:17 -0600 | ||||||||||||||||||||
| Cite this page as follows | Statistical Computations at FreeStatistics.org, Office for Research Development and Education, URL https://freestatistics.org/blog/index.php?v=date/2008/Oct/17/t1224253915iixioydsrezdrx1.htm/, Retrieved Fri, 17 May 2024 10:31:10 +0000 | ||||||||||||||||||||
| Statistical Computations at FreeStatistics.org, Office for Research Development and Education, URL https://freestatistics.org/blog/index.php?pk=16478, Retrieved Fri, 17 May 2024 10:31:10 +0000 | |||||||||||||||||||||
| QR Codes: | |||||||||||||||||||||
|
| |||||||||||||||||||||
| Original text written by user: | |||||||||||||||||||||
| IsPrivate? | No (this computation is public) | ||||||||||||||||||||
| User-defined keywords | BTB Brussel | ||||||||||||||||||||
| Estimated Impact | 174 | ||||||||||||||||||||
Tree of Dependent Computations | |||||||||||||||||||||
| Family? (F = Feedback message, R = changed R code, M = changed R Module, P = changed Parameters, D = changed Data) | |||||||||||||||||||||
| F [Percentiles and Normal Probability Plot] [Q6 P(a - RMPD [Back to Back Histogram] [BTB histogram Bel...] [2008-10-17 14:31:17] [54e3d3004a715f41ac868f539d95466f] [Current] | |||||||||||||||||||||
| Feedback Forum | |||||||||||||||||||||
Post a new message | |||||||||||||||||||||
Dataset | |||||||||||||||||||||
| Dataseries X: | |||||||||||||||||||||
3353 3480 3098 2944 3389 3497 4404 3849 3734 3060 3507 3287 3215 3764 2734 2837 2766 3851 3289 3848 3348 3682 4058 3655 3811 3341 3032 3475 3353 3186 3902 4164 3499 4145 3796 3711 3949 3740 3243 4407 4814 3908 5250 3937 4004 5560 3922 3759 4138 4634 3996 4308 4142 4429 5219 4929 5754 5592 4163 4962 5208 4755 4491 5732 5730 5024 6056 4901 5353 5578 4618 4724 5011 5298 4143 4617 4727 4207 5112 4190 4098 5071 4177 4598 3757 5591 4218 3780 4336 4870 4422 4727 4459 | |||||||||||||||||||||
| Dataseries Y: | |||||||||||||||||||||
192 111 50 102 242 143 122 147 178 201 132 366 159 59 143 177 89 234 34 397 72 162 250 125 137 63 246 298 289 264 148 427 82 376 194 154 160 362 199 87 294 295 382 211 122 266 200 130 141 163 432 208 372 186 267 477 286 291 200 173 336 100 165 160 212 154 117 230 187 254 380 201 540 564 306 454 238 110 137 53 162 227 83 155 334 534 143 244 238 207 214 29 257 | |||||||||||||||||||||
Tables (Output of Computation) | |||||||||||||||||||||
| |||||||||||||||||||||
Figures (Output of Computation) | |||||||||||||||||||||
Input Parameters & R Code | |||||||||||||||||||||
| Parameters (Session): | |||||||||||||||||||||
| par1 = blue ; par2 = grey ; par3 = TRUE ; par4 = Bouwvergunningen Belgie ; par5 = Bouwvergunningen Brussel ; | |||||||||||||||||||||
| Parameters (R input): | |||||||||||||||||||||
| par1 = blue ; par2 = grey ; par3 = TRUE ; par4 = Bouwvergunningen Belgie ; par5 = Bouwvergunningen Brussel ; | |||||||||||||||||||||
| R code (references can be found in the software module): | |||||||||||||||||||||
if (par3 == 'TRUE') par3 <- TRUE | |||||||||||||||||||||