Free Statistics

of Irreproducible Research!

Author's title

Author*The author of this computation has been verified*
R Software Modulerwasp_correlation.wasp
Title produced by softwarePearson Correlation
Date of computationFri, 17 Oct 2008 07:58:31 -0600
Cite this page as followsStatistical Computations at FreeStatistics.org, Office for Research Development and Education, URL https://freestatistics.org/blog/index.php?v=date/2008/Oct/17/t12242520987k72f3hwau7fzvp.htm/, Retrieved Fri, 17 May 2024 11:07:17 +0000
Statistical Computations at FreeStatistics.org, Office for Research Development and Education, URL https://freestatistics.org/blog/index.php?pk=16467, Retrieved Fri, 17 May 2024 11:07:17 +0000
QR Codes:

Original text written by user:
IsPrivate?No (this computation is public)
User-defined keywords
Estimated Impact190
Family? (F = Feedback message, R = changed R code, M = changed R Module, P = changed Parameters, D = changed Data)
F     [Harrell-Davis Quantiles] [Q7 95% confidence...] [2007-10-20 15:02:46] [b731da8b544846036771bbf9bf2f34ce]
F RMPD  [Pearson Correlation] [Pearson Correlati...] [2008-10-17 13:43:56] [6fea0e9a9b3b29a63badf2c274e82506]
F    D      [Pearson Correlation] [Pearson Correlati...] [2008-10-17 13:58:31] [286e96bd53289970f8e5f25a93fb50b3] [Current]
Feedback Forum
2008-10-28 08:38:33 [Michael Van Spaandonck] [reply
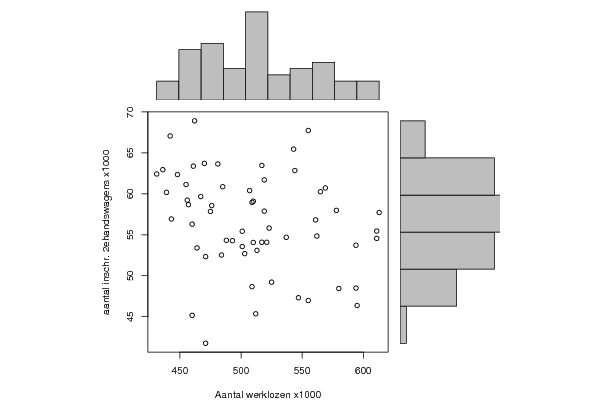
Een negatieve correlatie van 27% duidt op een zwak omgekeerd verband tussen de twee tijdreeksen.
Een stijging in de werkloosheid KAN een kleine afname in het aantal inschrijvingen van tweedehandswagens teweeg brengen.

Als we kijken naar de relaties tussen werkloosheid en het aantal inschrijvingen van nieuwe en tweedehandswagens, zien we dat er algemeen minder auto's ingeschreven worden in tijden van grotere werkloosheid.
Dit valt vanuit de economie logisch te verklaren omdat de mensen er gewoon geen geld voor hebben, of het niet aan een auto willen besteden tenzij het nodig is.

Post a new message
Dataseries X:
493.000
481.000
462.000
457.000
442.000
439.000
488.000
521.000
501.000
485.000
464.000
460.000
467.000
460.000
448.000
443.000
436.000
431.000
484.000
510.000
513.000
503.000
471.000
471.000
476.000
475.000
470.000
461.000
455.000
456.000
517.000
525.000
523.000
519.000
509.000
512.000
519.000
517.000
510.000
509.000
501.000
507.000
569.000
580.000
578.000
565.000
547.000
555.000
562.000
561.000
555.000
544.000
537.000
543.000
594.000
611.000
613.000
611.000
594.000
595.000
Dataseries Y:
54.281
63.654
68.918
58.686
67.074
60.183
54.326
54.085
53.564
60.873
53.398
45.164
59.672
56.298
62.361
56.930
62.954
62.431
52.528
54.060
53.093
52.695
52.333
41.747
58.576
57.851
63.721
63.384
61.141
59.231
63.472
49.214
55.816
61.713
48.664
45.351
57.888
54.091
59.098
58.962
55.433
60.403
60.721
48.440
57.981
60.258
47.312
46.980
54.846
56.824
67.744
62.849
54.691
65.461
53.724
54.560
57.722
55.458
48.490
46.362


Summary of computational transaction
Raw Inputview raw input (R code)
Raw Outputview raw output of R engine
Computing time2 seconds
R Server'Sir Ronald Aylmer Fisher' @ 193.190.124.24

\begin{tabular}{lllllllll}
\hline
Summary of computational transaction \tabularnewline
Raw Input & view raw input (R code)  \tabularnewline
Raw Output & view raw output of R engine  \tabularnewline
Computing time & 2 seconds \tabularnewline
R Server & 'Sir Ronald Aylmer Fisher' @ 193.190.124.24 \tabularnewline
\hline
\end{tabular}
%Source: https://freestatistics.org/blog/index.php?pk=16467&T=0

[TABLE]
[ROW][C]Summary of computational transaction[/C][/ROW]
[ROW][C]Raw Input[/C][C]view raw input (R code) [/C][/ROW]
[ROW][C]Raw Output[/C][C]view raw output of R engine [/C][/ROW]
[ROW][C]Computing time[/C][C]2 seconds[/C][/ROW]
[ROW][C]R Server[/C][C]'Sir Ronald Aylmer Fisher' @ 193.190.124.24[/C][/ROW]
[/TABLE]
Source: https://freestatistics.org/blog/index.php?pk=16467&T=0

Globally Unique Identifier (entire table): ba.freestatistics.org/blog/index.php?pk=16467&T=0

As an alternative you can also use a QR Code:  

The GUIDs for individual cells are displayed in the table below:

Summary of computational transaction
Raw Inputview raw input (R code)
Raw Outputview raw output of R engine
Computing time2 seconds
R Server'Sir Ronald Aylmer Fisher' @ 193.190.124.24


Pearson Product Moment Correlation - Ungrouped Data
StatisticVariable XVariable Y
Mean510.08333333333356.5956666666667
Biased Variance2419.3097222222235.2590933555555
Biased Standard Deviation49.18647905900795.93793679282253
Covariance-81.9399039548023
Correlation-0.275876626135844
Determination0.0761079128480964
T-Test-2.18583954702079
p-value (2 sided)0.0328777595480289
p-value (1 sided)0.0164388797740144
Degrees of Freedom58
Number of Observations60

\begin{tabular}{lllllllll}
\hline
Pearson Product Moment Correlation - Ungrouped Data \tabularnewline
Statistic & Variable X & Variable Y \tabularnewline
Mean & 510.083333333333 & 56.5956666666667 \tabularnewline
Biased Variance & 2419.30972222222 & 35.2590933555555 \tabularnewline
Biased Standard Deviation & 49.1864790590079 & 5.93793679282253 \tabularnewline
Covariance & -81.9399039548023 \tabularnewline
Correlation & -0.275876626135844 \tabularnewline
Determination & 0.0761079128480964 \tabularnewline
T-Test & -2.18583954702079 \tabularnewline
p-value (2 sided) & 0.0328777595480289 \tabularnewline
p-value (1 sided) & 0.0164388797740144 \tabularnewline
Degrees of Freedom & 58 \tabularnewline
Number of Observations & 60 \tabularnewline
\hline
\end{tabular}
%Source: https://freestatistics.org/blog/index.php?pk=16467&T=1

[TABLE]
[ROW][C]Pearson Product Moment Correlation - Ungrouped Data[/C][/ROW]
[ROW][C]Statistic[/C][C]Variable X[/C][C]Variable Y[/C][/ROW]
[ROW][C]Mean[/C][C]510.083333333333[/C][C]56.5956666666667[/C][/ROW]
[ROW][C]Biased Variance[/C][C]2419.30972222222[/C][C]35.2590933555555[/C][/ROW]
[ROW][C]Biased Standard Deviation[/C][C]49.1864790590079[/C][C]5.93793679282253[/C][/ROW]
[ROW][C]Covariance[/C][C]-81.9399039548023[/C][/ROW]
[ROW][C]Correlation[/C][C]-0.275876626135844[/C][/ROW]
[ROW][C]Determination[/C][C]0.0761079128480964[/C][/ROW]
[ROW][C]T-Test[/C][C]-2.18583954702079[/C][/ROW]
[ROW][C]p-value (2 sided)[/C][C]0.0328777595480289[/C][/ROW]
[ROW][C]p-value (1 sided)[/C][C]0.0164388797740144[/C][/ROW]
[ROW][C]Degrees of Freedom[/C][C]58[/C][/ROW]
[ROW][C]Number of Observations[/C][C]60[/C][/ROW]
[/TABLE]
Source: https://freestatistics.org/blog/index.php?pk=16467&T=1

Globally Unique Identifier (entire table): ba.freestatistics.org/blog/index.php?pk=16467&T=1

As an alternative you can also use a QR Code:  

The GUIDs for individual cells are displayed in the table below:

Pearson Product Moment Correlation - Ungrouped Data
StatisticVariable XVariable Y
Mean510.08333333333356.5956666666667
Biased Variance2419.3097222222235.2590933555555
Biased Standard Deviation49.18647905900795.93793679282253
Covariance-81.9399039548023
Correlation-0.275876626135844
Determination0.0761079128480964
T-Test-2.18583954702079
p-value (2 sided)0.0328777595480289
p-value (1 sided)0.0164388797740144
Degrees of Freedom58
Number of Observations60


Parameters (Session):
Parameters (R input):
R code (references can be found in the software module):
bitmap(file='test1.png')
histx <- hist(x, plot=FALSE)
histy <- hist(y, plot=FALSE)
maxcounts <- max(c(histx$counts, histx$counts))
xrange <- c(min(x),max(x))
yrange <- c(min(y),max(y))
nf <- layout(matrix(c(2,0,1,3),2,2,byrow=TRUE), c(3,1), c(1,3), TRUE)
par(mar=c(4,4,1,1))
plot(x, y, xlim=xrange, ylim=yrange, xlab=xlab, ylab=ylab)
par(mar=c(0,4,1,1))
barplot(histx$counts, axes=FALSE, ylim=c(0, maxcounts), space=0)
par(mar=c(4,0,1,1))
barplot(histy$counts, axes=FALSE, xlim=c(0, maxcounts), space=0, horiz=TRUE)
dev.off()
lx = length(x)
makebiased = (lx-1)/lx
varx = var(x)*makebiased
vary = var(y)*makebiased
corxy <- cor.test(x,y,method='pearson')
cxy <- as.matrix(corxy$estimate)[1,1]
load(file='createtable')
a<-table.start()
a<-table.row.start(a)
a<-table.element(a,'Pearson Product Moment Correlation - Ungrouped Data',3,TRUE)
a<-table.row.end(a)
a<-table.row.start(a)
a<-table.element(a,'Statistic',1,TRUE)
a<-table.element(a,'Variable X',1,TRUE)
a<-table.element(a,'Variable Y',1,TRUE)
a<-table.row.end(a)
a<-table.row.start(a)
a<-table.element(a,hyperlink('arithmetic_mean.htm','Mean',''),header=TRUE)
a<-table.element(a,mean(x))
a<-table.element(a,mean(y))
a<-table.row.end(a)
a<-table.row.start(a)
a<-table.element(a,hyperlink('biased.htm','Biased Variance',''),header=TRUE)
a<-table.element(a,varx)
a<-table.element(a,vary)
a<-table.row.end(a)
a<-table.row.start(a)
a<-table.element(a,hyperlink('biased1.htm','Biased Standard Deviation',''),header=TRUE)
a<-table.element(a,sqrt(varx))
a<-table.element(a,sqrt(vary))
a<-table.row.end(a)
a<-table.row.start(a)
a<-table.element(a,hyperlink('covariance.htm','Covariance',''),header=TRUE)
a<-table.element(a,cov(x,y),2)
a<-table.row.end(a)
a<-table.row.start(a)
a<-table.element(a,hyperlink('pearson_correlation.htm','Correlation',''),header=TRUE)
a<-table.element(a,cxy,2)
a<-table.row.end(a)
a<-table.row.start(a)
a<-table.element(a,hyperlink('coeff_of_determination.htm','Determination',''),header=TRUE)
a<-table.element(a,cxy*cxy,2)
a<-table.row.end(a)
a<-table.row.start(a)
a<-table.element(a,hyperlink('ttest_statistic.htm','T-Test',''),header=TRUE)
a<-table.element(a,as.matrix(corxy$statistic)[1,1],2)
a<-table.row.end(a)
a<-table.row.start(a)
a<-table.element(a,'p-value (2 sided)',header=TRUE)
a<-table.element(a,(p2 <- as.matrix(corxy$p.value)[1,1]),2)
a<-table.row.end(a)
a<-table.row.start(a)
a<-table.element(a,'p-value (1 sided)',header=TRUE)
a<-table.element(a,p2/2,2)
a<-table.row.end(a)
a<-table.row.start(a)
a<-table.element(a,'Degrees of Freedom',header=TRUE)
a<-table.element(a,lx-2,2)
a<-table.row.end(a)
a<-table.row.start(a)
a<-table.element(a,'Number of Observations',header=TRUE)
a<-table.element(a,lx,2)
a<-table.row.end(a)
a<-table.end(a)
table.save(a,file='mytable.tab')