Free Statistics

of Irreproducible Research!

Author's title

Author*Unverified author*
R Software Modulerwasp_multipleregression.wasp
Title produced by softwareMultiple Regression
Date of computationThu, 27 Nov 2008 06:40:54 -0700
Cite this page as followsStatistical Computations at FreeStatistics.org, Office for Research Development and Education, URL https://freestatistics.org/blog/index.php?v=date/2008/Nov/27/t1227793517pl3veu4aop2x0n6.htm/, Retrieved Fri, 17 May 2024 22:04:23 +0000
Statistical Computations at FreeStatistics.org, Office for Research Development and Education, URL https://freestatistics.org/blog/index.php?pk=25807, Retrieved Fri, 17 May 2024 22:04:23 +0000
QR Codes:

Original text written by user:
IsPrivate?No (this computation is public)
User-defined keywords
Estimated Impact199
Family? (F = Feedback message, R = changed R code, M = changed R Module, P = changed Parameters, D = changed Data)
F     [Multiple Regression] [] [2007-11-19 20:22:41] [3a1956effdcb54c39e5044435310d6c8]
F    D    [Multiple Regression] [workshop 3 eigen ...] [2008-11-27 13:40:54] [d41d8cd98f00b204e9800998ecf8427e] [Current]
Feedback Forum
2008-11-28 15:40:42 [Philip Van Herck] [reply
Verbazingwekkend genoeg worden er zonder een nader bekende gebeurtenis en door middel van een dummyvariabele vanaf een bepaald moment, toch significante resultaten gevonden. Enkele de p-waarden van de 1-tailed test van de parameters voldoen toch aan de voorwaarde van kleiner te zijn dan 5% maar het belangrijkste van al is dat dit bij de dummyvariabele ook het geval is. De rest van de analyse is zeer correct.
2008-12-01 17:09:17 [Kevin Vermeiren] [reply
De gebruikte symbolen werden correct uitgelegd. Echter de verklaring voor X kon wel duidelijker. X is een variabele, en indien deze variabele 1 is, de gebeurtenis komt voor, dan wordt de parameter 20.06 bij de constante opgeteld en niet de variabele zelf. Indien X= 0 valt inderdaad de parameter weg.

Multiple Linear Regression - Ordinary Least Squares:
De conclusie in verband met de M-waarden is correct. Het klopt dat er zowel postieve als negatieve getallen tussen zitten. Hier had nog vermeld kunnen worden dat een postieve – negatieve - waarde duidt op een hogere – lagere - productie vergeleken met de referentiemaand december. Verder worden de parameters van de nulhypothese terecht ingesteld op 0 aangezien er vanuit wordt gegaan dat de gebeurtenis geen invloed heeft op de productie, tenzij het tegendeel wordt bewezen. Ook de werd de keuze voor een 2-zijdige test correct beargumenteerd. Omdat er hier sprake is van een onbekende gebeurtenis is het nodig om met een 2-zijdige test te werken. Wordt er dan gekeken naar de overeenkomstige p-waarde tabel kunnen we inderdaad concluderen dat niet alle waarden significant verschillend zijn, deze kunnen dus aan toeval toegeschreven worden. Het is niet juist te concluderen dat de gebeurtenis enkel door toeval een verhoging tot stand brengt want er zijn wel waarden die significant verschillend zijn. Verder onderzoek is nodig.

Multiple Linear Regression - Regression Statistics:
Het klopt dat er gekeken moet worden naar de “adjusted R-squared”. Deze waarde vertelt, zoals de student correct vermeld, hoeveel procent van de schommelingen ontstaan door het voorkomen van de gebeurtenis er verklaard kunnen worden door het model. Aangezien deze een vrij hoge waarde representeert (80%) kunnen we terecht besluiten dat dit een vrij goed model is.

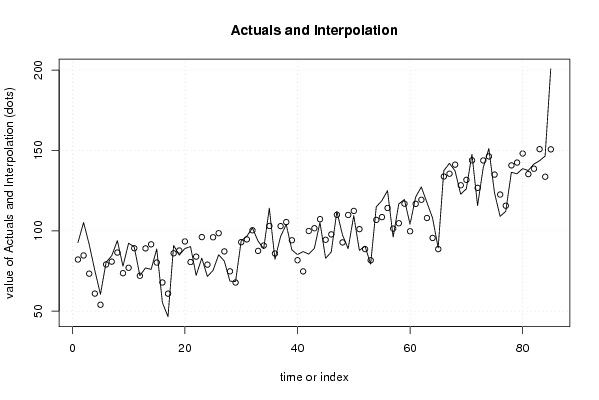
Actuals and interpolation:
Hier geeft de student een goed antwoord. Het klopt dat er een stijgende trend en een niveauverschil waarneembaar is. Uiteraard komt dit niveauverschil voort uit het voorkomen van de gebeurtenis.

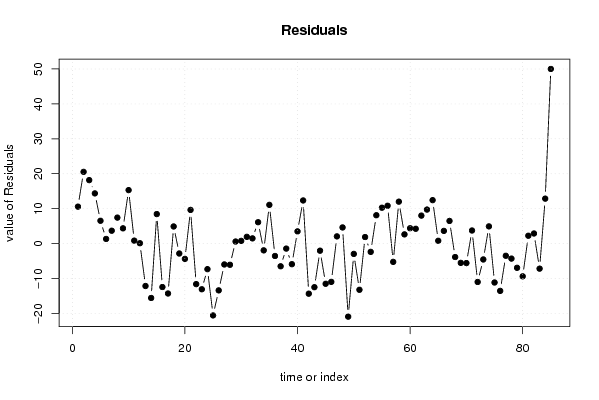
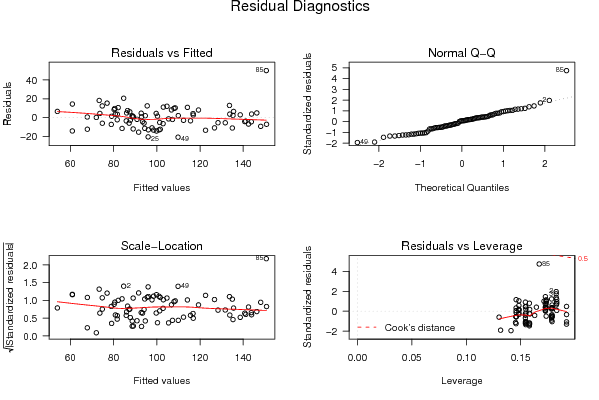
Residuals:
Het klopt dat deze grafiek de voorspellingsfouten weergeeft. Om aan de assumpties voor een goed model te voldoen zou het gemiddelde van deze voorspellingsfouten constant en gelijk aan 0 moeten zijn. Je kan inderdaad zien dat dit hier niet het geval is. Bijgevolg had de student nog kunnen vermelden dat het model dus nog niet goed genoeg is.

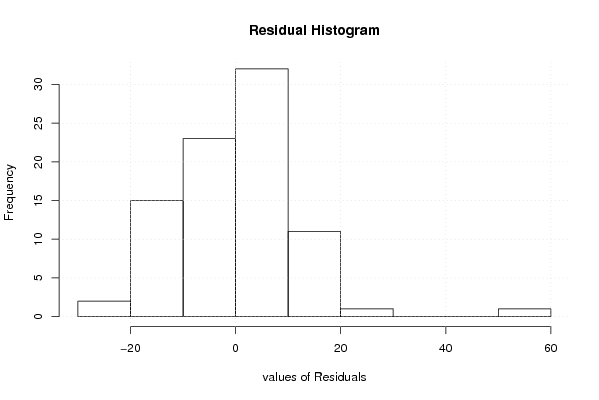
Residuals histogram:
Ook hier geeft de student een goed antwoord. Het histogram zou inderdaad een normaal verdeling moeten representeren maar uit de grafiek blijkt dat dit niet zo is. Echter, hier is er sprake van een rechtsscheefheid en niet van een linksscheefheid.

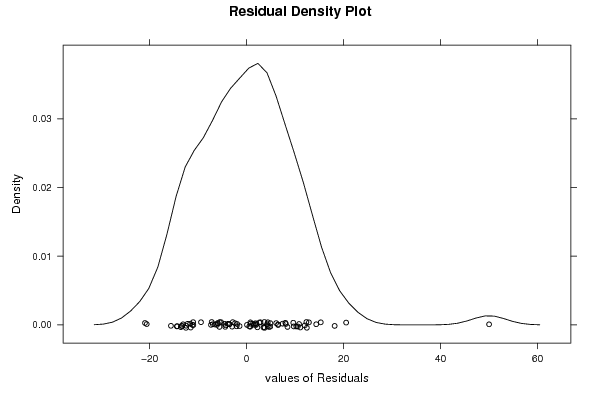
Residuals density plot:
De conclusie van de student is correct. De density plot geeft inderdaad weer hoe normaal de voorspellingsfouten verdeeld zijn. Uit de grafiek kunnen we besluiten dat deze niet volledig normaal verdeeld zijn en dat er een scheefheid is aan de rechterkant.

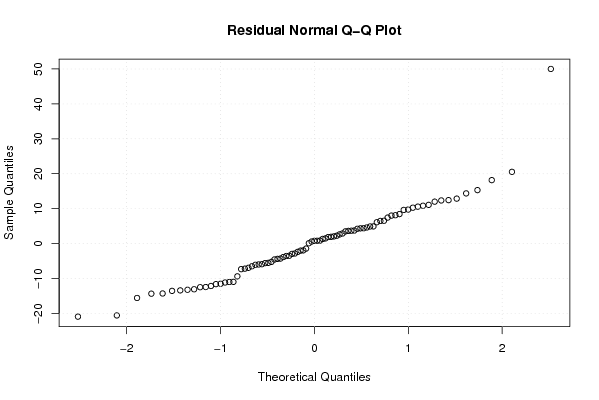
Residuals normal q-q plot:
De student geeft hier een goed antwoord. Ook wordt er correct de werking van de plot uitgelegd namelijk dat de grafiek weergeeft hoe goed de quantielen van de residu’s overeenkomen met de quantielen van de theoretische normaalverdeling. Uit de grafiek blijkt dat deze redelijk overeenkomen. Bijgevolg kunnen we, zoals de student terecht vermeld, stellen dat de voorspellingsfouten redelijk normaal verdeeld zijn. Aan de staarten zijn nog wel enkele extremen waarneembaar.

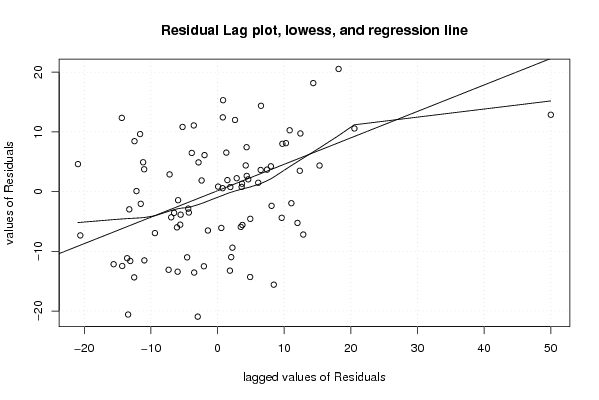
lag plot:
het klopt inderdaad dat de grafiek het verband weerspiegelt tussen de voorspellingsfout nu en die van vorige maand. Het blijkt duidelijk dat er weinig correlatie is. Bijgevolg kunnen we stellen, dit had de student nog kunnen vermelden, dat er dan ook weinig voorspelbaarheid is. De student concludeert echter dat het geen goed model is. Uit deze grafiek blijkt echter dat het toch een tamelijk goed model is. Indien er een postieve correlatie zou zijn, zou dit een bewijs leveren van voorspelbaarheid. Bijgevolg zou het model nog kunnen verbeterd worden.

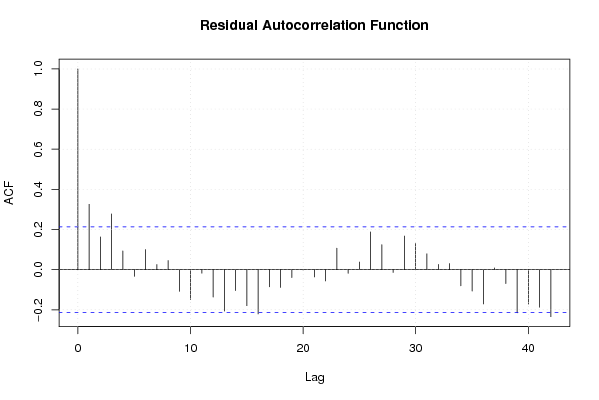
Residuals autocorrelation function:
De student geeft goed weer wat de blauwe lijnen in de grafiek willen zeggen maar dan had hij ook beter gezegd wat die verticale lijnen dan representeren. Deze lijnen stellen de voorspellingsfouten weer. Het klopt dat indien deze verticale lijnen buiten het betrouwbaarheidsinterval vallen, deze voorspellingsfouten significant verschillend zijn. De student concludeert terecht dat deze voorspellingsfouten dan niet toevallig zijn.

Algemene conclusie:
De algemene conclusie van de student is volledig correct. De 2 assumpties die voldaan zouden moeten zijn om tot een goed model te besluiten werden getest. Zo wordt er terecht gezegd dat de assumptie “geen patroon en geen autocorrelatie” voldaan is. Dit is duidelijk te merken in de laatste grafiek.

Post a new message
Dataseries X:
92.7	0
105.2	0
91.5	0
75.3	0
60.5	0
80.4	0
84.5	0
93.9	0
78	0
92.3	0
90	0
72.1	0
76.9	0
76	0
88.7	0
55.4	0
46.6	0
90.9	0
84.9	0
89	0
90.2	0
72.3	0
83	0
71.6	0
75.4	0
85.1	0
81.2	0
68.7	0
68.4	0
93.7	0
96.6	0
101.8	0
93.6	0
88.9	0
114.1	0
82.3	0
96.4	0
104	0
88.2	0
85.2	0
87.1	0
85.5	0
89.1	0
105.2	0
82.9	0
86.8	0
112	0
97.4	0
88.9	0
109.4	0
87.8	0
90.5	0
79.3	0
114.9	0
118.8	0
125	0
96.1	0
116.7	0
119.5	0
104.1	0
121	0
127.3	0
117.7	0
108	0
89.4	0
137.4	1
142	1
137.3	1
122.8	1
126.1	1
147.6	1
115.7	1
139.2	1
151.2	1
123.8	1
109	1
112.1	1
136.4	1
135.5	1
138.7	1
137.5	1
141.5	1
143.6	1
146.5	1
200.7	1


Summary of computational transaction
Raw Inputview raw input (R code)
Raw Outputview raw output of R engine
Computing time4 seconds
R Server'Gwilym Jenkins' @ 72.249.127.135

\begin{tabular}{lllllllll}
\hline
Summary of computational transaction \tabularnewline
Raw Input & view raw input (R code)  \tabularnewline
Raw Output & view raw output of R engine  \tabularnewline
Computing time & 4 seconds \tabularnewline
R Server & 'Gwilym Jenkins' @ 72.249.127.135 \tabularnewline
\hline
\end{tabular}
%Source: https://freestatistics.org/blog/index.php?pk=25807&T=0

[TABLE]
[ROW][C]Summary of computational transaction[/C][/ROW]
[ROW][C]Raw Input[/C][C]view raw input (R code) [/C][/ROW]
[ROW][C]Raw Output[/C][C]view raw output of R engine [/C][/ROW]
[ROW][C]Computing time[/C][C]4 seconds[/C][/ROW]
[ROW][C]R Server[/C][C]'Gwilym Jenkins' @ 72.249.127.135[/C][/ROW]
[/TABLE]
Source: https://freestatistics.org/blog/index.php?pk=25807&T=0

Globally Unique Identifier (entire table): ba.freestatistics.org/blog/index.php?pk=25807&T=0

As an alternative you can also use a QR Code:  

The GUIDs for individual cells are displayed in the table below:

Summary of computational transaction
Raw Inputview raw input (R code)
Raw Outputview raw output of R engine
Computing time4 seconds
R Server'Gwilym Jenkins' @ 72.249.127.135


Multiple Linear Regression - Estimated Regression Equation
L&S[t] = + 65.0887417218543 + 20.0648178807947D[t] + 16.4741776056448M1[t] + 18.4244136313465M2[t] + 6.51861252365184M3[t] -6.45861715547149M4[t] -13.9929896917376M5[t] + 10.5348066461684M6[t] + 11.7004341099022M7[t] + 16.7660615736361M8[t] + 3.36026046594133M9[t] + 6.14017364396088M10[t] + 17.7343725362661M11[t] + 0.577229679123305t + e[t]

\begin{tabular}{lllllllll}
\hline
Multiple Linear Regression - Estimated Regression Equation \tabularnewline
L&S[t] =  +  65.0887417218543 +  20.0648178807947D[t] +  16.4741776056448M1[t] +  18.4244136313465M2[t] +  6.51861252365184M3[t] -6.45861715547149M4[t] -13.9929896917376M5[t] +  10.5348066461684M6[t] +  11.7004341099022M7[t] +  16.7660615736361M8[t] +  3.36026046594133M9[t] +  6.14017364396088M10[t] +  17.7343725362661M11[t] +  0.577229679123305t  + e[t] \tabularnewline
\hline
\end{tabular}
%Source: https://freestatistics.org/blog/index.php?pk=25807&T=1

[TABLE]
[ROW][C]Multiple Linear Regression - Estimated Regression Equation[/C][/ROW]
[ROW][C]L&S[t] =  +  65.0887417218543 +  20.0648178807947D[t] +  16.4741776056448M1[t] +  18.4244136313465M2[t] +  6.51861252365184M3[t] -6.45861715547149M4[t] -13.9929896917376M5[t] +  10.5348066461684M6[t] +  11.7004341099022M7[t] +  16.7660615736361M8[t] +  3.36026046594133M9[t] +  6.14017364396088M10[t] +  17.7343725362661M11[t] +  0.577229679123305t  + e[t][/C][/ROW]
[/TABLE]
Source: https://freestatistics.org/blog/index.php?pk=25807&T=1

Globally Unique Identifier (entire table): ba.freestatistics.org/blog/index.php?pk=25807&T=1

As an alternative you can also use a QR Code:  

The GUIDs for individual cells are displayed in the table below:

Multiple Linear Regression - Estimated Regression Equation
L&S[t] = + 65.0887417218543 + 20.0648178807947D[t] + 16.4741776056448M1[t] + 18.4244136313465M2[t] + 6.51861252365184M3[t] -6.45861715547149M4[t] -13.9929896917376M5[t] + 10.5348066461684M6[t] + 11.7004341099022M7[t] + 16.7660615736361M8[t] + 3.36026046594133M9[t] + 6.14017364396088M10[t] + 17.7343725362661M11[t] + 0.577229679123305t + e[t]


Multiple Linear Regression - Ordinary Least Squares
VariableParameterS.D.T-STATH0: parameter = 02-tail p-value1-tail p-value
(Intercept)65.08874172185435.21202712.488200
D20.06481788079474.398564.56172.1e-051e-05
M116.47417760564485.9877842.75130.0075270.003764
M218.42441363134656.1990342.97210.0040350.002018
M36.518612523651846.1958771.05210.2963260.148163
M4-6.458617155471496.193644-1.04280.3005870.150294
M5-13.99298969173766.192336-2.25970.0269080.013454
M610.53480664616846.1938661.70080.0933480.046674
M711.70043410990226.1887751.89060.062760.03138
M816.76606157363616.1846062.71090.0084080.004204
M93.360260465941336.1813630.54360.5884120.294206
M106.140173643960886.1790440.99370.3237390.16187
M1117.73437253626616.1776532.87070.0053930.002697
t0.5772296791233050.0757017.625100

\begin{tabular}{lllllllll}
\hline
Multiple Linear Regression - Ordinary Least Squares \tabularnewline
Variable & Parameter & S.D. & T-STATH0: parameter = 0 & 2-tail p-value & 1-tail p-value \tabularnewline
(Intercept) & 65.0887417218543 & 5.212027 & 12.4882 & 0 & 0 \tabularnewline
D & 20.0648178807947 & 4.39856 & 4.5617 & 2.1e-05 & 1e-05 \tabularnewline
M1 & 16.4741776056448 & 5.987784 & 2.7513 & 0.007527 & 0.003764 \tabularnewline
M2 & 18.4244136313465 & 6.199034 & 2.9721 & 0.004035 & 0.002018 \tabularnewline
M3 & 6.51861252365184 & 6.195877 & 1.0521 & 0.296326 & 0.148163 \tabularnewline
M4 & -6.45861715547149 & 6.193644 & -1.0428 & 0.300587 & 0.150294 \tabularnewline
M5 & -13.9929896917376 & 6.192336 & -2.2597 & 0.026908 & 0.013454 \tabularnewline
M6 & 10.5348066461684 & 6.193866 & 1.7008 & 0.093348 & 0.046674 \tabularnewline
M7 & 11.7004341099022 & 6.188775 & 1.8906 & 0.06276 & 0.03138 \tabularnewline
M8 & 16.7660615736361 & 6.184606 & 2.7109 & 0.008408 & 0.004204 \tabularnewline
M9 & 3.36026046594133 & 6.181363 & 0.5436 & 0.588412 & 0.294206 \tabularnewline
M10 & 6.14017364396088 & 6.179044 & 0.9937 & 0.323739 & 0.16187 \tabularnewline
M11 & 17.7343725362661 & 6.177653 & 2.8707 & 0.005393 & 0.002697 \tabularnewline
t & 0.577229679123305 & 0.075701 & 7.6251 & 0 & 0 \tabularnewline
\hline
\end{tabular}
%Source: https://freestatistics.org/blog/index.php?pk=25807&T=2

[TABLE]
[ROW][C]Multiple Linear Regression - Ordinary Least Squares[/C][/ROW]
[ROW][C]Variable[/C][C]Parameter[/C][C]S.D.[/C][C]T-STATH0: parameter = 0[/C][C]2-tail p-value[/C][C]1-tail p-value[/C][/ROW]
[ROW][C](Intercept)[/C][C]65.0887417218543[/C][C]5.212027[/C][C]12.4882[/C][C]0[/C][C]0[/C][/ROW]
[ROW][C]D[/C][C]20.0648178807947[/C][C]4.39856[/C][C]4.5617[/C][C]2.1e-05[/C][C]1e-05[/C][/ROW]
[ROW][C]M1[/C][C]16.4741776056448[/C][C]5.987784[/C][C]2.7513[/C][C]0.007527[/C][C]0.003764[/C][/ROW]
[ROW][C]M2[/C][C]18.4244136313465[/C][C]6.199034[/C][C]2.9721[/C][C]0.004035[/C][C]0.002018[/C][/ROW]
[ROW][C]M3[/C][C]6.51861252365184[/C][C]6.195877[/C][C]1.0521[/C][C]0.296326[/C][C]0.148163[/C][/ROW]
[ROW][C]M4[/C][C]-6.45861715547149[/C][C]6.193644[/C][C]-1.0428[/C][C]0.300587[/C][C]0.150294[/C][/ROW]
[ROW][C]M5[/C][C]-13.9929896917376[/C][C]6.192336[/C][C]-2.2597[/C][C]0.026908[/C][C]0.013454[/C][/ROW]
[ROW][C]M6[/C][C]10.5348066461684[/C][C]6.193866[/C][C]1.7008[/C][C]0.093348[/C][C]0.046674[/C][/ROW]
[ROW][C]M7[/C][C]11.7004341099022[/C][C]6.188775[/C][C]1.8906[/C][C]0.06276[/C][C]0.03138[/C][/ROW]
[ROW][C]M8[/C][C]16.7660615736361[/C][C]6.184606[/C][C]2.7109[/C][C]0.008408[/C][C]0.004204[/C][/ROW]
[ROW][C]M9[/C][C]3.36026046594133[/C][C]6.181363[/C][C]0.5436[/C][C]0.588412[/C][C]0.294206[/C][/ROW]
[ROW][C]M10[/C][C]6.14017364396088[/C][C]6.179044[/C][C]0.9937[/C][C]0.323739[/C][C]0.16187[/C][/ROW]
[ROW][C]M11[/C][C]17.7343725362661[/C][C]6.177653[/C][C]2.8707[/C][C]0.005393[/C][C]0.002697[/C][/ROW]
[ROW][C]t[/C][C]0.577229679123305[/C][C]0.075701[/C][C]7.6251[/C][C]0[/C][C]0[/C][/ROW]
[/TABLE]
Source: https://freestatistics.org/blog/index.php?pk=25807&T=2

Globally Unique Identifier (entire table): ba.freestatistics.org/blog/index.php?pk=25807&T=2

As an alternative you can also use a QR Code:  

The GUIDs for individual cells are displayed in the table below:

Multiple Linear Regression - Ordinary Least Squares
VariableParameterS.D.T-STATH0: parameter = 02-tail p-value1-tail p-value
(Intercept)65.08874172185435.21202712.488200
D20.06481788079474.398564.56172.1e-051e-05
M116.47417760564485.9877842.75130.0075270.003764
M218.42441363134656.1990342.97210.0040350.002018
M36.518612523651846.1958771.05210.2963260.148163
M4-6.458617155471496.193644-1.04280.3005870.150294
M5-13.99298969173766.192336-2.25970.0269080.013454
M610.53480664616846.1938661.70080.0933480.046674
M711.70043410990226.1887751.89060.062760.03138
M816.76606157363616.1846062.71090.0084080.004204
M93.360260465941336.1813630.54360.5884120.294206
M106.140173643960886.1790440.99370.3237390.16187
M1117.73437253626616.1776532.87070.0053930.002697
t0.5772296791233050.0757017.625100


Multiple Linear Regression - Regression Statistics
Multiple R0.913091388812815
R-squared0.833735884324115
Adjusted R-squared0.803293158918671
F-TEST (value)27.3870316543679
F-TEST (DF numerator)13
F-TEST (DF denominator)71
p-value0
Multiple Linear Regression - Residual Statistics
Residual Standard Deviation11.5564627533259
Sum Squared Residuals9482.18002719962

\begin{tabular}{lllllllll}
\hline
Multiple Linear Regression - Regression Statistics \tabularnewline
Multiple R & 0.913091388812815 \tabularnewline
R-squared & 0.833735884324115 \tabularnewline
Adjusted R-squared & 0.803293158918671 \tabularnewline
F-TEST (value) & 27.3870316543679 \tabularnewline
F-TEST (DF numerator) & 13 \tabularnewline
F-TEST (DF denominator) & 71 \tabularnewline
p-value & 0 \tabularnewline
Multiple Linear Regression - Residual Statistics \tabularnewline
Residual Standard Deviation & 11.5564627533259 \tabularnewline
Sum Squared Residuals & 9482.18002719962 \tabularnewline
\hline
\end{tabular}
%Source: https://freestatistics.org/blog/index.php?pk=25807&T=3

[TABLE]
[ROW][C]Multiple Linear Regression - Regression Statistics[/C][/ROW]
[ROW][C]Multiple R[/C][C]0.913091388812815[/C][/ROW]
[ROW][C]R-squared[/C][C]0.833735884324115[/C][/ROW]
[ROW][C]Adjusted R-squared[/C][C]0.803293158918671[/C][/ROW]
[ROW][C]F-TEST (value)[/C][C]27.3870316543679[/C][/ROW]
[ROW][C]F-TEST (DF numerator)[/C][C]13[/C][/ROW]
[ROW][C]F-TEST (DF denominator)[/C][C]71[/C][/ROW]
[ROW][C]p-value[/C][C]0[/C][/ROW]
[ROW][C]Multiple Linear Regression - Residual Statistics[/C][/ROW]
[ROW][C]Residual Standard Deviation[/C][C]11.5564627533259[/C][/ROW]
[ROW][C]Sum Squared Residuals[/C][C]9482.18002719962[/C][/ROW]
[/TABLE]
Source: https://freestatistics.org/blog/index.php?pk=25807&T=3

Globally Unique Identifier (entire table): ba.freestatistics.org/blog/index.php?pk=25807&T=3

As an alternative you can also use a QR Code:  

The GUIDs for individual cells are displayed in the table below:

Multiple Linear Regression - Regression Statistics
Multiple R0.913091388812815
R-squared0.833735884324115
Adjusted R-squared0.803293158918671
F-TEST (value)27.3870316543679
F-TEST (DF numerator)13
F-TEST (DF denominator)71
p-value0
Multiple Linear Regression - Residual Statistics
Residual Standard Deviation11.5564627533259
Sum Squared Residuals9482.18002719962


Multiple Linear Regression - Actuals, Interpolation, and Residuals
Time or IndexActualsInterpolationForecastResidualsPrediction Error
192.782.140149006622610.5598509933774
2105.284.667614711447520.5323852885525
391.573.33904328287618.1609567171240
475.360.939043282876114.3609567171239
560.553.98190042573326.5180995742668
680.479.08692644276251.31307355723751
784.580.82978358561973.67021641438035
893.986.47264072847687.42735927152319
97873.64406929990544.35593070009461
1092.377.001212157048315.2987878429517
119089.17264072847680.8273592715232
1272.172.0154978713340.0845021286660279
1376.989.0669051561022-12.1669051561022
147691.5943708609271-15.5943708609271
1588.780.26579943235578.43420056764426
1655.467.8657994323557-12.4657994323557
1746.660.9086565752129-14.3086565752129
1890.986.01368259224224.8863174077578
1984.987.7565397350993-2.85653973509934
208993.3993968779565-4.39939687795648
2190.280.5708254493859.62917455061495
2272.383.9279683065279-11.6279683065279
238396.0993968779565-13.0993968779565
2471.678.9422540208136-7.34225402081364
2575.495.9936613055818-20.5936613055818
2685.198.5211270104068-13.4211270104068
2781.287.1925555818354-5.9925555818354
2868.774.7925555818354-6.09255558183539
2968.467.83541272469250.564587275307474
3093.792.94043874172190.759561258278139
3196.694.6832958845791.91670411542100
32101.8100.3261530274361.47384697256386
3393.687.49758159886476.10241840113529
3488.990.8547244560076-1.95472445600756
35114.1103.02615302743611.0738469725638
3682.385.8690101702933-3.56901017029329
3796.4102.920417455061-6.52041745506146
38104105.447883159886-1.44788315988646
3988.294.119311731315-5.91931173131506
4085.281.7193117313153.48068826868495
4187.174.762168874172212.3378311258278
4285.599.8671948912015-14.3671948912015
4389.1101.610052034059-12.5100520340587
44105.2107.252909176916-2.0529091769158
4582.994.4243377483444-11.5243377483444
4686.897.7814806054872-10.9814806054872
47112109.9529091769162.0470908230842
4897.492.7957663197734.60423368022707
4988.9109.847173604541-20.9471736045411
50109.4112.374639309366-2.97463930936611
5187.8101.046067880795-13.2460678807947
5290.588.64606788079471.85393211920530
5379.381.6889250236518-2.38892502365185
54114.9106.7939510406818.10604895931882
55118.8108.53680818353810.2631918164617
56125114.17966532639510.8203346736045
5796.1101.351093897824-5.25109389782403
58116.7104.70823675496711.9917632450331
59119.5116.8796653263952.62033467360453
60104.199.72252246925264.37747753074739
61121116.7739297540214.22607024597922
62127.3119.3013954588467.99860454115422
63117.7107.9728240302749.72717596972563
6410895.572824030274412.4271759697256
6589.488.61568117313150.784318826868499
66137.4133.7855250709563.61447492904446
67142135.5283822138136.47161778618732
68137.3141.171239356670-3.87123935666981
69122.8128.342667928098-5.5426679280984
70126.1131.699810785241-5.59981078524125
71147.6143.8712393566703.72876064333017
72115.7126.714096499527-11.0140964995270
73139.2143.765503784295-4.56550378429516
74151.2146.292969489124.90703051087985
75123.8134.964398060549-11.1643980605487
76109122.564398060549-13.5643980605487
77112.1115.607255203406-3.50725520340587
78136.4140.712281220435-4.31228122043519
79135.5142.455138363292-6.95513836329234
80138.7148.097995506149-9.3979955061495
81137.5135.2694240775782.23057592242195
82141.5138.6265669347212.87343306527910
83143.6150.797995506149-7.19799550614948
84146.5133.64085264900712.8591473509934
85200.7150.69225993377550.0077400662252

\begin{tabular}{lllllllll}
\hline
Multiple Linear Regression - Actuals, Interpolation, and Residuals \tabularnewline
Time or Index & Actuals & InterpolationForecast & ResidualsPrediction Error \tabularnewline
1 & 92.7 & 82.1401490066226 & 10.5598509933774 \tabularnewline
2 & 105.2 & 84.6676147114475 & 20.5323852885525 \tabularnewline
3 & 91.5 & 73.339043282876 & 18.1609567171240 \tabularnewline
4 & 75.3 & 60.9390432828761 & 14.3609567171239 \tabularnewline
5 & 60.5 & 53.9819004257332 & 6.5180995742668 \tabularnewline
6 & 80.4 & 79.0869264427625 & 1.31307355723751 \tabularnewline
7 & 84.5 & 80.8297835856197 & 3.67021641438035 \tabularnewline
8 & 93.9 & 86.4726407284768 & 7.42735927152319 \tabularnewline
9 & 78 & 73.6440692999054 & 4.35593070009461 \tabularnewline
10 & 92.3 & 77.0012121570483 & 15.2987878429517 \tabularnewline
11 & 90 & 89.1726407284768 & 0.8273592715232 \tabularnewline
12 & 72.1 & 72.015497871334 & 0.0845021286660279 \tabularnewline
13 & 76.9 & 89.0669051561022 & -12.1669051561022 \tabularnewline
14 & 76 & 91.5943708609271 & -15.5943708609271 \tabularnewline
15 & 88.7 & 80.2657994323557 & 8.43420056764426 \tabularnewline
16 & 55.4 & 67.8657994323557 & -12.4657994323557 \tabularnewline
17 & 46.6 & 60.9086565752129 & -14.3086565752129 \tabularnewline
18 & 90.9 & 86.0136825922422 & 4.8863174077578 \tabularnewline
19 & 84.9 & 87.7565397350993 & -2.85653973509934 \tabularnewline
20 & 89 & 93.3993968779565 & -4.39939687795648 \tabularnewline
21 & 90.2 & 80.570825449385 & 9.62917455061495 \tabularnewline
22 & 72.3 & 83.9279683065279 & -11.6279683065279 \tabularnewline
23 & 83 & 96.0993968779565 & -13.0993968779565 \tabularnewline
24 & 71.6 & 78.9422540208136 & -7.34225402081364 \tabularnewline
25 & 75.4 & 95.9936613055818 & -20.5936613055818 \tabularnewline
26 & 85.1 & 98.5211270104068 & -13.4211270104068 \tabularnewline
27 & 81.2 & 87.1925555818354 & -5.9925555818354 \tabularnewline
28 & 68.7 & 74.7925555818354 & -6.09255558183539 \tabularnewline
29 & 68.4 & 67.8354127246925 & 0.564587275307474 \tabularnewline
30 & 93.7 & 92.9404387417219 & 0.759561258278139 \tabularnewline
31 & 96.6 & 94.683295884579 & 1.91670411542100 \tabularnewline
32 & 101.8 & 100.326153027436 & 1.47384697256386 \tabularnewline
33 & 93.6 & 87.4975815988647 & 6.10241840113529 \tabularnewline
34 & 88.9 & 90.8547244560076 & -1.95472445600756 \tabularnewline
35 & 114.1 & 103.026153027436 & 11.0738469725638 \tabularnewline
36 & 82.3 & 85.8690101702933 & -3.56901017029329 \tabularnewline
37 & 96.4 & 102.920417455061 & -6.52041745506146 \tabularnewline
38 & 104 & 105.447883159886 & -1.44788315988646 \tabularnewline
39 & 88.2 & 94.119311731315 & -5.91931173131506 \tabularnewline
40 & 85.2 & 81.719311731315 & 3.48068826868495 \tabularnewline
41 & 87.1 & 74.7621688741722 & 12.3378311258278 \tabularnewline
42 & 85.5 & 99.8671948912015 & -14.3671948912015 \tabularnewline
43 & 89.1 & 101.610052034059 & -12.5100520340587 \tabularnewline
44 & 105.2 & 107.252909176916 & -2.0529091769158 \tabularnewline
45 & 82.9 & 94.4243377483444 & -11.5243377483444 \tabularnewline
46 & 86.8 & 97.7814806054872 & -10.9814806054872 \tabularnewline
47 & 112 & 109.952909176916 & 2.0470908230842 \tabularnewline
48 & 97.4 & 92.795766319773 & 4.60423368022707 \tabularnewline
49 & 88.9 & 109.847173604541 & -20.9471736045411 \tabularnewline
50 & 109.4 & 112.374639309366 & -2.97463930936611 \tabularnewline
51 & 87.8 & 101.046067880795 & -13.2460678807947 \tabularnewline
52 & 90.5 & 88.6460678807947 & 1.85393211920530 \tabularnewline
53 & 79.3 & 81.6889250236518 & -2.38892502365185 \tabularnewline
54 & 114.9 & 106.793951040681 & 8.10604895931882 \tabularnewline
55 & 118.8 & 108.536808183538 & 10.2631918164617 \tabularnewline
56 & 125 & 114.179665326395 & 10.8203346736045 \tabularnewline
57 & 96.1 & 101.351093897824 & -5.25109389782403 \tabularnewline
58 & 116.7 & 104.708236754967 & 11.9917632450331 \tabularnewline
59 & 119.5 & 116.879665326395 & 2.62033467360453 \tabularnewline
60 & 104.1 & 99.7225224692526 & 4.37747753074739 \tabularnewline
61 & 121 & 116.773929754021 & 4.22607024597922 \tabularnewline
62 & 127.3 & 119.301395458846 & 7.99860454115422 \tabularnewline
63 & 117.7 & 107.972824030274 & 9.72717596972563 \tabularnewline
64 & 108 & 95.5728240302744 & 12.4271759697256 \tabularnewline
65 & 89.4 & 88.6156811731315 & 0.784318826868499 \tabularnewline
66 & 137.4 & 133.785525070956 & 3.61447492904446 \tabularnewline
67 & 142 & 135.528382213813 & 6.47161778618732 \tabularnewline
68 & 137.3 & 141.171239356670 & -3.87123935666981 \tabularnewline
69 & 122.8 & 128.342667928098 & -5.5426679280984 \tabularnewline
70 & 126.1 & 131.699810785241 & -5.59981078524125 \tabularnewline
71 & 147.6 & 143.871239356670 & 3.72876064333017 \tabularnewline
72 & 115.7 & 126.714096499527 & -11.0140964995270 \tabularnewline
73 & 139.2 & 143.765503784295 & -4.56550378429516 \tabularnewline
74 & 151.2 & 146.29296948912 & 4.90703051087985 \tabularnewline
75 & 123.8 & 134.964398060549 & -11.1643980605487 \tabularnewline
76 & 109 & 122.564398060549 & -13.5643980605487 \tabularnewline
77 & 112.1 & 115.607255203406 & -3.50725520340587 \tabularnewline
78 & 136.4 & 140.712281220435 & -4.31228122043519 \tabularnewline
79 & 135.5 & 142.455138363292 & -6.95513836329234 \tabularnewline
80 & 138.7 & 148.097995506149 & -9.3979955061495 \tabularnewline
81 & 137.5 & 135.269424077578 & 2.23057592242195 \tabularnewline
82 & 141.5 & 138.626566934721 & 2.87343306527910 \tabularnewline
83 & 143.6 & 150.797995506149 & -7.19799550614948 \tabularnewline
84 & 146.5 & 133.640852649007 & 12.8591473509934 \tabularnewline
85 & 200.7 & 150.692259933775 & 50.0077400662252 \tabularnewline
\hline
\end{tabular}
%Source: https://freestatistics.org/blog/index.php?pk=25807&T=4

[TABLE]
[ROW][C]Multiple Linear Regression - Actuals, Interpolation, and Residuals[/C][/ROW]
[ROW][C]Time or Index[/C][C]Actuals[/C][C]InterpolationForecast[/C][C]ResidualsPrediction Error[/C][/ROW]
[ROW][C]1[/C][C]92.7[/C][C]82.1401490066226[/C][C]10.5598509933774[/C][/ROW]
[ROW][C]2[/C][C]105.2[/C][C]84.6676147114475[/C][C]20.5323852885525[/C][/ROW]
[ROW][C]3[/C][C]91.5[/C][C]73.339043282876[/C][C]18.1609567171240[/C][/ROW]
[ROW][C]4[/C][C]75.3[/C][C]60.9390432828761[/C][C]14.3609567171239[/C][/ROW]
[ROW][C]5[/C][C]60.5[/C][C]53.9819004257332[/C][C]6.5180995742668[/C][/ROW]
[ROW][C]6[/C][C]80.4[/C][C]79.0869264427625[/C][C]1.31307355723751[/C][/ROW]
[ROW][C]7[/C][C]84.5[/C][C]80.8297835856197[/C][C]3.67021641438035[/C][/ROW]
[ROW][C]8[/C][C]93.9[/C][C]86.4726407284768[/C][C]7.42735927152319[/C][/ROW]
[ROW][C]9[/C][C]78[/C][C]73.6440692999054[/C][C]4.35593070009461[/C][/ROW]
[ROW][C]10[/C][C]92.3[/C][C]77.0012121570483[/C][C]15.2987878429517[/C][/ROW]
[ROW][C]11[/C][C]90[/C][C]89.1726407284768[/C][C]0.8273592715232[/C][/ROW]
[ROW][C]12[/C][C]72.1[/C][C]72.015497871334[/C][C]0.0845021286660279[/C][/ROW]
[ROW][C]13[/C][C]76.9[/C][C]89.0669051561022[/C][C]-12.1669051561022[/C][/ROW]
[ROW][C]14[/C][C]76[/C][C]91.5943708609271[/C][C]-15.5943708609271[/C][/ROW]
[ROW][C]15[/C][C]88.7[/C][C]80.2657994323557[/C][C]8.43420056764426[/C][/ROW]
[ROW][C]16[/C][C]55.4[/C][C]67.8657994323557[/C][C]-12.4657994323557[/C][/ROW]
[ROW][C]17[/C][C]46.6[/C][C]60.9086565752129[/C][C]-14.3086565752129[/C][/ROW]
[ROW][C]18[/C][C]90.9[/C][C]86.0136825922422[/C][C]4.8863174077578[/C][/ROW]
[ROW][C]19[/C][C]84.9[/C][C]87.7565397350993[/C][C]-2.85653973509934[/C][/ROW]
[ROW][C]20[/C][C]89[/C][C]93.3993968779565[/C][C]-4.39939687795648[/C][/ROW]
[ROW][C]21[/C][C]90.2[/C][C]80.570825449385[/C][C]9.62917455061495[/C][/ROW]
[ROW][C]22[/C][C]72.3[/C][C]83.9279683065279[/C][C]-11.6279683065279[/C][/ROW]
[ROW][C]23[/C][C]83[/C][C]96.0993968779565[/C][C]-13.0993968779565[/C][/ROW]
[ROW][C]24[/C][C]71.6[/C][C]78.9422540208136[/C][C]-7.34225402081364[/C][/ROW]
[ROW][C]25[/C][C]75.4[/C][C]95.9936613055818[/C][C]-20.5936613055818[/C][/ROW]
[ROW][C]26[/C][C]85.1[/C][C]98.5211270104068[/C][C]-13.4211270104068[/C][/ROW]
[ROW][C]27[/C][C]81.2[/C][C]87.1925555818354[/C][C]-5.9925555818354[/C][/ROW]
[ROW][C]28[/C][C]68.7[/C][C]74.7925555818354[/C][C]-6.09255558183539[/C][/ROW]
[ROW][C]29[/C][C]68.4[/C][C]67.8354127246925[/C][C]0.564587275307474[/C][/ROW]
[ROW][C]30[/C][C]93.7[/C][C]92.9404387417219[/C][C]0.759561258278139[/C][/ROW]
[ROW][C]31[/C][C]96.6[/C][C]94.683295884579[/C][C]1.91670411542100[/C][/ROW]
[ROW][C]32[/C][C]101.8[/C][C]100.326153027436[/C][C]1.47384697256386[/C][/ROW]
[ROW][C]33[/C][C]93.6[/C][C]87.4975815988647[/C][C]6.10241840113529[/C][/ROW]
[ROW][C]34[/C][C]88.9[/C][C]90.8547244560076[/C][C]-1.95472445600756[/C][/ROW]
[ROW][C]35[/C][C]114.1[/C][C]103.026153027436[/C][C]11.0738469725638[/C][/ROW]
[ROW][C]36[/C][C]82.3[/C][C]85.8690101702933[/C][C]-3.56901017029329[/C][/ROW]
[ROW][C]37[/C][C]96.4[/C][C]102.920417455061[/C][C]-6.52041745506146[/C][/ROW]
[ROW][C]38[/C][C]104[/C][C]105.447883159886[/C][C]-1.44788315988646[/C][/ROW]
[ROW][C]39[/C][C]88.2[/C][C]94.119311731315[/C][C]-5.91931173131506[/C][/ROW]
[ROW][C]40[/C][C]85.2[/C][C]81.719311731315[/C][C]3.48068826868495[/C][/ROW]
[ROW][C]41[/C][C]87.1[/C][C]74.7621688741722[/C][C]12.3378311258278[/C][/ROW]
[ROW][C]42[/C][C]85.5[/C][C]99.8671948912015[/C][C]-14.3671948912015[/C][/ROW]
[ROW][C]43[/C][C]89.1[/C][C]101.610052034059[/C][C]-12.5100520340587[/C][/ROW]
[ROW][C]44[/C][C]105.2[/C][C]107.252909176916[/C][C]-2.0529091769158[/C][/ROW]
[ROW][C]45[/C][C]82.9[/C][C]94.4243377483444[/C][C]-11.5243377483444[/C][/ROW]
[ROW][C]46[/C][C]86.8[/C][C]97.7814806054872[/C][C]-10.9814806054872[/C][/ROW]
[ROW][C]47[/C][C]112[/C][C]109.952909176916[/C][C]2.0470908230842[/C][/ROW]
[ROW][C]48[/C][C]97.4[/C][C]92.795766319773[/C][C]4.60423368022707[/C][/ROW]
[ROW][C]49[/C][C]88.9[/C][C]109.847173604541[/C][C]-20.9471736045411[/C][/ROW]
[ROW][C]50[/C][C]109.4[/C][C]112.374639309366[/C][C]-2.97463930936611[/C][/ROW]
[ROW][C]51[/C][C]87.8[/C][C]101.046067880795[/C][C]-13.2460678807947[/C][/ROW]
[ROW][C]52[/C][C]90.5[/C][C]88.6460678807947[/C][C]1.85393211920530[/C][/ROW]
[ROW][C]53[/C][C]79.3[/C][C]81.6889250236518[/C][C]-2.38892502365185[/C][/ROW]
[ROW][C]54[/C][C]114.9[/C][C]106.793951040681[/C][C]8.10604895931882[/C][/ROW]
[ROW][C]55[/C][C]118.8[/C][C]108.536808183538[/C][C]10.2631918164617[/C][/ROW]
[ROW][C]56[/C][C]125[/C][C]114.179665326395[/C][C]10.8203346736045[/C][/ROW]
[ROW][C]57[/C][C]96.1[/C][C]101.351093897824[/C][C]-5.25109389782403[/C][/ROW]
[ROW][C]58[/C][C]116.7[/C][C]104.708236754967[/C][C]11.9917632450331[/C][/ROW]
[ROW][C]59[/C][C]119.5[/C][C]116.879665326395[/C][C]2.62033467360453[/C][/ROW]
[ROW][C]60[/C][C]104.1[/C][C]99.7225224692526[/C][C]4.37747753074739[/C][/ROW]
[ROW][C]61[/C][C]121[/C][C]116.773929754021[/C][C]4.22607024597922[/C][/ROW]
[ROW][C]62[/C][C]127.3[/C][C]119.301395458846[/C][C]7.99860454115422[/C][/ROW]
[ROW][C]63[/C][C]117.7[/C][C]107.972824030274[/C][C]9.72717596972563[/C][/ROW]
[ROW][C]64[/C][C]108[/C][C]95.5728240302744[/C][C]12.4271759697256[/C][/ROW]
[ROW][C]65[/C][C]89.4[/C][C]88.6156811731315[/C][C]0.784318826868499[/C][/ROW]
[ROW][C]66[/C][C]137.4[/C][C]133.785525070956[/C][C]3.61447492904446[/C][/ROW]
[ROW][C]67[/C][C]142[/C][C]135.528382213813[/C][C]6.47161778618732[/C][/ROW]
[ROW][C]68[/C][C]137.3[/C][C]141.171239356670[/C][C]-3.87123935666981[/C][/ROW]
[ROW][C]69[/C][C]122.8[/C][C]128.342667928098[/C][C]-5.5426679280984[/C][/ROW]
[ROW][C]70[/C][C]126.1[/C][C]131.699810785241[/C][C]-5.59981078524125[/C][/ROW]
[ROW][C]71[/C][C]147.6[/C][C]143.871239356670[/C][C]3.72876064333017[/C][/ROW]
[ROW][C]72[/C][C]115.7[/C][C]126.714096499527[/C][C]-11.0140964995270[/C][/ROW]
[ROW][C]73[/C][C]139.2[/C][C]143.765503784295[/C][C]-4.56550378429516[/C][/ROW]
[ROW][C]74[/C][C]151.2[/C][C]146.29296948912[/C][C]4.90703051087985[/C][/ROW]
[ROW][C]75[/C][C]123.8[/C][C]134.964398060549[/C][C]-11.1643980605487[/C][/ROW]
[ROW][C]76[/C][C]109[/C][C]122.564398060549[/C][C]-13.5643980605487[/C][/ROW]
[ROW][C]77[/C][C]112.1[/C][C]115.607255203406[/C][C]-3.50725520340587[/C][/ROW]
[ROW][C]78[/C][C]136.4[/C][C]140.712281220435[/C][C]-4.31228122043519[/C][/ROW]
[ROW][C]79[/C][C]135.5[/C][C]142.455138363292[/C][C]-6.95513836329234[/C][/ROW]
[ROW][C]80[/C][C]138.7[/C][C]148.097995506149[/C][C]-9.3979955061495[/C][/ROW]
[ROW][C]81[/C][C]137.5[/C][C]135.269424077578[/C][C]2.23057592242195[/C][/ROW]
[ROW][C]82[/C][C]141.5[/C][C]138.626566934721[/C][C]2.87343306527910[/C][/ROW]
[ROW][C]83[/C][C]143.6[/C][C]150.797995506149[/C][C]-7.19799550614948[/C][/ROW]
[ROW][C]84[/C][C]146.5[/C][C]133.640852649007[/C][C]12.8591473509934[/C][/ROW]
[ROW][C]85[/C][C]200.7[/C][C]150.692259933775[/C][C]50.0077400662252[/C][/ROW]
[/TABLE]
Source: https://freestatistics.org/blog/index.php?pk=25807&T=4

Globally Unique Identifier (entire table): ba.freestatistics.org/blog/index.php?pk=25807&T=4

As an alternative you can also use a QR Code:  

The GUIDs for individual cells are displayed in the table below:

Multiple Linear Regression - Actuals, Interpolation, and Residuals
Time or IndexActualsInterpolationForecastResidualsPrediction Error
192.782.140149006622610.5598509933774
2105.284.667614711447520.5323852885525
391.573.33904328287618.1609567171240
475.360.939043282876114.3609567171239
560.553.98190042573326.5180995742668
680.479.08692644276251.31307355723751
784.580.82978358561973.67021641438035
893.986.47264072847687.42735927152319
97873.64406929990544.35593070009461
1092.377.001212157048315.2987878429517
119089.17264072847680.8273592715232
1272.172.0154978713340.0845021286660279
1376.989.0669051561022-12.1669051561022
147691.5943708609271-15.5943708609271
1588.780.26579943235578.43420056764426
1655.467.8657994323557-12.4657994323557
1746.660.9086565752129-14.3086565752129
1890.986.01368259224224.8863174077578
1984.987.7565397350993-2.85653973509934
208993.3993968779565-4.39939687795648
2190.280.5708254493859.62917455061495
2272.383.9279683065279-11.6279683065279
238396.0993968779565-13.0993968779565
2471.678.9422540208136-7.34225402081364
2575.495.9936613055818-20.5936613055818
2685.198.5211270104068-13.4211270104068
2781.287.1925555818354-5.9925555818354
2868.774.7925555818354-6.09255558183539
2968.467.83541272469250.564587275307474
3093.792.94043874172190.759561258278139
3196.694.6832958845791.91670411542100
32101.8100.3261530274361.47384697256386
3393.687.49758159886476.10241840113529
3488.990.8547244560076-1.95472445600756
35114.1103.02615302743611.0738469725638
3682.385.8690101702933-3.56901017029329
3796.4102.920417455061-6.52041745506146
38104105.447883159886-1.44788315988646
3988.294.119311731315-5.91931173131506
4085.281.7193117313153.48068826868495
4187.174.762168874172212.3378311258278
4285.599.8671948912015-14.3671948912015
4389.1101.610052034059-12.5100520340587
44105.2107.252909176916-2.0529091769158
4582.994.4243377483444-11.5243377483444
4686.897.7814806054872-10.9814806054872
47112109.9529091769162.0470908230842
4897.492.7957663197734.60423368022707
4988.9109.847173604541-20.9471736045411
50109.4112.374639309366-2.97463930936611
5187.8101.046067880795-13.2460678807947
5290.588.64606788079471.85393211920530
5379.381.6889250236518-2.38892502365185
54114.9106.7939510406818.10604895931882
55118.8108.53680818353810.2631918164617
56125114.17966532639510.8203346736045
5796.1101.351093897824-5.25109389782403
58116.7104.70823675496711.9917632450331
59119.5116.8796653263952.62033467360453
60104.199.72252246925264.37747753074739
61121116.7739297540214.22607024597922
62127.3119.3013954588467.99860454115422
63117.7107.9728240302749.72717596972563
6410895.572824030274412.4271759697256
6589.488.61568117313150.784318826868499
66137.4133.7855250709563.61447492904446
67142135.5283822138136.47161778618732
68137.3141.171239356670-3.87123935666981
69122.8128.342667928098-5.5426679280984
70126.1131.699810785241-5.59981078524125
71147.6143.8712393566703.72876064333017
72115.7126.714096499527-11.0140964995270
73139.2143.765503784295-4.56550378429516
74151.2146.292969489124.90703051087985
75123.8134.964398060549-11.1643980605487
76109122.564398060549-13.5643980605487
77112.1115.607255203406-3.50725520340587
78136.4140.712281220435-4.31228122043519
79135.5142.455138363292-6.95513836329234
80138.7148.097995506149-9.3979955061495
81137.5135.2694240775782.23057592242195
82141.5138.6265669347212.87343306527910
83143.6150.797995506149-7.19799550614948
84146.5133.64085264900712.8591473509934
85200.7150.69225993377550.0077400662252


Parameters (Session):
par1 = 1 ; par2 = Include Monthly Dummies ; par3 = Linear Trend ;
Parameters (R input):
par1 = 1 ; par2 = Include Monthly Dummies ; par3 = Linear Trend ;
R code (references can be found in the software module):
library(lattice)
par1 <- as.numeric(par1)
x <- t(y)
k <- length(x[1,])
n <- length(x[,1])
x1 <- cbind(x[,par1], x[,1:k!=par1])
mycolnames <- c(colnames(x)[par1], colnames(x)[1:k!=par1])
colnames(x1) <- mycolnames #colnames(x)[par1]
x <- x1
if (par3 == 'First Differences'){
x2 <- array(0, dim=c(n-1,k), dimnames=list(1:(n-1), paste('(1-B)',colnames(x),sep='')))
for (i in 1:n-1) {
for (j in 1:k) {
x2[i,j] <- x[i+1,j] - x[i,j]
}
}
x <- x2
}
if (par2 == 'Include Monthly Dummies'){
x2 <- array(0, dim=c(n,11), dimnames=list(1:n, paste('M', seq(1:11), sep ='')))
for (i in 1:11){
x2[seq(i,n,12),i] <- 1
}
x <- cbind(x, x2)
}
if (par2 == 'Include Quarterly Dummies'){
x2 <- array(0, dim=c(n,3), dimnames=list(1:n, paste('Q', seq(1:3), sep ='')))
for (i in 1:3){
x2[seq(i,n,4),i] <- 1
}
x <- cbind(x, x2)
}
k <- length(x[1,])
if (par3 == 'Linear Trend'){
x <- cbind(x, c(1:n))
colnames(x)[k+1] <- 't'
}
x
k <- length(x[1,])
df <- as.data.frame(x)
(mylm <- lm(df))
(mysum <- summary(mylm))
bitmap(file='test0.png')
plot(x[,1], type='l', main='Actuals and Interpolation', ylab='value of Actuals and Interpolation (dots)', xlab='time or index')
points(x[,1]-mysum$resid)
grid()
dev.off()
bitmap(file='test1.png')
plot(mysum$resid, type='b', pch=19, main='Residuals', ylab='value of Residuals', xlab='time or index')
grid()
dev.off()
bitmap(file='test2.png')
hist(mysum$resid, main='Residual Histogram', xlab='values of Residuals')
grid()
dev.off()
bitmap(file='test3.png')
densityplot(~mysum$resid,col='black',main='Residual Density Plot', xlab='values of Residuals')
dev.off()
bitmap(file='test4.png')
qqnorm(mysum$resid, main='Residual Normal Q-Q Plot')
grid()
dev.off()
(myerror <- as.ts(mysum$resid))
bitmap(file='test5.png')
dum <- cbind(lag(myerror,k=1),myerror)
dum
dum1 <- dum[2:length(myerror),]
dum1
z <- as.data.frame(dum1)
z
plot(z,main=paste('Residual Lag plot, lowess, and regression line'), ylab='values of Residuals', xlab='lagged values of Residuals')
lines(lowess(z))
abline(lm(z))
grid()
dev.off()
bitmap(file='test6.png')
acf(mysum$resid, lag.max=length(mysum$resid)/2, main='Residual Autocorrelation Function')
grid()
dev.off()
bitmap(file='test7.png')
pacf(mysum$resid, lag.max=length(mysum$resid)/2, main='Residual Partial Autocorrelation Function')
grid()
dev.off()
bitmap(file='test8.png')
opar <- par(mfrow = c(2,2), oma = c(0, 0, 1.1, 0))
plot(mylm, las = 1, sub='Residual Diagnostics')
par(opar)
dev.off()
load(file='createtable')
a<-table.start()
a<-table.row.start(a)
a<-table.element(a, 'Multiple Linear Regression - Estimated Regression Equation', 1, TRUE)
a<-table.row.end(a)
myeq <- colnames(x)[1]
myeq <- paste(myeq, '[t] = ', sep='')
for (i in 1:k){
if (mysum$coefficients[i,1] > 0) myeq <- paste(myeq, '+', '')
myeq <- paste(myeq, mysum$coefficients[i,1], sep=' ')
if (rownames(mysum$coefficients)[i] != '(Intercept)') {
myeq <- paste(myeq, rownames(mysum$coefficients)[i], sep='')
if (rownames(mysum$coefficients)[i] != 't') myeq <- paste(myeq, '[t]', sep='')
}
}
myeq <- paste(myeq, ' + e[t]')
a<-table.row.start(a)
a<-table.element(a, myeq)
a<-table.row.end(a)
a<-table.end(a)
table.save(a,file='mytable1.tab')
a<-table.start()
a<-table.row.start(a)
a<-table.element(a,hyperlink('ols1.htm','Multiple Linear Regression - Ordinary Least Squares',''), 6, TRUE)
a<-table.row.end(a)
a<-table.row.start(a)
a<-table.element(a,'Variable',header=TRUE)
a<-table.element(a,'Parameter',header=TRUE)
a<-table.element(a,'S.D.',header=TRUE)
a<-table.element(a,'T-STAT
H0: parameter = 0',header=TRUE)
a<-table.element(a,'2-tail p-value',header=TRUE)
a<-table.element(a,'1-tail p-value',header=TRUE)
a<-table.row.end(a)
for (i in 1:k){
a<-table.row.start(a)
a<-table.element(a,rownames(mysum$coefficients)[i],header=TRUE)
a<-table.element(a,mysum$coefficients[i,1])
a<-table.element(a, round(mysum$coefficients[i,2],6))
a<-table.element(a, round(mysum$coefficients[i,3],4))
a<-table.element(a, round(mysum$coefficients[i,4],6))
a<-table.element(a, round(mysum$coefficients[i,4]/2,6))
a<-table.row.end(a)
}
a<-table.end(a)
table.save(a,file='mytable2.tab')
a<-table.start()
a<-table.row.start(a)
a<-table.element(a, 'Multiple Linear Regression - Regression Statistics', 2, TRUE)
a<-table.row.end(a)
a<-table.row.start(a)
a<-table.element(a, 'Multiple R',1,TRUE)
a<-table.element(a, sqrt(mysum$r.squared))
a<-table.row.end(a)
a<-table.row.start(a)
a<-table.element(a, 'R-squared',1,TRUE)
a<-table.element(a, mysum$r.squared)
a<-table.row.end(a)
a<-table.row.start(a)
a<-table.element(a, 'Adjusted R-squared',1,TRUE)
a<-table.element(a, mysum$adj.r.squared)
a<-table.row.end(a)
a<-table.row.start(a)
a<-table.element(a, 'F-TEST (value)',1,TRUE)
a<-table.element(a, mysum$fstatistic[1])
a<-table.row.end(a)
a<-table.row.start(a)
a<-table.element(a, 'F-TEST (DF numerator)',1,TRUE)
a<-table.element(a, mysum$fstatistic[2])
a<-table.row.end(a)
a<-table.row.start(a)
a<-table.element(a, 'F-TEST (DF denominator)',1,TRUE)
a<-table.element(a, mysum$fstatistic[3])
a<-table.row.end(a)
a<-table.row.start(a)
a<-table.element(a, 'p-value',1,TRUE)
a<-table.element(a, 1-pf(mysum$fstatistic[1],mysum$fstatistic[2],mysum$fstatistic[3]))
a<-table.row.end(a)
a<-table.row.start(a)
a<-table.element(a, 'Multiple Linear Regression - Residual Statistics', 2, TRUE)
a<-table.row.end(a)
a<-table.row.start(a)
a<-table.element(a, 'Residual Standard Deviation',1,TRUE)
a<-table.element(a, mysum$sigma)
a<-table.row.end(a)
a<-table.row.start(a)
a<-table.element(a, 'Sum Squared Residuals',1,TRUE)
a<-table.element(a, sum(myerror*myerror))
a<-table.row.end(a)
a<-table.end(a)
table.save(a,file='mytable3.tab')
a<-table.start()
a<-table.row.start(a)
a<-table.element(a, 'Multiple Linear Regression - Actuals, Interpolation, and Residuals', 4, TRUE)
a<-table.row.end(a)
a<-table.row.start(a)
a<-table.element(a, 'Time or Index', 1, TRUE)
a<-table.element(a, 'Actuals', 1, TRUE)
a<-table.element(a, 'Interpolation
Forecast', 1, TRUE)
a<-table.element(a, 'Residuals
Prediction Error', 1, TRUE)
a<-table.row.end(a)
for (i in 1:n) {
a<-table.row.start(a)
a<-table.element(a,i, 1, TRUE)
a<-table.element(a,x[i])
a<-table.element(a,x[i]-mysum$resid[i])
a<-table.element(a,mysum$resid[i])
a<-table.row.end(a)
}
a<-table.end(a)
table.save(a,file='mytable4.tab')