Free Statistics

of Irreproducible Research!

Author's title

Author*The author of this computation has been verified*
R Software Modulerwasp_autocorrelation.wasp
Title produced by software(Partial) Autocorrelation Function
Date of computationWed, 26 Nov 2008 10:19:13 -0700
Cite this page as followsStatistical Computations at FreeStatistics.org, Office for Research Development and Education, URL https://freestatistics.org/blog/index.php?v=date/2008/Nov/26/t122772003786buvwwnfifchau.htm/, Retrieved Tue, 14 May 2024 19:35:54 +0000
Statistical Computations at FreeStatistics.org, Office for Research Development and Education, URL https://freestatistics.org/blog/index.php?pk=25669, Retrieved Tue, 14 May 2024 19:35:54 +0000
QR Codes:

Original text written by user:
IsPrivate?No (this computation is public)
User-defined keywords
Estimated Impact223
Family? (F = Feedback message, R = changed R code, M = changed R Module, P = changed Parameters, D = changed Data)
F     [Univariate Data Series] [Airline data] [2007-10-18 09:58:47] [42daae401fd3def69a25014f2252b4c2]
- RMPD  [(Partial) Autocorrelation Function] [Q6 ACF met trend ...] [2008-11-26 16:23:41] [6fea0e9a9b3b29a63badf2c274e82506]
F           [(Partial) Autocorrelation Function] [Q6 ACF zonder tre...] [2008-11-26 17:19:13] [286e96bd53289970f8e5f25a93fb50b3] [Current]
Feedback Forum
2008-12-07 11:59:44 [Kevin Neelen] [reply
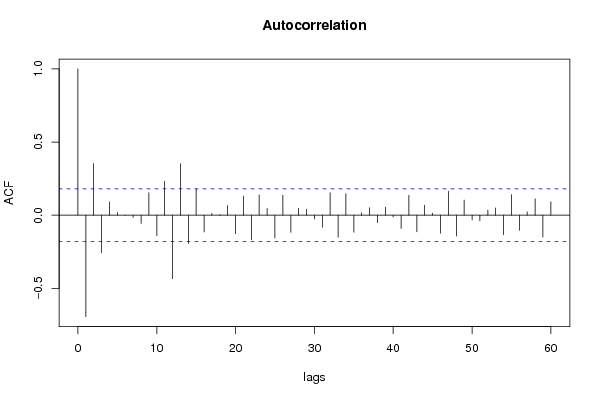
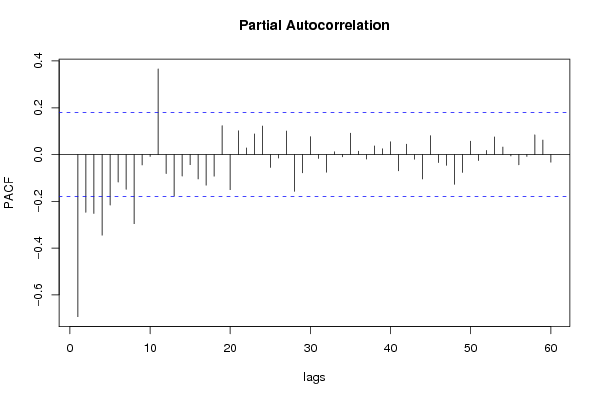
Hier hebben we het aantal lags ingesteld op 60, seasonality op 12, d op 2 en D op 2.
Tot slot hebben we zowel lange termijndifferentiatie als seizoensdifferentiatie verder doorgedreven.
Het spreekt voor zich dat er, op basis van de vorige 2 modellen, ook bij dit model een hoger aantal correlatiewaarden optreedt dat buiten het 95%-betrouwbaarheidsinterval valt dan bij het model waarbij d = 1 en D = 1, aangezien beide differentiaties te ver zijn doorgedreven.

Post a new message
Dataseries X:
112
118
132
129
121
135
148
148
136
119
104
118
115
126
141
135
125
149
170
170
158
133
114
140
145
150
178
163
172
178
199
199
184
162
146
166
171
180
193
181
183
218
230
242
209
191
172
194
196
196
236
235
229
243
264
272
237
211
180
201
204
188
235
227
234
264
302
293
259
229
203
229
242
233
267
269
270
315
364
347
312
274
237
278
284
277
317
313
318
374
413
405
355
306
271
306
315
301
356
348
355
422
465
467
404
347
305
336
340
318
362
348
363
435
491
505
404
359
310
337
360
342
406
396
420
472
548
559
463
407
362
405
417
391
419
461
472
535
622
606
508
461
390
432


Summary of computational transaction
Raw Inputview raw input (R code)
Raw Outputview raw output of R engine
Computing time2 seconds
R Server'Herman Ole Andreas Wold' @ 193.190.124.10:1001

\begin{tabular}{lllllllll}
\hline
Summary of computational transaction \tabularnewline
Raw Input & view raw input (R code)  \tabularnewline
Raw Output & view raw output of R engine  \tabularnewline
Computing time & 2 seconds \tabularnewline
R Server & 'Herman Ole Andreas Wold' @ 193.190.124.10:1001 \tabularnewline
\hline
\end{tabular}
%Source: https://freestatistics.org/blog/index.php?pk=25669&T=0

[TABLE]
[ROW][C]Summary of computational transaction[/C][/ROW]
[ROW][C]Raw Input[/C][C]view raw input (R code) [/C][/ROW]
[ROW][C]Raw Output[/C][C]view raw output of R engine [/C][/ROW]
[ROW][C]Computing time[/C][C]2 seconds[/C][/ROW]
[ROW][C]R Server[/C][C]'Herman Ole Andreas Wold' @ 193.190.124.10:1001[/C][/ROW]
[/TABLE]
Source: https://freestatistics.org/blog/index.php?pk=25669&T=0

Globally Unique Identifier (entire table): ba.freestatistics.org/blog/index.php?pk=25669&T=0

As an alternative you can also use a QR Code:  

The GUIDs for individual cells are displayed in the table below:

Summary of computational transaction
Raw Inputview raw input (R code)
Raw Outputview raw output of R engine
Computing time2 seconds
R Server'Herman Ole Andreas Wold' @ 193.190.124.10:1001


Autocorrelation Function
Time lag kACF(k)T-STATP-value
1-0.693391-7.53220
20.3523333.82730.000104
3-0.256013-2.7810.003155
40.0906680.98490.163342
50.0191160.20770.417929
6-0.001902-0.02070.491775
7-0.013914-0.15110.440058
8-0.056368-0.61230.270755
90.1544941.67820.047974
10-0.140137-1.52230.065308
110.2323282.52370.006471
12-0.433541-4.70953e-06
130.3519553.82320.000106
14-0.193485-2.10180.01885
150.1803831.95950.026208
16-0.114456-1.24330.10811
170.012250.13310.447181
180.0049860.05420.478447
190.0669940.72770.234106
20-0.126358-1.37260.08624
210.1308251.42110.078959
22-0.16779-1.82270.035443
230.1382641.50190.067893
240.0460470.50020.308933
25-0.155206-1.6860.047222
260.1367231.48520.070081
27-0.116561-1.26620.103972
280.0472270.5130.30445
290.0413550.44920.327044
30-0.025504-0.2770.391114
31-0.082166-0.89260.186957
320.1537531.67020.048766
33-0.151388-1.64450.051367
340.1470331.59720.05645
35-0.116142-1.26160.104786
360.0168190.18270.427673
370.051110.55520.289906
38-0.05147-0.55910.288576
390.0548510.59580.276212
40-0.011387-0.12370.450885
41-0.090074-0.97850.164925
420.136281.48040.070718
43-0.113327-1.2310.110378
440.0683220.74220.22973
450.0141060.15320.439239
46-0.122674-1.33260.092619
470.1633161.77410.039315
48-0.142523-1.54820.062127
490.1038091.12770.130876
50-0.031538-0.34260.366258
51-0.037494-0.40730.342265
520.0350350.38060.3521
530.0501820.54510.293351
54-0.133214-1.44710.075263
550.1405271.52650.064778
56-0.103251-1.12160.132157
570.0230960.25090.401171
580.1120261.21690.113033
59-0.149601-1.62510.053407
600.0929241.00940.157421

\begin{tabular}{lllllllll}
\hline
Autocorrelation Function \tabularnewline
Time lag k & ACF(k) & T-STAT & P-value \tabularnewline
1 & -0.693391 & -7.5322 & 0 \tabularnewline
2 & 0.352333 & 3.8273 & 0.000104 \tabularnewline
3 & -0.256013 & -2.781 & 0.003155 \tabularnewline
4 & 0.090668 & 0.9849 & 0.163342 \tabularnewline
5 & 0.019116 & 0.2077 & 0.417929 \tabularnewline
6 & -0.001902 & -0.0207 & 0.491775 \tabularnewline
7 & -0.013914 & -0.1511 & 0.440058 \tabularnewline
8 & -0.056368 & -0.6123 & 0.270755 \tabularnewline
9 & 0.154494 & 1.6782 & 0.047974 \tabularnewline
10 & -0.140137 & -1.5223 & 0.065308 \tabularnewline
11 & 0.232328 & 2.5237 & 0.006471 \tabularnewline
12 & -0.433541 & -4.7095 & 3e-06 \tabularnewline
13 & 0.351955 & 3.8232 & 0.000106 \tabularnewline
14 & -0.193485 & -2.1018 & 0.01885 \tabularnewline
15 & 0.180383 & 1.9595 & 0.026208 \tabularnewline
16 & -0.114456 & -1.2433 & 0.10811 \tabularnewline
17 & 0.01225 & 0.1331 & 0.447181 \tabularnewline
18 & 0.004986 & 0.0542 & 0.478447 \tabularnewline
19 & 0.066994 & 0.7277 & 0.234106 \tabularnewline
20 & -0.126358 & -1.3726 & 0.08624 \tabularnewline
21 & 0.130825 & 1.4211 & 0.078959 \tabularnewline
22 & -0.16779 & -1.8227 & 0.035443 \tabularnewline
23 & 0.138264 & 1.5019 & 0.067893 \tabularnewline
24 & 0.046047 & 0.5002 & 0.308933 \tabularnewline
25 & -0.155206 & -1.686 & 0.047222 \tabularnewline
26 & 0.136723 & 1.4852 & 0.070081 \tabularnewline
27 & -0.116561 & -1.2662 & 0.103972 \tabularnewline
28 & 0.047227 & 0.513 & 0.30445 \tabularnewline
29 & 0.041355 & 0.4492 & 0.327044 \tabularnewline
30 & -0.025504 & -0.277 & 0.391114 \tabularnewline
31 & -0.082166 & -0.8926 & 0.186957 \tabularnewline
32 & 0.153753 & 1.6702 & 0.048766 \tabularnewline
33 & -0.151388 & -1.6445 & 0.051367 \tabularnewline
34 & 0.147033 & 1.5972 & 0.05645 \tabularnewline
35 & -0.116142 & -1.2616 & 0.104786 \tabularnewline
36 & 0.016819 & 0.1827 & 0.427673 \tabularnewline
37 & 0.05111 & 0.5552 & 0.289906 \tabularnewline
38 & -0.05147 & -0.5591 & 0.288576 \tabularnewline
39 & 0.054851 & 0.5958 & 0.276212 \tabularnewline
40 & -0.011387 & -0.1237 & 0.450885 \tabularnewline
41 & -0.090074 & -0.9785 & 0.164925 \tabularnewline
42 & 0.13628 & 1.4804 & 0.070718 \tabularnewline
43 & -0.113327 & -1.231 & 0.110378 \tabularnewline
44 & 0.068322 & 0.7422 & 0.22973 \tabularnewline
45 & 0.014106 & 0.1532 & 0.439239 \tabularnewline
46 & -0.122674 & -1.3326 & 0.092619 \tabularnewline
47 & 0.163316 & 1.7741 & 0.039315 \tabularnewline
48 & -0.142523 & -1.5482 & 0.062127 \tabularnewline
49 & 0.103809 & 1.1277 & 0.130876 \tabularnewline
50 & -0.031538 & -0.3426 & 0.366258 \tabularnewline
51 & -0.037494 & -0.4073 & 0.342265 \tabularnewline
52 & 0.035035 & 0.3806 & 0.3521 \tabularnewline
53 & 0.050182 & 0.5451 & 0.293351 \tabularnewline
54 & -0.133214 & -1.4471 & 0.075263 \tabularnewline
55 & 0.140527 & 1.5265 & 0.064778 \tabularnewline
56 & -0.103251 & -1.1216 & 0.132157 \tabularnewline
57 & 0.023096 & 0.2509 & 0.401171 \tabularnewline
58 & 0.112026 & 1.2169 & 0.113033 \tabularnewline
59 & -0.149601 & -1.6251 & 0.053407 \tabularnewline
60 & 0.092924 & 1.0094 & 0.157421 \tabularnewline
\hline
\end{tabular}
%Source: https://freestatistics.org/blog/index.php?pk=25669&T=1

[TABLE]
[ROW][C]Autocorrelation Function[/C][/ROW]
[ROW][C]Time lag k[/C][C]ACF(k)[/C][C]T-STAT[/C][C]P-value[/C][/ROW]
[ROW][C]1[/C][C]-0.693391[/C][C]-7.5322[/C][C]0[/C][/ROW]
[ROW][C]2[/C][C]0.352333[/C][C]3.8273[/C][C]0.000104[/C][/ROW]
[ROW][C]3[/C][C]-0.256013[/C][C]-2.781[/C][C]0.003155[/C][/ROW]
[ROW][C]4[/C][C]0.090668[/C][C]0.9849[/C][C]0.163342[/C][/ROW]
[ROW][C]5[/C][C]0.019116[/C][C]0.2077[/C][C]0.417929[/C][/ROW]
[ROW][C]6[/C][C]-0.001902[/C][C]-0.0207[/C][C]0.491775[/C][/ROW]
[ROW][C]7[/C][C]-0.013914[/C][C]-0.1511[/C][C]0.440058[/C][/ROW]
[ROW][C]8[/C][C]-0.056368[/C][C]-0.6123[/C][C]0.270755[/C][/ROW]
[ROW][C]9[/C][C]0.154494[/C][C]1.6782[/C][C]0.047974[/C][/ROW]
[ROW][C]10[/C][C]-0.140137[/C][C]-1.5223[/C][C]0.065308[/C][/ROW]
[ROW][C]11[/C][C]0.232328[/C][C]2.5237[/C][C]0.006471[/C][/ROW]
[ROW][C]12[/C][C]-0.433541[/C][C]-4.7095[/C][C]3e-06[/C][/ROW]
[ROW][C]13[/C][C]0.351955[/C][C]3.8232[/C][C]0.000106[/C][/ROW]
[ROW][C]14[/C][C]-0.193485[/C][C]-2.1018[/C][C]0.01885[/C][/ROW]
[ROW][C]15[/C][C]0.180383[/C][C]1.9595[/C][C]0.026208[/C][/ROW]
[ROW][C]16[/C][C]-0.114456[/C][C]-1.2433[/C][C]0.10811[/C][/ROW]
[ROW][C]17[/C][C]0.01225[/C][C]0.1331[/C][C]0.447181[/C][/ROW]
[ROW][C]18[/C][C]0.004986[/C][C]0.0542[/C][C]0.478447[/C][/ROW]
[ROW][C]19[/C][C]0.066994[/C][C]0.7277[/C][C]0.234106[/C][/ROW]
[ROW][C]20[/C][C]-0.126358[/C][C]-1.3726[/C][C]0.08624[/C][/ROW]
[ROW][C]21[/C][C]0.130825[/C][C]1.4211[/C][C]0.078959[/C][/ROW]
[ROW][C]22[/C][C]-0.16779[/C][C]-1.8227[/C][C]0.035443[/C][/ROW]
[ROW][C]23[/C][C]0.138264[/C][C]1.5019[/C][C]0.067893[/C][/ROW]
[ROW][C]24[/C][C]0.046047[/C][C]0.5002[/C][C]0.308933[/C][/ROW]
[ROW][C]25[/C][C]-0.155206[/C][C]-1.686[/C][C]0.047222[/C][/ROW]
[ROW][C]26[/C][C]0.136723[/C][C]1.4852[/C][C]0.070081[/C][/ROW]
[ROW][C]27[/C][C]-0.116561[/C][C]-1.2662[/C][C]0.103972[/C][/ROW]
[ROW][C]28[/C][C]0.047227[/C][C]0.513[/C][C]0.30445[/C][/ROW]
[ROW][C]29[/C][C]0.041355[/C][C]0.4492[/C][C]0.327044[/C][/ROW]
[ROW][C]30[/C][C]-0.025504[/C][C]-0.277[/C][C]0.391114[/C][/ROW]
[ROW][C]31[/C][C]-0.082166[/C][C]-0.8926[/C][C]0.186957[/C][/ROW]
[ROW][C]32[/C][C]0.153753[/C][C]1.6702[/C][C]0.048766[/C][/ROW]
[ROW][C]33[/C][C]-0.151388[/C][C]-1.6445[/C][C]0.051367[/C][/ROW]
[ROW][C]34[/C][C]0.147033[/C][C]1.5972[/C][C]0.05645[/C][/ROW]
[ROW][C]35[/C][C]-0.116142[/C][C]-1.2616[/C][C]0.104786[/C][/ROW]
[ROW][C]36[/C][C]0.016819[/C][C]0.1827[/C][C]0.427673[/C][/ROW]
[ROW][C]37[/C][C]0.05111[/C][C]0.5552[/C][C]0.289906[/C][/ROW]
[ROW][C]38[/C][C]-0.05147[/C][C]-0.5591[/C][C]0.288576[/C][/ROW]
[ROW][C]39[/C][C]0.054851[/C][C]0.5958[/C][C]0.276212[/C][/ROW]
[ROW][C]40[/C][C]-0.011387[/C][C]-0.1237[/C][C]0.450885[/C][/ROW]
[ROW][C]41[/C][C]-0.090074[/C][C]-0.9785[/C][C]0.164925[/C][/ROW]
[ROW][C]42[/C][C]0.13628[/C][C]1.4804[/C][C]0.070718[/C][/ROW]
[ROW][C]43[/C][C]-0.113327[/C][C]-1.231[/C][C]0.110378[/C][/ROW]
[ROW][C]44[/C][C]0.068322[/C][C]0.7422[/C][C]0.22973[/C][/ROW]
[ROW][C]45[/C][C]0.014106[/C][C]0.1532[/C][C]0.439239[/C][/ROW]
[ROW][C]46[/C][C]-0.122674[/C][C]-1.3326[/C][C]0.092619[/C][/ROW]
[ROW][C]47[/C][C]0.163316[/C][C]1.7741[/C][C]0.039315[/C][/ROW]
[ROW][C]48[/C][C]-0.142523[/C][C]-1.5482[/C][C]0.062127[/C][/ROW]
[ROW][C]49[/C][C]0.103809[/C][C]1.1277[/C][C]0.130876[/C][/ROW]
[ROW][C]50[/C][C]-0.031538[/C][C]-0.3426[/C][C]0.366258[/C][/ROW]
[ROW][C]51[/C][C]-0.037494[/C][C]-0.4073[/C][C]0.342265[/C][/ROW]
[ROW][C]52[/C][C]0.035035[/C][C]0.3806[/C][C]0.3521[/C][/ROW]
[ROW][C]53[/C][C]0.050182[/C][C]0.5451[/C][C]0.293351[/C][/ROW]
[ROW][C]54[/C][C]-0.133214[/C][C]-1.4471[/C][C]0.075263[/C][/ROW]
[ROW][C]55[/C][C]0.140527[/C][C]1.5265[/C][C]0.064778[/C][/ROW]
[ROW][C]56[/C][C]-0.103251[/C][C]-1.1216[/C][C]0.132157[/C][/ROW]
[ROW][C]57[/C][C]0.023096[/C][C]0.2509[/C][C]0.401171[/C][/ROW]
[ROW][C]58[/C][C]0.112026[/C][C]1.2169[/C][C]0.113033[/C][/ROW]
[ROW][C]59[/C][C]-0.149601[/C][C]-1.6251[/C][C]0.053407[/C][/ROW]
[ROW][C]60[/C][C]0.092924[/C][C]1.0094[/C][C]0.157421[/C][/ROW]
[/TABLE]
Source: https://freestatistics.org/blog/index.php?pk=25669&T=1

Globally Unique Identifier (entire table): ba.freestatistics.org/blog/index.php?pk=25669&T=1

As an alternative you can also use a QR Code:  

The GUIDs for individual cells are displayed in the table below:

Autocorrelation Function
Time lag kACF(k)T-STATP-value
1-0.693391-7.53220
20.3523333.82730.000104
3-0.256013-2.7810.003155
40.0906680.98490.163342
50.0191160.20770.417929
6-0.001902-0.02070.491775
7-0.013914-0.15110.440058
8-0.056368-0.61230.270755
90.1544941.67820.047974
10-0.140137-1.52230.065308
110.2323282.52370.006471
12-0.433541-4.70953e-06
130.3519553.82320.000106
14-0.193485-2.10180.01885
150.1803831.95950.026208
16-0.114456-1.24330.10811
170.012250.13310.447181
180.0049860.05420.478447
190.0669940.72770.234106
20-0.126358-1.37260.08624
210.1308251.42110.078959
22-0.16779-1.82270.035443
230.1382641.50190.067893
240.0460470.50020.308933
25-0.155206-1.6860.047222
260.1367231.48520.070081
27-0.116561-1.26620.103972
280.0472270.5130.30445
290.0413550.44920.327044
30-0.025504-0.2770.391114
31-0.082166-0.89260.186957
320.1537531.67020.048766
33-0.151388-1.64450.051367
340.1470331.59720.05645
35-0.116142-1.26160.104786
360.0168190.18270.427673
370.051110.55520.289906
38-0.05147-0.55910.288576
390.0548510.59580.276212
40-0.011387-0.12370.450885
41-0.090074-0.97850.164925
420.136281.48040.070718
43-0.113327-1.2310.110378
440.0683220.74220.22973
450.0141060.15320.439239
46-0.122674-1.33260.092619
470.1633161.77410.039315
48-0.142523-1.54820.062127
490.1038091.12770.130876
50-0.031538-0.34260.366258
51-0.037494-0.40730.342265
520.0350350.38060.3521
530.0501820.54510.293351
54-0.133214-1.44710.075263
550.1405271.52650.064778
56-0.103251-1.12160.132157
570.0230960.25090.401171
580.1120261.21690.113033
59-0.149601-1.62510.053407
600.0929241.00940.157421


Partial Autocorrelation Function
Time lag kPACF(k)T-STATP-value
1-0.693391-7.53220
2-0.247413-2.68760.004119
3-0.251974-2.73710.003579
4-0.345001-3.74770.000139
5-0.216072-2.34710.010292
6-0.117969-1.28150.10127
7-0.148762-1.6160.054386
8-0.296022-3.21560.00084
9-0.044448-0.48280.315057
10-0.008079-0.08780.465109
110.3659793.97556.1e-05
12-0.081622-0.88660.188537
13-0.177596-1.92920.028055
14-0.091894-0.99820.160105
15-0.043252-0.46980.319668
16-0.104268-1.13260.12983
17-0.131233-1.42560.078319
18-0.092907-1.00920.157464
190.1231211.33740.091825
20-0.150195-1.63150.052721
210.1011911.09920.136957
220.0279190.30330.381104
230.0882150.95830.169944
240.1219221.32440.093963
25-0.055363-0.60140.274363
26-0.015146-0.16450.4348
270.1002621.08910.139159
28-0.157384-1.70960.044981
29-0.078079-0.84820.199035
300.0764160.83010.204081
31-0.016503-0.17930.429019
32-0.075551-0.82070.206738
330.0118460.12870.448914
34-0.009868-0.10720.457409
350.0912460.99120.161812
360.0143330.15570.438269
37-0.01948-0.21160.416388
380.0365670.39720.345963
390.0246410.26770.39471
400.0545030.59210.277472
41-0.069448-0.75440.226057
420.0442720.48090.315734
43-0.019823-0.21530.414941
44-0.104628-1.13660.129014
450.0805380.87490.191712
46-0.034359-0.37320.354823
47-0.046133-0.50110.308607
48-0.127661-1.38680.084066
49-0.076474-0.83070.203905
500.0568460.61750.269047
51-0.025596-0.2780.390732
520.0174850.18990.424843
530.0750950.81570.208147
540.0317250.34460.365497
55-0.006262-0.0680.472941
56-0.043925-0.47710.31707
57-0.008047-0.08740.465244
580.0840440.9130.181565
590.0617650.67090.251786
60-0.032659-0.35480.3617

\begin{tabular}{lllllllll}
\hline
Partial Autocorrelation Function \tabularnewline
Time lag k & PACF(k) & T-STAT & P-value \tabularnewline
1 & -0.693391 & -7.5322 & 0 \tabularnewline
2 & -0.247413 & -2.6876 & 0.004119 \tabularnewline
3 & -0.251974 & -2.7371 & 0.003579 \tabularnewline
4 & -0.345001 & -3.7477 & 0.000139 \tabularnewline
5 & -0.216072 & -2.3471 & 0.010292 \tabularnewline
6 & -0.117969 & -1.2815 & 0.10127 \tabularnewline
7 & -0.148762 & -1.616 & 0.054386 \tabularnewline
8 & -0.296022 & -3.2156 & 0.00084 \tabularnewline
9 & -0.044448 & -0.4828 & 0.315057 \tabularnewline
10 & -0.008079 & -0.0878 & 0.465109 \tabularnewline
11 & 0.365979 & 3.9755 & 6.1e-05 \tabularnewline
12 & -0.081622 & -0.8866 & 0.188537 \tabularnewline
13 & -0.177596 & -1.9292 & 0.028055 \tabularnewline
14 & -0.091894 & -0.9982 & 0.160105 \tabularnewline
15 & -0.043252 & -0.4698 & 0.319668 \tabularnewline
16 & -0.104268 & -1.1326 & 0.12983 \tabularnewline
17 & -0.131233 & -1.4256 & 0.078319 \tabularnewline
18 & -0.092907 & -1.0092 & 0.157464 \tabularnewline
19 & 0.123121 & 1.3374 & 0.091825 \tabularnewline
20 & -0.150195 & -1.6315 & 0.052721 \tabularnewline
21 & 0.101191 & 1.0992 & 0.136957 \tabularnewline
22 & 0.027919 & 0.3033 & 0.381104 \tabularnewline
23 & 0.088215 & 0.9583 & 0.169944 \tabularnewline
24 & 0.121922 & 1.3244 & 0.093963 \tabularnewline
25 & -0.055363 & -0.6014 & 0.274363 \tabularnewline
26 & -0.015146 & -0.1645 & 0.4348 \tabularnewline
27 & 0.100262 & 1.0891 & 0.139159 \tabularnewline
28 & -0.157384 & -1.7096 & 0.044981 \tabularnewline
29 & -0.078079 & -0.8482 & 0.199035 \tabularnewline
30 & 0.076416 & 0.8301 & 0.204081 \tabularnewline
31 & -0.016503 & -0.1793 & 0.429019 \tabularnewline
32 & -0.075551 & -0.8207 & 0.206738 \tabularnewline
33 & 0.011846 & 0.1287 & 0.448914 \tabularnewline
34 & -0.009868 & -0.1072 & 0.457409 \tabularnewline
35 & 0.091246 & 0.9912 & 0.161812 \tabularnewline
36 & 0.014333 & 0.1557 & 0.438269 \tabularnewline
37 & -0.01948 & -0.2116 & 0.416388 \tabularnewline
38 & 0.036567 & 0.3972 & 0.345963 \tabularnewline
39 & 0.024641 & 0.2677 & 0.39471 \tabularnewline
40 & 0.054503 & 0.5921 & 0.277472 \tabularnewline
41 & -0.069448 & -0.7544 & 0.226057 \tabularnewline
42 & 0.044272 & 0.4809 & 0.315734 \tabularnewline
43 & -0.019823 & -0.2153 & 0.414941 \tabularnewline
44 & -0.104628 & -1.1366 & 0.129014 \tabularnewline
45 & 0.080538 & 0.8749 & 0.191712 \tabularnewline
46 & -0.034359 & -0.3732 & 0.354823 \tabularnewline
47 & -0.046133 & -0.5011 & 0.308607 \tabularnewline
48 & -0.127661 & -1.3868 & 0.084066 \tabularnewline
49 & -0.076474 & -0.8307 & 0.203905 \tabularnewline
50 & 0.056846 & 0.6175 & 0.269047 \tabularnewline
51 & -0.025596 & -0.278 & 0.390732 \tabularnewline
52 & 0.017485 & 0.1899 & 0.424843 \tabularnewline
53 & 0.075095 & 0.8157 & 0.208147 \tabularnewline
54 & 0.031725 & 0.3446 & 0.365497 \tabularnewline
55 & -0.006262 & -0.068 & 0.472941 \tabularnewline
56 & -0.043925 & -0.4771 & 0.31707 \tabularnewline
57 & -0.008047 & -0.0874 & 0.465244 \tabularnewline
58 & 0.084044 & 0.913 & 0.181565 \tabularnewline
59 & 0.061765 & 0.6709 & 0.251786 \tabularnewline
60 & -0.032659 & -0.3548 & 0.3617 \tabularnewline
\hline
\end{tabular}
%Source: https://freestatistics.org/blog/index.php?pk=25669&T=2

[TABLE]
[ROW][C]Partial Autocorrelation Function[/C][/ROW]
[ROW][C]Time lag k[/C][C]PACF(k)[/C][C]T-STAT[/C][C]P-value[/C][/ROW]
[ROW][C]1[/C][C]-0.693391[/C][C]-7.5322[/C][C]0[/C][/ROW]
[ROW][C]2[/C][C]-0.247413[/C][C]-2.6876[/C][C]0.004119[/C][/ROW]
[ROW][C]3[/C][C]-0.251974[/C][C]-2.7371[/C][C]0.003579[/C][/ROW]
[ROW][C]4[/C][C]-0.345001[/C][C]-3.7477[/C][C]0.000139[/C][/ROW]
[ROW][C]5[/C][C]-0.216072[/C][C]-2.3471[/C][C]0.010292[/C][/ROW]
[ROW][C]6[/C][C]-0.117969[/C][C]-1.2815[/C][C]0.10127[/C][/ROW]
[ROW][C]7[/C][C]-0.148762[/C][C]-1.616[/C][C]0.054386[/C][/ROW]
[ROW][C]8[/C][C]-0.296022[/C][C]-3.2156[/C][C]0.00084[/C][/ROW]
[ROW][C]9[/C][C]-0.044448[/C][C]-0.4828[/C][C]0.315057[/C][/ROW]
[ROW][C]10[/C][C]-0.008079[/C][C]-0.0878[/C][C]0.465109[/C][/ROW]
[ROW][C]11[/C][C]0.365979[/C][C]3.9755[/C][C]6.1e-05[/C][/ROW]
[ROW][C]12[/C][C]-0.081622[/C][C]-0.8866[/C][C]0.188537[/C][/ROW]
[ROW][C]13[/C][C]-0.177596[/C][C]-1.9292[/C][C]0.028055[/C][/ROW]
[ROW][C]14[/C][C]-0.091894[/C][C]-0.9982[/C][C]0.160105[/C][/ROW]
[ROW][C]15[/C][C]-0.043252[/C][C]-0.4698[/C][C]0.319668[/C][/ROW]
[ROW][C]16[/C][C]-0.104268[/C][C]-1.1326[/C][C]0.12983[/C][/ROW]
[ROW][C]17[/C][C]-0.131233[/C][C]-1.4256[/C][C]0.078319[/C][/ROW]
[ROW][C]18[/C][C]-0.092907[/C][C]-1.0092[/C][C]0.157464[/C][/ROW]
[ROW][C]19[/C][C]0.123121[/C][C]1.3374[/C][C]0.091825[/C][/ROW]
[ROW][C]20[/C][C]-0.150195[/C][C]-1.6315[/C][C]0.052721[/C][/ROW]
[ROW][C]21[/C][C]0.101191[/C][C]1.0992[/C][C]0.136957[/C][/ROW]
[ROW][C]22[/C][C]0.027919[/C][C]0.3033[/C][C]0.381104[/C][/ROW]
[ROW][C]23[/C][C]0.088215[/C][C]0.9583[/C][C]0.169944[/C][/ROW]
[ROW][C]24[/C][C]0.121922[/C][C]1.3244[/C][C]0.093963[/C][/ROW]
[ROW][C]25[/C][C]-0.055363[/C][C]-0.6014[/C][C]0.274363[/C][/ROW]
[ROW][C]26[/C][C]-0.015146[/C][C]-0.1645[/C][C]0.4348[/C][/ROW]
[ROW][C]27[/C][C]0.100262[/C][C]1.0891[/C][C]0.139159[/C][/ROW]
[ROW][C]28[/C][C]-0.157384[/C][C]-1.7096[/C][C]0.044981[/C][/ROW]
[ROW][C]29[/C][C]-0.078079[/C][C]-0.8482[/C][C]0.199035[/C][/ROW]
[ROW][C]30[/C][C]0.076416[/C][C]0.8301[/C][C]0.204081[/C][/ROW]
[ROW][C]31[/C][C]-0.016503[/C][C]-0.1793[/C][C]0.429019[/C][/ROW]
[ROW][C]32[/C][C]-0.075551[/C][C]-0.8207[/C][C]0.206738[/C][/ROW]
[ROW][C]33[/C][C]0.011846[/C][C]0.1287[/C][C]0.448914[/C][/ROW]
[ROW][C]34[/C][C]-0.009868[/C][C]-0.1072[/C][C]0.457409[/C][/ROW]
[ROW][C]35[/C][C]0.091246[/C][C]0.9912[/C][C]0.161812[/C][/ROW]
[ROW][C]36[/C][C]0.014333[/C][C]0.1557[/C][C]0.438269[/C][/ROW]
[ROW][C]37[/C][C]-0.01948[/C][C]-0.2116[/C][C]0.416388[/C][/ROW]
[ROW][C]38[/C][C]0.036567[/C][C]0.3972[/C][C]0.345963[/C][/ROW]
[ROW][C]39[/C][C]0.024641[/C][C]0.2677[/C][C]0.39471[/C][/ROW]
[ROW][C]40[/C][C]0.054503[/C][C]0.5921[/C][C]0.277472[/C][/ROW]
[ROW][C]41[/C][C]-0.069448[/C][C]-0.7544[/C][C]0.226057[/C][/ROW]
[ROW][C]42[/C][C]0.044272[/C][C]0.4809[/C][C]0.315734[/C][/ROW]
[ROW][C]43[/C][C]-0.019823[/C][C]-0.2153[/C][C]0.414941[/C][/ROW]
[ROW][C]44[/C][C]-0.104628[/C][C]-1.1366[/C][C]0.129014[/C][/ROW]
[ROW][C]45[/C][C]0.080538[/C][C]0.8749[/C][C]0.191712[/C][/ROW]
[ROW][C]46[/C][C]-0.034359[/C][C]-0.3732[/C][C]0.354823[/C][/ROW]
[ROW][C]47[/C][C]-0.046133[/C][C]-0.5011[/C][C]0.308607[/C][/ROW]
[ROW][C]48[/C][C]-0.127661[/C][C]-1.3868[/C][C]0.084066[/C][/ROW]
[ROW][C]49[/C][C]-0.076474[/C][C]-0.8307[/C][C]0.203905[/C][/ROW]
[ROW][C]50[/C][C]0.056846[/C][C]0.6175[/C][C]0.269047[/C][/ROW]
[ROW][C]51[/C][C]-0.025596[/C][C]-0.278[/C][C]0.390732[/C][/ROW]
[ROW][C]52[/C][C]0.017485[/C][C]0.1899[/C][C]0.424843[/C][/ROW]
[ROW][C]53[/C][C]0.075095[/C][C]0.8157[/C][C]0.208147[/C][/ROW]
[ROW][C]54[/C][C]0.031725[/C][C]0.3446[/C][C]0.365497[/C][/ROW]
[ROW][C]55[/C][C]-0.006262[/C][C]-0.068[/C][C]0.472941[/C][/ROW]
[ROW][C]56[/C][C]-0.043925[/C][C]-0.4771[/C][C]0.31707[/C][/ROW]
[ROW][C]57[/C][C]-0.008047[/C][C]-0.0874[/C][C]0.465244[/C][/ROW]
[ROW][C]58[/C][C]0.084044[/C][C]0.913[/C][C]0.181565[/C][/ROW]
[ROW][C]59[/C][C]0.061765[/C][C]0.6709[/C][C]0.251786[/C][/ROW]
[ROW][C]60[/C][C]-0.032659[/C][C]-0.3548[/C][C]0.3617[/C][/ROW]
[/TABLE]
Source: https://freestatistics.org/blog/index.php?pk=25669&T=2

Globally Unique Identifier (entire table): ba.freestatistics.org/blog/index.php?pk=25669&T=2

As an alternative you can also use a QR Code:  

The GUIDs for individual cells are displayed in the table below:

Partial Autocorrelation Function
Time lag kPACF(k)T-STATP-value
1-0.693391-7.53220
2-0.247413-2.68760.004119
3-0.251974-2.73710.003579
4-0.345001-3.74770.000139
5-0.216072-2.34710.010292
6-0.117969-1.28150.10127
7-0.148762-1.6160.054386
8-0.296022-3.21560.00084
9-0.044448-0.48280.315057
10-0.008079-0.08780.465109
110.3659793.97556.1e-05
12-0.081622-0.88660.188537
13-0.177596-1.92920.028055
14-0.091894-0.99820.160105
15-0.043252-0.46980.319668
16-0.104268-1.13260.12983
17-0.131233-1.42560.078319
18-0.092907-1.00920.157464
190.1231211.33740.091825
20-0.150195-1.63150.052721
210.1011911.09920.136957
220.0279190.30330.381104
230.0882150.95830.169944
240.1219221.32440.093963
25-0.055363-0.60140.274363
26-0.015146-0.16450.4348
270.1002621.08910.139159
28-0.157384-1.70960.044981
29-0.078079-0.84820.199035
300.0764160.83010.204081
31-0.016503-0.17930.429019
32-0.075551-0.82070.206738
330.0118460.12870.448914
34-0.009868-0.10720.457409
350.0912460.99120.161812
360.0143330.15570.438269
37-0.01948-0.21160.416388
380.0365670.39720.345963
390.0246410.26770.39471
400.0545030.59210.277472
41-0.069448-0.75440.226057
420.0442720.48090.315734
43-0.019823-0.21530.414941
44-0.104628-1.13660.129014
450.0805380.87490.191712
46-0.034359-0.37320.354823
47-0.046133-0.50110.308607
48-0.127661-1.38680.084066
49-0.076474-0.83070.203905
500.0568460.61750.269047
51-0.025596-0.2780.390732
520.0174850.18990.424843
530.0750950.81570.208147
540.0317250.34460.365497
55-0.006262-0.0680.472941
56-0.043925-0.47710.31707
57-0.008047-0.08740.465244
580.0840440.9130.181565
590.0617650.67090.251786
60-0.032659-0.35480.3617


Parameters (Session):
par1 = 60 ; par2 = 1 ; par3 = 0 ; par4 = 0 ; par5 = 12 ;
Parameters (R input):
par1 = 60 ; par2 = 1 ; par3 = 2 ; par4 = 2 ; par5 = 12 ;
R code (references can be found in the software module):
if (par1 == 'Default') {
par1 = 10*log10(length(x))
} else {
par1 <- as.numeric(par1)
}
par2 <- as.numeric(par2)
par3 <- as.numeric(par3)
par4 <- as.numeric(par4)
par5 <- as.numeric(par5)
if (par2 == 0) {
x <- log(x)
} else {
x <- (x ^ par2 - 1) / par2
}
if (par3 > 0) x <- diff(x,lag=1,difference=par3)
if (par4 > 0) x <- diff(x,lag=par5,difference=par4)
bitmap(file='pic1.png')
racf <- acf(x,par1,main='Autocorrelation',xlab='lags',ylab='ACF')
dev.off()
bitmap(file='pic2.png')
rpacf <- pacf(x,par1,main='Partial Autocorrelation',xlab='lags',ylab='PACF')
dev.off()
(myacf <- c(racf$acf))
(mypacf <- c(rpacf$acf))
lengthx <- length(x)
sqrtn <- sqrt(lengthx)
load(file='createtable')
a<-table.start()
a<-table.row.start(a)
a<-table.element(a,'Autocorrelation Function',4,TRUE)
a<-table.row.end(a)
a<-table.row.start(a)
a<-table.element(a,'Time lag k',header=TRUE)
a<-table.element(a,hyperlink('basics.htm','ACF(k)','click here for more information about the Autocorrelation Function'),header=TRUE)
a<-table.element(a,'T-STAT',header=TRUE)
a<-table.element(a,'P-value',header=TRUE)
a<-table.row.end(a)
for (i in 2:(par1+1)) {
a<-table.row.start(a)
a<-table.element(a,i-1,header=TRUE)
a<-table.element(a,round(myacf[i],6))
mytstat <- myacf[i]*sqrtn
a<-table.element(a,round(mytstat,4))
a<-table.element(a,round(1-pt(abs(mytstat),lengthx),6))
a<-table.row.end(a)
}
a<-table.end(a)
table.save(a,file='mytable.tab')
a<-table.start()
a<-table.row.start(a)
a<-table.element(a,'Partial Autocorrelation Function',4,TRUE)
a<-table.row.end(a)
a<-table.row.start(a)
a<-table.element(a,'Time lag k',header=TRUE)
a<-table.element(a,hyperlink('basics.htm','PACF(k)','click here for more information about the Partial Autocorrelation Function'),header=TRUE)
a<-table.element(a,'T-STAT',header=TRUE)
a<-table.element(a,'P-value',header=TRUE)
a<-table.row.end(a)
for (i in 1:par1) {
a<-table.row.start(a)
a<-table.element(a,i,header=TRUE)
a<-table.element(a,round(mypacf[i],6))
mytstat <- mypacf[i]*sqrtn
a<-table.element(a,round(mytstat,4))
a<-table.element(a,round(1-pt(abs(mytstat),lengthx),6))
a<-table.row.end(a)
}
a<-table.end(a)
table.save(a,file='mytable1.tab')