Free Statistics

of Irreproducible Research!

Author's title

Author*The author of this computation has been verified*
R Software Modulerwasp_multipleregression.wasp
Title produced by softwareMultiple Regression
Date of computationSun, 23 Nov 2008 10:55:15 -0700
Cite this page as followsStatistical Computations at FreeStatistics.org, Office for Research Development and Education, URL https://freestatistics.org/blog/index.php?v=date/2008/Nov/23/t122746318374xr9gbduno5y1d.htm/, Retrieved Sat, 18 May 2024 02:36:43 +0000
Statistical Computations at FreeStatistics.org, Office for Research Development and Education, URL https://freestatistics.org/blog/index.php?pk=25308, Retrieved Sat, 18 May 2024 02:36:43 +0000
QR Codes:

Original text written by user:
IsPrivate?No (this computation is public)
User-defined keywords
Estimated Impact191
Family? (F = Feedback message, R = changed R code, M = changed R Module, P = changed Parameters, D = changed Data)
F     [Multiple Regression] [] [2007-11-19 19:55:31] [b731da8b544846036771bbf9bf2f34ce]
F    D    [Multiple Regression] [Q3] [2008-11-23 17:55:15] [787873b6436f665b5b192a0bdb2e43c9] [Current]
-   PD      [Multiple Regression] [] [2008-11-29 15:21:54] [4c8dfb519edec2da3492d7e6be9a5685]
-             [Multiple Regression] [] [2008-11-29 16:33:12] [888addc516c3b812dd7be4bd54caa358]
-   PD      [Multiple Regression] [] [2008-11-29 15:24:41] [4c8dfb519edec2da3492d7e6be9a5685]
-             [Multiple Regression] [] [2008-11-29 16:38:14] [888addc516c3b812dd7be4bd54caa358]
-             [Multiple Regression] [] [2008-11-30 22:07:08] [cb714085b233acee8e8acd879ea442b6]
Feedback Forum
2008-11-29 15:32:31 [Kristof Van Esbroeck] [reply
Student gaat uit van een berekening zonder monthly dummies en zonder invoering van een trend. We moeten echter ook andere berekeningen maken om vervolgens de verschillende gevonden r squared waarden met elkaar te vergelijken.

Om deze vergelijking te maken heb ik volgende berekeningen gemaakt

Met dummies en zonder trend
http://www.freestatistics.org/blog/index.php?v=date/2008/Nov/29/t1227972149wtyvnk4mk75pdvs.htm

Met dummies en met trend
http://www.freestatistics.org/blog/index.php?v=date/2008/Nov/29/t1227972322gy5jyb8qvo7ank0.htm


We vergelijken nu de gevonden R – squared waarden:

0.401499294596192 in de berekening van de student, maw zonder dummies en zonder trend. 0.410592683326865 in de berekening met dummies en zonder trend. Ten slotte 0.77210412450139 in de berekening met dummie en met trend.

We kunnen dus concluderen dat de laatste berekening de grootste verklarende kracht heeft, nl 77,21%. De seizonaliteit en lineaire trend hebben dus een erg grote invloed op de verklarende kracht.
2008-11-30 19:27:32 [Romina Battain] [reply
Het gegeven antwoord is correct. Ook handig om te controleren is of je een goed model gebruikt. Dit kan je doen op basis van de 4 voorwaarden, die je ook in Q2 hebt gebruikt.

Het gebruik van dummies en een lineaire trend, verbeteren je gegeven antwoord.
2008-11-30 22:11:20 [Tamara Witters] [reply
Zoals Kristof hierboven vermeld heeft, had ik een foute berekening gemaakt.
De juiste werkwijze is “include mothly dummies” en lineaire trend.

http://www.freestatistics.org/blog/index.php?v=date/2008/Nov/30/t1228082929lzyyiy7d8tqx79e.htm

Post a new message
Dataseries X:
1,1608	0
1,1208	0
1,0883	0
1,0704	0
1,0628	0
1,0378	0
1,0353	0
1,0604	0
1,0501	0
1,0706	0
1,0338	0
1,011	0
1,0137	0
0,9834	0
0,9643	0
0,947	0
0,906	0
0,9492	0
0,9397	0
0,9041	0
0,8721	0
0,8552	0
0,8564	0
0,8973	0
0,9383	0
0,9217	0
0,9095	0
0,892	0
0,8742	0
0,8532	0
0,8607	0
0,9005	0
0,9111	0
0,9059	0
0,8883	0
0,8924	0
0,8833	0
0,87	0
0,8758	0
0,8858	0
0,917	0
0,9554	0
0,9922	0
0,9778	0
0,9808	0
0,9811	0
1,0014	0
1,0183	0
1,0622	0
1,0773	0
1,0807	0
1,0848	0
1,1582	0
1,1663	0
1,1372	0
1,1139	0
1,1222	0
1,1692	0
1,1702	0
1,2286	0
1,2613	0
1,2646	0
1,2262	0
1,1985	0
1,2007	0
1,2138	0
1,2266	0
1,2176	0
1,2218	0
1,249	0
1,2991	0
1,3408	0
1,3119	0
1,3014	0
1,3201	0
1,2938	0
1,2694	0
1,2165	0
1,2037	0
1,2292	0
1,2256	0
1,2015	0
1,1786	0
1,1856	0
1,2103	0
1,1938	0
1,202	0
1,2271	0
1,277	0
1,265	0
1,2684	0
1,2811	0
1,2727	0
1,2611	0
1,2881	0
1,3213	0
1,2999	0
1,3074	0
1,3242	0
1,3516	0
1,3511	0
1,3419	1
1,3716	1
1,3622	1
1,3896	1
1,4227	1
1,4684	1
1,457	1
1,4718	1
1,4748	1
1,5527	1
1,5751	1
1,5557	1
1,5553	1
1,577	1


Summary of computational transaction
Raw Inputview raw input (R code)
Raw Outputview raw output of R engine
Computing time6 seconds
R Server'Sir Ronald Aylmer Fisher' @ 193.190.124.24

\begin{tabular}{lllllllll}
\hline
Summary of computational transaction \tabularnewline
Raw Input & view raw input (R code)  \tabularnewline
Raw Output & view raw output of R engine  \tabularnewline
Computing time & 6 seconds \tabularnewline
R Server & 'Sir Ronald Aylmer Fisher' @ 193.190.124.24 \tabularnewline
\hline
\end{tabular}
%Source: https://freestatistics.org/blog/index.php?pk=25308&T=0

[TABLE]
[ROW][C]Summary of computational transaction[/C][/ROW]
[ROW][C]Raw Input[/C][C]view raw input (R code) [/C][/ROW]
[ROW][C]Raw Output[/C][C]view raw output of R engine [/C][/ROW]
[ROW][C]Computing time[/C][C]6 seconds[/C][/ROW]
[ROW][C]R Server[/C][C]'Sir Ronald Aylmer Fisher' @ 193.190.124.24[/C][/ROW]
[/TABLE]
Source: https://freestatistics.org/blog/index.php?pk=25308&T=0

Globally Unique Identifier (entire table): ba.freestatistics.org/blog/index.php?pk=25308&T=0

As an alternative you can also use a QR Code:  

The GUIDs for individual cells are displayed in the table below:

Summary of computational transaction
Raw Inputview raw input (R code)
Raw Outputview raw output of R engine
Computing time6 seconds
R Server'Sir Ronald Aylmer Fisher' @ 193.190.124.24


Multiple Linear Regression - Estimated Regression Equation
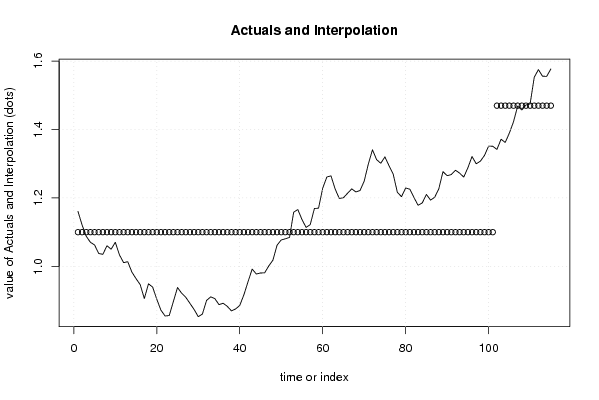
y[t] = + 1.10007326732673 + 0.369626732673267x[t] + e[t]

\begin{tabular}{lllllllll}
\hline
Multiple Linear Regression - Estimated Regression Equation \tabularnewline
y[t] =  +  1.10007326732673 +  0.369626732673267x[t]  + e[t] \tabularnewline
\hline
\end{tabular}
%Source: https://freestatistics.org/blog/index.php?pk=25308&T=1

[TABLE]
[ROW][C]Multiple Linear Regression - Estimated Regression Equation[/C][/ROW]
[ROW][C]y[t] =  +  1.10007326732673 +  0.369626732673267x[t]  + e[t][/C][/ROW]
[/TABLE]
Source: https://freestatistics.org/blog/index.php?pk=25308&T=1

Globally Unique Identifier (entire table): ba.freestatistics.org/blog/index.php?pk=25308&T=1

As an alternative you can also use a QR Code:  

The GUIDs for individual cells are displayed in the table below:

Multiple Linear Regression - Estimated Regression Equation
y[t] = + 1.10007326732673 + 0.369626732673267x[t] + e[t]


Multiple Linear Regression - Ordinary Least Squares
VariableParameterS.D.T-STATH0: parameter = 02-tail p-value1-tail p-value
(Intercept)1.100073267326730.01481374.266400
x0.3696267326732670.0424548.706600

\begin{tabular}{lllllllll}
\hline
Multiple Linear Regression - Ordinary Least Squares \tabularnewline
Variable & Parameter & S.D. & T-STATH0: parameter = 0 & 2-tail p-value & 1-tail p-value \tabularnewline
(Intercept) & 1.10007326732673 & 0.014813 & 74.2664 & 0 & 0 \tabularnewline
x & 0.369626732673267 & 0.042454 & 8.7066 & 0 & 0 \tabularnewline
\hline
\end{tabular}
%Source: https://freestatistics.org/blog/index.php?pk=25308&T=2

[TABLE]
[ROW][C]Multiple Linear Regression - Ordinary Least Squares[/C][/ROW]
[ROW][C]Variable[/C][C]Parameter[/C][C]S.D.[/C][C]T-STATH0: parameter = 0[/C][C]2-tail p-value[/C][C]1-tail p-value[/C][/ROW]
[ROW][C](Intercept)[/C][C]1.10007326732673[/C][C]0.014813[/C][C]74.2664[/C][C]0[/C][C]0[/C][/ROW]
[ROW][C]x[/C][C]0.369626732673267[/C][C]0.042454[/C][C]8.7066[/C][C]0[/C][C]0[/C][/ROW]
[/TABLE]
Source: https://freestatistics.org/blog/index.php?pk=25308&T=2

Globally Unique Identifier (entire table): ba.freestatistics.org/blog/index.php?pk=25308&T=2

As an alternative you can also use a QR Code:  

The GUIDs for individual cells are displayed in the table below:

Multiple Linear Regression - Ordinary Least Squares
VariableParameterS.D.T-STATH0: parameter = 02-tail p-value1-tail p-value
(Intercept)1.100073267326730.01481374.266400
x0.3696267326732670.0424548.706600


Multiple Linear Regression - Regression Statistics
Multiple R0.633639719869416
R-squared0.401499294596192
Adjusted R-squared0.396202828176689
F-TEST (value)75.8051241706706
F-TEST (DF numerator)1
F-TEST (DF denominator)113
p-value2.96429547574917e-14
Multiple Linear Regression - Residual Statistics
Residual Standard Deviation0.148864065741936
Sum Squared Residuals2.50413763782178

\begin{tabular}{lllllllll}
\hline
Multiple Linear Regression - Regression Statistics \tabularnewline
Multiple R & 0.633639719869416 \tabularnewline
R-squared & 0.401499294596192 \tabularnewline
Adjusted R-squared & 0.396202828176689 \tabularnewline
F-TEST (value) & 75.8051241706706 \tabularnewline
F-TEST (DF numerator) & 1 \tabularnewline
F-TEST (DF denominator) & 113 \tabularnewline
p-value & 2.96429547574917e-14 \tabularnewline
Multiple Linear Regression - Residual Statistics \tabularnewline
Residual Standard Deviation & 0.148864065741936 \tabularnewline
Sum Squared Residuals & 2.50413763782178 \tabularnewline
\hline
\end{tabular}
%Source: https://freestatistics.org/blog/index.php?pk=25308&T=3

[TABLE]
[ROW][C]Multiple Linear Regression - Regression Statistics[/C][/ROW]
[ROW][C]Multiple R[/C][C]0.633639719869416[/C][/ROW]
[ROW][C]R-squared[/C][C]0.401499294596192[/C][/ROW]
[ROW][C]Adjusted R-squared[/C][C]0.396202828176689[/C][/ROW]
[ROW][C]F-TEST (value)[/C][C]75.8051241706706[/C][/ROW]
[ROW][C]F-TEST (DF numerator)[/C][C]1[/C][/ROW]
[ROW][C]F-TEST (DF denominator)[/C][C]113[/C][/ROW]
[ROW][C]p-value[/C][C]2.96429547574917e-14[/C][/ROW]
[ROW][C]Multiple Linear Regression - Residual Statistics[/C][/ROW]
[ROW][C]Residual Standard Deviation[/C][C]0.148864065741936[/C][/ROW]
[ROW][C]Sum Squared Residuals[/C][C]2.50413763782178[/C][/ROW]
[/TABLE]
Source: https://freestatistics.org/blog/index.php?pk=25308&T=3

Globally Unique Identifier (entire table): ba.freestatistics.org/blog/index.php?pk=25308&T=3

As an alternative you can also use a QR Code:  

The GUIDs for individual cells are displayed in the table below:

Multiple Linear Regression - Regression Statistics
Multiple R0.633639719869416
R-squared0.401499294596192
Adjusted R-squared0.396202828176689
F-TEST (value)75.8051241706706
F-TEST (DF numerator)1
F-TEST (DF denominator)113
p-value2.96429547574917e-14
Multiple Linear Regression - Residual Statistics
Residual Standard Deviation0.148864065741936
Sum Squared Residuals2.50413763782178


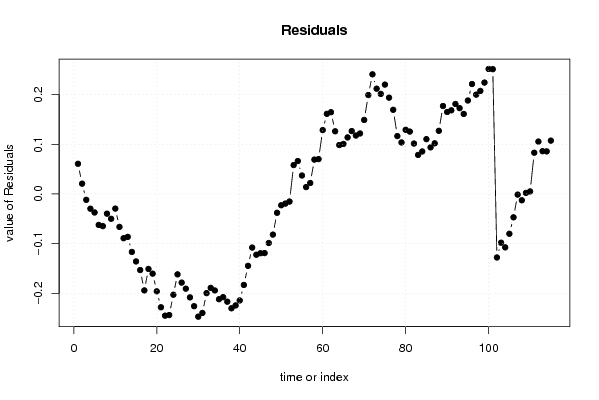
Multiple Linear Regression - Actuals, Interpolation, and Residuals
Time or IndexActualsInterpolationForecastResidualsPrediction Error
11.16081.100073267326730.0607267326732693
21.12081.100073267326730.0207267326732672
31.08831.10007326732673-0.0117732673267326
41.07041.10007326732673-0.0296732673267327
51.06281.10007326732673-0.0372732673267327
61.03781.10007326732673-0.0622732673267326
71.03531.10007326732673-0.0647732673267326
81.06041.10007326732673-0.0396732673267327
91.05011.10007326732673-0.0499732673267327
101.07061.10007326732673-0.0294732673267327
111.03381.10007326732673-0.0662732673267326
121.0111.10007326732673-0.0890732673267328
131.01371.10007326732673-0.0863732673267327
140.98341.10007326732673-0.116673267326733
150.96431.10007326732673-0.135773267326733
160.9471.10007326732673-0.153073267326733
170.9061.10007326732673-0.194073267326733
180.94921.10007326732673-0.150873267326733
190.93971.10007326732673-0.160373267326733
200.90411.10007326732673-0.195973267326733
210.87211.10007326732673-0.227973267326733
220.85521.10007326732673-0.244873267326733
230.85641.10007326732673-0.243673267326733
240.89731.10007326732673-0.202773267326733
250.93831.10007326732673-0.161773267326733
260.92171.10007326732673-0.178373267326733
270.90951.10007326732673-0.190573267326733
280.8921.10007326732673-0.208073267326733
290.87421.10007326732673-0.225873267326733
300.85321.10007326732673-0.246873267326733
310.86071.10007326732673-0.239373267326733
320.90051.10007326732673-0.199573267326733
330.91111.10007326732673-0.188973267326733
340.90591.10007326732673-0.194173267326733
350.88831.10007326732673-0.211773267326733
360.89241.10007326732673-0.207673267326733
370.88331.10007326732673-0.216773267326733
380.871.10007326732673-0.230073267326733
390.87581.10007326732673-0.224273267326733
400.88581.10007326732673-0.214273267326733
410.9171.10007326732673-0.183073267326733
420.95541.10007326732673-0.144673267326733
430.99221.10007326732673-0.107873267326733
440.97781.10007326732673-0.122273267326733
450.98081.10007326732673-0.119273267326733
460.98111.10007326732673-0.118973267326733
471.00141.10007326732673-0.0986732673267326
481.01831.10007326732673-0.0817732673267327
491.06221.10007326732673-0.0378732673267327
501.07731.10007326732673-0.0227732673267328
511.08071.10007326732673-0.0193732673267327
521.08481.10007326732673-0.0152732673267327
531.15821.100073267326730.0581267326732672
541.16631.100073267326730.0662267326732672
551.13721.100073267326730.0371267326732673
561.11391.100073267326730.0138267326732672
571.12221.100073267326730.0221267326732674
581.16921.100073267326730.0691267326732673
591.17021.100073267326730.0701267326732672
601.22861.100073267326730.128526732673267
611.26131.100073267326730.161226732673267
621.26461.100073267326730.164526732673267
631.22621.100073267326730.126126732673267
641.19851.100073267326730.0984267326732672
651.20071.100073267326730.100626732673267
661.21381.100073267326730.113726732673267
671.22661.100073267326730.126526732673267
681.21761.100073267326730.117526732673267
691.22181.100073267326730.121726732673267
701.2491.100073267326730.148926732673267
711.29911.100073267326730.199026732673267
721.34081.100073267326730.240726732673267
731.31191.100073267326730.211826732673267
741.30141.100073267326730.201326732673267
751.32011.100073267326730.220026732673267
761.29381.100073267326730.193726732673267
771.26941.100073267326730.169326732673267
781.21651.100073267326730.116426732673267
791.20371.100073267326730.103626732673267
801.22921.100073267326730.129126732673267
811.22561.100073267326730.125526732673267
821.20151.100073267326730.101426732673267
831.17861.100073267326730.0785267326732674
841.18561.100073267326730.0855267326732673
851.21031.100073267326730.110226732673267
861.19381.100073267326730.0937267326732673
871.2021.100073267326730.101926732673267
881.22711.100073267326730.127026732673267
891.2771.100073267326730.176926732673267
901.2651.100073267326730.164926732673267
911.26841.100073267326730.168326732673267
921.28111.100073267326730.181026732673267
931.27271.100073267326730.172626732673267
941.26111.100073267326730.161026732673267
951.28811.100073267326730.188026732673267
961.32131.100073267326730.221226732673267
971.29991.100073267326730.199826732673267
981.30741.100073267326730.207326732673267
991.32421.100073267326730.224126732673267
1001.35161.100073267326730.251526732673267
1011.35111.100073267326730.251026732673267
1021.34191.4697-0.1278
1031.37161.4697-0.0981
1041.36221.4697-0.1075
1051.38961.4697-0.0801
1061.42271.4697-0.0469999999999999
1071.46841.4697-0.00130000000000008
1081.4571.4697-0.0126999999999999
1091.47181.46970.00209999999999999
1101.47481.46970.0051000000000001
1111.55271.46970.083
1121.57511.46970.1054
1131.55571.46970.086
1141.55531.46970.0855999999999999
1151.5771.46970.1073

\begin{tabular}{lllllllll}
\hline
Multiple Linear Regression - Actuals, Interpolation, and Residuals \tabularnewline
Time or Index & Actuals & InterpolationForecast & ResidualsPrediction Error \tabularnewline
1 & 1.1608 & 1.10007326732673 & 0.0607267326732693 \tabularnewline
2 & 1.1208 & 1.10007326732673 & 0.0207267326732672 \tabularnewline
3 & 1.0883 & 1.10007326732673 & -0.0117732673267326 \tabularnewline
4 & 1.0704 & 1.10007326732673 & -0.0296732673267327 \tabularnewline
5 & 1.0628 & 1.10007326732673 & -0.0372732673267327 \tabularnewline
6 & 1.0378 & 1.10007326732673 & -0.0622732673267326 \tabularnewline
7 & 1.0353 & 1.10007326732673 & -0.0647732673267326 \tabularnewline
8 & 1.0604 & 1.10007326732673 & -0.0396732673267327 \tabularnewline
9 & 1.0501 & 1.10007326732673 & -0.0499732673267327 \tabularnewline
10 & 1.0706 & 1.10007326732673 & -0.0294732673267327 \tabularnewline
11 & 1.0338 & 1.10007326732673 & -0.0662732673267326 \tabularnewline
12 & 1.011 & 1.10007326732673 & -0.0890732673267328 \tabularnewline
13 & 1.0137 & 1.10007326732673 & -0.0863732673267327 \tabularnewline
14 & 0.9834 & 1.10007326732673 & -0.116673267326733 \tabularnewline
15 & 0.9643 & 1.10007326732673 & -0.135773267326733 \tabularnewline
16 & 0.947 & 1.10007326732673 & -0.153073267326733 \tabularnewline
17 & 0.906 & 1.10007326732673 & -0.194073267326733 \tabularnewline
18 & 0.9492 & 1.10007326732673 & -0.150873267326733 \tabularnewline
19 & 0.9397 & 1.10007326732673 & -0.160373267326733 \tabularnewline
20 & 0.9041 & 1.10007326732673 & -0.195973267326733 \tabularnewline
21 & 0.8721 & 1.10007326732673 & -0.227973267326733 \tabularnewline
22 & 0.8552 & 1.10007326732673 & -0.244873267326733 \tabularnewline
23 & 0.8564 & 1.10007326732673 & -0.243673267326733 \tabularnewline
24 & 0.8973 & 1.10007326732673 & -0.202773267326733 \tabularnewline
25 & 0.9383 & 1.10007326732673 & -0.161773267326733 \tabularnewline
26 & 0.9217 & 1.10007326732673 & -0.178373267326733 \tabularnewline
27 & 0.9095 & 1.10007326732673 & -0.190573267326733 \tabularnewline
28 & 0.892 & 1.10007326732673 & -0.208073267326733 \tabularnewline
29 & 0.8742 & 1.10007326732673 & -0.225873267326733 \tabularnewline
30 & 0.8532 & 1.10007326732673 & -0.246873267326733 \tabularnewline
31 & 0.8607 & 1.10007326732673 & -0.239373267326733 \tabularnewline
32 & 0.9005 & 1.10007326732673 & -0.199573267326733 \tabularnewline
33 & 0.9111 & 1.10007326732673 & -0.188973267326733 \tabularnewline
34 & 0.9059 & 1.10007326732673 & -0.194173267326733 \tabularnewline
35 & 0.8883 & 1.10007326732673 & -0.211773267326733 \tabularnewline
36 & 0.8924 & 1.10007326732673 & -0.207673267326733 \tabularnewline
37 & 0.8833 & 1.10007326732673 & -0.216773267326733 \tabularnewline
38 & 0.87 & 1.10007326732673 & -0.230073267326733 \tabularnewline
39 & 0.8758 & 1.10007326732673 & -0.224273267326733 \tabularnewline
40 & 0.8858 & 1.10007326732673 & -0.214273267326733 \tabularnewline
41 & 0.917 & 1.10007326732673 & -0.183073267326733 \tabularnewline
42 & 0.9554 & 1.10007326732673 & -0.144673267326733 \tabularnewline
43 & 0.9922 & 1.10007326732673 & -0.107873267326733 \tabularnewline
44 & 0.9778 & 1.10007326732673 & -0.122273267326733 \tabularnewline
45 & 0.9808 & 1.10007326732673 & -0.119273267326733 \tabularnewline
46 & 0.9811 & 1.10007326732673 & -0.118973267326733 \tabularnewline
47 & 1.0014 & 1.10007326732673 & -0.0986732673267326 \tabularnewline
48 & 1.0183 & 1.10007326732673 & -0.0817732673267327 \tabularnewline
49 & 1.0622 & 1.10007326732673 & -0.0378732673267327 \tabularnewline
50 & 1.0773 & 1.10007326732673 & -0.0227732673267328 \tabularnewline
51 & 1.0807 & 1.10007326732673 & -0.0193732673267327 \tabularnewline
52 & 1.0848 & 1.10007326732673 & -0.0152732673267327 \tabularnewline
53 & 1.1582 & 1.10007326732673 & 0.0581267326732672 \tabularnewline
54 & 1.1663 & 1.10007326732673 & 0.0662267326732672 \tabularnewline
55 & 1.1372 & 1.10007326732673 & 0.0371267326732673 \tabularnewline
56 & 1.1139 & 1.10007326732673 & 0.0138267326732672 \tabularnewline
57 & 1.1222 & 1.10007326732673 & 0.0221267326732674 \tabularnewline
58 & 1.1692 & 1.10007326732673 & 0.0691267326732673 \tabularnewline
59 & 1.1702 & 1.10007326732673 & 0.0701267326732672 \tabularnewline
60 & 1.2286 & 1.10007326732673 & 0.128526732673267 \tabularnewline
61 & 1.2613 & 1.10007326732673 & 0.161226732673267 \tabularnewline
62 & 1.2646 & 1.10007326732673 & 0.164526732673267 \tabularnewline
63 & 1.2262 & 1.10007326732673 & 0.126126732673267 \tabularnewline
64 & 1.1985 & 1.10007326732673 & 0.0984267326732672 \tabularnewline
65 & 1.2007 & 1.10007326732673 & 0.100626732673267 \tabularnewline
66 & 1.2138 & 1.10007326732673 & 0.113726732673267 \tabularnewline
67 & 1.2266 & 1.10007326732673 & 0.126526732673267 \tabularnewline
68 & 1.2176 & 1.10007326732673 & 0.117526732673267 \tabularnewline
69 & 1.2218 & 1.10007326732673 & 0.121726732673267 \tabularnewline
70 & 1.249 & 1.10007326732673 & 0.148926732673267 \tabularnewline
71 & 1.2991 & 1.10007326732673 & 0.199026732673267 \tabularnewline
72 & 1.3408 & 1.10007326732673 & 0.240726732673267 \tabularnewline
73 & 1.3119 & 1.10007326732673 & 0.211826732673267 \tabularnewline
74 & 1.3014 & 1.10007326732673 & 0.201326732673267 \tabularnewline
75 & 1.3201 & 1.10007326732673 & 0.220026732673267 \tabularnewline
76 & 1.2938 & 1.10007326732673 & 0.193726732673267 \tabularnewline
77 & 1.2694 & 1.10007326732673 & 0.169326732673267 \tabularnewline
78 & 1.2165 & 1.10007326732673 & 0.116426732673267 \tabularnewline
79 & 1.2037 & 1.10007326732673 & 0.103626732673267 \tabularnewline
80 & 1.2292 & 1.10007326732673 & 0.129126732673267 \tabularnewline
81 & 1.2256 & 1.10007326732673 & 0.125526732673267 \tabularnewline
82 & 1.2015 & 1.10007326732673 & 0.101426732673267 \tabularnewline
83 & 1.1786 & 1.10007326732673 & 0.0785267326732674 \tabularnewline
84 & 1.1856 & 1.10007326732673 & 0.0855267326732673 \tabularnewline
85 & 1.2103 & 1.10007326732673 & 0.110226732673267 \tabularnewline
86 & 1.1938 & 1.10007326732673 & 0.0937267326732673 \tabularnewline
87 & 1.202 & 1.10007326732673 & 0.101926732673267 \tabularnewline
88 & 1.2271 & 1.10007326732673 & 0.127026732673267 \tabularnewline
89 & 1.277 & 1.10007326732673 & 0.176926732673267 \tabularnewline
90 & 1.265 & 1.10007326732673 & 0.164926732673267 \tabularnewline
91 & 1.2684 & 1.10007326732673 & 0.168326732673267 \tabularnewline
92 & 1.2811 & 1.10007326732673 & 0.181026732673267 \tabularnewline
93 & 1.2727 & 1.10007326732673 & 0.172626732673267 \tabularnewline
94 & 1.2611 & 1.10007326732673 & 0.161026732673267 \tabularnewline
95 & 1.2881 & 1.10007326732673 & 0.188026732673267 \tabularnewline
96 & 1.3213 & 1.10007326732673 & 0.221226732673267 \tabularnewline
97 & 1.2999 & 1.10007326732673 & 0.199826732673267 \tabularnewline
98 & 1.3074 & 1.10007326732673 & 0.207326732673267 \tabularnewline
99 & 1.3242 & 1.10007326732673 & 0.224126732673267 \tabularnewline
100 & 1.3516 & 1.10007326732673 & 0.251526732673267 \tabularnewline
101 & 1.3511 & 1.10007326732673 & 0.251026732673267 \tabularnewline
102 & 1.3419 & 1.4697 & -0.1278 \tabularnewline
103 & 1.3716 & 1.4697 & -0.0981 \tabularnewline
104 & 1.3622 & 1.4697 & -0.1075 \tabularnewline
105 & 1.3896 & 1.4697 & -0.0801 \tabularnewline
106 & 1.4227 & 1.4697 & -0.0469999999999999 \tabularnewline
107 & 1.4684 & 1.4697 & -0.00130000000000008 \tabularnewline
108 & 1.457 & 1.4697 & -0.0126999999999999 \tabularnewline
109 & 1.4718 & 1.4697 & 0.00209999999999999 \tabularnewline
110 & 1.4748 & 1.4697 & 0.0051000000000001 \tabularnewline
111 & 1.5527 & 1.4697 & 0.083 \tabularnewline
112 & 1.5751 & 1.4697 & 0.1054 \tabularnewline
113 & 1.5557 & 1.4697 & 0.086 \tabularnewline
114 & 1.5553 & 1.4697 & 0.0855999999999999 \tabularnewline
115 & 1.577 & 1.4697 & 0.1073 \tabularnewline
\hline
\end{tabular}
%Source: https://freestatistics.org/blog/index.php?pk=25308&T=4

[TABLE]
[ROW][C]Multiple Linear Regression - Actuals, Interpolation, and Residuals[/C][/ROW]
[ROW][C]Time or Index[/C][C]Actuals[/C][C]InterpolationForecast[/C][C]ResidualsPrediction Error[/C][/ROW]
[ROW][C]1[/C][C]1.1608[/C][C]1.10007326732673[/C][C]0.0607267326732693[/C][/ROW]
[ROW][C]2[/C][C]1.1208[/C][C]1.10007326732673[/C][C]0.0207267326732672[/C][/ROW]
[ROW][C]3[/C][C]1.0883[/C][C]1.10007326732673[/C][C]-0.0117732673267326[/C][/ROW]
[ROW][C]4[/C][C]1.0704[/C][C]1.10007326732673[/C][C]-0.0296732673267327[/C][/ROW]
[ROW][C]5[/C][C]1.0628[/C][C]1.10007326732673[/C][C]-0.0372732673267327[/C][/ROW]
[ROW][C]6[/C][C]1.0378[/C][C]1.10007326732673[/C][C]-0.0622732673267326[/C][/ROW]
[ROW][C]7[/C][C]1.0353[/C][C]1.10007326732673[/C][C]-0.0647732673267326[/C][/ROW]
[ROW][C]8[/C][C]1.0604[/C][C]1.10007326732673[/C][C]-0.0396732673267327[/C][/ROW]
[ROW][C]9[/C][C]1.0501[/C][C]1.10007326732673[/C][C]-0.0499732673267327[/C][/ROW]
[ROW][C]10[/C][C]1.0706[/C][C]1.10007326732673[/C][C]-0.0294732673267327[/C][/ROW]
[ROW][C]11[/C][C]1.0338[/C][C]1.10007326732673[/C][C]-0.0662732673267326[/C][/ROW]
[ROW][C]12[/C][C]1.011[/C][C]1.10007326732673[/C][C]-0.0890732673267328[/C][/ROW]
[ROW][C]13[/C][C]1.0137[/C][C]1.10007326732673[/C][C]-0.0863732673267327[/C][/ROW]
[ROW][C]14[/C][C]0.9834[/C][C]1.10007326732673[/C][C]-0.116673267326733[/C][/ROW]
[ROW][C]15[/C][C]0.9643[/C][C]1.10007326732673[/C][C]-0.135773267326733[/C][/ROW]
[ROW][C]16[/C][C]0.947[/C][C]1.10007326732673[/C][C]-0.153073267326733[/C][/ROW]
[ROW][C]17[/C][C]0.906[/C][C]1.10007326732673[/C][C]-0.194073267326733[/C][/ROW]
[ROW][C]18[/C][C]0.9492[/C][C]1.10007326732673[/C][C]-0.150873267326733[/C][/ROW]
[ROW][C]19[/C][C]0.9397[/C][C]1.10007326732673[/C][C]-0.160373267326733[/C][/ROW]
[ROW][C]20[/C][C]0.9041[/C][C]1.10007326732673[/C][C]-0.195973267326733[/C][/ROW]
[ROW][C]21[/C][C]0.8721[/C][C]1.10007326732673[/C][C]-0.227973267326733[/C][/ROW]
[ROW][C]22[/C][C]0.8552[/C][C]1.10007326732673[/C][C]-0.244873267326733[/C][/ROW]
[ROW][C]23[/C][C]0.8564[/C][C]1.10007326732673[/C][C]-0.243673267326733[/C][/ROW]
[ROW][C]24[/C][C]0.8973[/C][C]1.10007326732673[/C][C]-0.202773267326733[/C][/ROW]
[ROW][C]25[/C][C]0.9383[/C][C]1.10007326732673[/C][C]-0.161773267326733[/C][/ROW]
[ROW][C]26[/C][C]0.9217[/C][C]1.10007326732673[/C][C]-0.178373267326733[/C][/ROW]
[ROW][C]27[/C][C]0.9095[/C][C]1.10007326732673[/C][C]-0.190573267326733[/C][/ROW]
[ROW][C]28[/C][C]0.892[/C][C]1.10007326732673[/C][C]-0.208073267326733[/C][/ROW]
[ROW][C]29[/C][C]0.8742[/C][C]1.10007326732673[/C][C]-0.225873267326733[/C][/ROW]
[ROW][C]30[/C][C]0.8532[/C][C]1.10007326732673[/C][C]-0.246873267326733[/C][/ROW]
[ROW][C]31[/C][C]0.8607[/C][C]1.10007326732673[/C][C]-0.239373267326733[/C][/ROW]
[ROW][C]32[/C][C]0.9005[/C][C]1.10007326732673[/C][C]-0.199573267326733[/C][/ROW]
[ROW][C]33[/C][C]0.9111[/C][C]1.10007326732673[/C][C]-0.188973267326733[/C][/ROW]
[ROW][C]34[/C][C]0.9059[/C][C]1.10007326732673[/C][C]-0.194173267326733[/C][/ROW]
[ROW][C]35[/C][C]0.8883[/C][C]1.10007326732673[/C][C]-0.211773267326733[/C][/ROW]
[ROW][C]36[/C][C]0.8924[/C][C]1.10007326732673[/C][C]-0.207673267326733[/C][/ROW]
[ROW][C]37[/C][C]0.8833[/C][C]1.10007326732673[/C][C]-0.216773267326733[/C][/ROW]
[ROW][C]38[/C][C]0.87[/C][C]1.10007326732673[/C][C]-0.230073267326733[/C][/ROW]
[ROW][C]39[/C][C]0.8758[/C][C]1.10007326732673[/C][C]-0.224273267326733[/C][/ROW]
[ROW][C]40[/C][C]0.8858[/C][C]1.10007326732673[/C][C]-0.214273267326733[/C][/ROW]
[ROW][C]41[/C][C]0.917[/C][C]1.10007326732673[/C][C]-0.183073267326733[/C][/ROW]
[ROW][C]42[/C][C]0.9554[/C][C]1.10007326732673[/C][C]-0.144673267326733[/C][/ROW]
[ROW][C]43[/C][C]0.9922[/C][C]1.10007326732673[/C][C]-0.107873267326733[/C][/ROW]
[ROW][C]44[/C][C]0.9778[/C][C]1.10007326732673[/C][C]-0.122273267326733[/C][/ROW]
[ROW][C]45[/C][C]0.9808[/C][C]1.10007326732673[/C][C]-0.119273267326733[/C][/ROW]
[ROW][C]46[/C][C]0.9811[/C][C]1.10007326732673[/C][C]-0.118973267326733[/C][/ROW]
[ROW][C]47[/C][C]1.0014[/C][C]1.10007326732673[/C][C]-0.0986732673267326[/C][/ROW]
[ROW][C]48[/C][C]1.0183[/C][C]1.10007326732673[/C][C]-0.0817732673267327[/C][/ROW]
[ROW][C]49[/C][C]1.0622[/C][C]1.10007326732673[/C][C]-0.0378732673267327[/C][/ROW]
[ROW][C]50[/C][C]1.0773[/C][C]1.10007326732673[/C][C]-0.0227732673267328[/C][/ROW]
[ROW][C]51[/C][C]1.0807[/C][C]1.10007326732673[/C][C]-0.0193732673267327[/C][/ROW]
[ROW][C]52[/C][C]1.0848[/C][C]1.10007326732673[/C][C]-0.0152732673267327[/C][/ROW]
[ROW][C]53[/C][C]1.1582[/C][C]1.10007326732673[/C][C]0.0581267326732672[/C][/ROW]
[ROW][C]54[/C][C]1.1663[/C][C]1.10007326732673[/C][C]0.0662267326732672[/C][/ROW]
[ROW][C]55[/C][C]1.1372[/C][C]1.10007326732673[/C][C]0.0371267326732673[/C][/ROW]
[ROW][C]56[/C][C]1.1139[/C][C]1.10007326732673[/C][C]0.0138267326732672[/C][/ROW]
[ROW][C]57[/C][C]1.1222[/C][C]1.10007326732673[/C][C]0.0221267326732674[/C][/ROW]
[ROW][C]58[/C][C]1.1692[/C][C]1.10007326732673[/C][C]0.0691267326732673[/C][/ROW]
[ROW][C]59[/C][C]1.1702[/C][C]1.10007326732673[/C][C]0.0701267326732672[/C][/ROW]
[ROW][C]60[/C][C]1.2286[/C][C]1.10007326732673[/C][C]0.128526732673267[/C][/ROW]
[ROW][C]61[/C][C]1.2613[/C][C]1.10007326732673[/C][C]0.161226732673267[/C][/ROW]
[ROW][C]62[/C][C]1.2646[/C][C]1.10007326732673[/C][C]0.164526732673267[/C][/ROW]
[ROW][C]63[/C][C]1.2262[/C][C]1.10007326732673[/C][C]0.126126732673267[/C][/ROW]
[ROW][C]64[/C][C]1.1985[/C][C]1.10007326732673[/C][C]0.0984267326732672[/C][/ROW]
[ROW][C]65[/C][C]1.2007[/C][C]1.10007326732673[/C][C]0.100626732673267[/C][/ROW]
[ROW][C]66[/C][C]1.2138[/C][C]1.10007326732673[/C][C]0.113726732673267[/C][/ROW]
[ROW][C]67[/C][C]1.2266[/C][C]1.10007326732673[/C][C]0.126526732673267[/C][/ROW]
[ROW][C]68[/C][C]1.2176[/C][C]1.10007326732673[/C][C]0.117526732673267[/C][/ROW]
[ROW][C]69[/C][C]1.2218[/C][C]1.10007326732673[/C][C]0.121726732673267[/C][/ROW]
[ROW][C]70[/C][C]1.249[/C][C]1.10007326732673[/C][C]0.148926732673267[/C][/ROW]
[ROW][C]71[/C][C]1.2991[/C][C]1.10007326732673[/C][C]0.199026732673267[/C][/ROW]
[ROW][C]72[/C][C]1.3408[/C][C]1.10007326732673[/C][C]0.240726732673267[/C][/ROW]
[ROW][C]73[/C][C]1.3119[/C][C]1.10007326732673[/C][C]0.211826732673267[/C][/ROW]
[ROW][C]74[/C][C]1.3014[/C][C]1.10007326732673[/C][C]0.201326732673267[/C][/ROW]
[ROW][C]75[/C][C]1.3201[/C][C]1.10007326732673[/C][C]0.220026732673267[/C][/ROW]
[ROW][C]76[/C][C]1.2938[/C][C]1.10007326732673[/C][C]0.193726732673267[/C][/ROW]
[ROW][C]77[/C][C]1.2694[/C][C]1.10007326732673[/C][C]0.169326732673267[/C][/ROW]
[ROW][C]78[/C][C]1.2165[/C][C]1.10007326732673[/C][C]0.116426732673267[/C][/ROW]
[ROW][C]79[/C][C]1.2037[/C][C]1.10007326732673[/C][C]0.103626732673267[/C][/ROW]
[ROW][C]80[/C][C]1.2292[/C][C]1.10007326732673[/C][C]0.129126732673267[/C][/ROW]
[ROW][C]81[/C][C]1.2256[/C][C]1.10007326732673[/C][C]0.125526732673267[/C][/ROW]
[ROW][C]82[/C][C]1.2015[/C][C]1.10007326732673[/C][C]0.101426732673267[/C][/ROW]
[ROW][C]83[/C][C]1.1786[/C][C]1.10007326732673[/C][C]0.0785267326732674[/C][/ROW]
[ROW][C]84[/C][C]1.1856[/C][C]1.10007326732673[/C][C]0.0855267326732673[/C][/ROW]
[ROW][C]85[/C][C]1.2103[/C][C]1.10007326732673[/C][C]0.110226732673267[/C][/ROW]
[ROW][C]86[/C][C]1.1938[/C][C]1.10007326732673[/C][C]0.0937267326732673[/C][/ROW]
[ROW][C]87[/C][C]1.202[/C][C]1.10007326732673[/C][C]0.101926732673267[/C][/ROW]
[ROW][C]88[/C][C]1.2271[/C][C]1.10007326732673[/C][C]0.127026732673267[/C][/ROW]
[ROW][C]89[/C][C]1.277[/C][C]1.10007326732673[/C][C]0.176926732673267[/C][/ROW]
[ROW][C]90[/C][C]1.265[/C][C]1.10007326732673[/C][C]0.164926732673267[/C][/ROW]
[ROW][C]91[/C][C]1.2684[/C][C]1.10007326732673[/C][C]0.168326732673267[/C][/ROW]
[ROW][C]92[/C][C]1.2811[/C][C]1.10007326732673[/C][C]0.181026732673267[/C][/ROW]
[ROW][C]93[/C][C]1.2727[/C][C]1.10007326732673[/C][C]0.172626732673267[/C][/ROW]
[ROW][C]94[/C][C]1.2611[/C][C]1.10007326732673[/C][C]0.161026732673267[/C][/ROW]
[ROW][C]95[/C][C]1.2881[/C][C]1.10007326732673[/C][C]0.188026732673267[/C][/ROW]
[ROW][C]96[/C][C]1.3213[/C][C]1.10007326732673[/C][C]0.221226732673267[/C][/ROW]
[ROW][C]97[/C][C]1.2999[/C][C]1.10007326732673[/C][C]0.199826732673267[/C][/ROW]
[ROW][C]98[/C][C]1.3074[/C][C]1.10007326732673[/C][C]0.207326732673267[/C][/ROW]
[ROW][C]99[/C][C]1.3242[/C][C]1.10007326732673[/C][C]0.224126732673267[/C][/ROW]
[ROW][C]100[/C][C]1.3516[/C][C]1.10007326732673[/C][C]0.251526732673267[/C][/ROW]
[ROW][C]101[/C][C]1.3511[/C][C]1.10007326732673[/C][C]0.251026732673267[/C][/ROW]
[ROW][C]102[/C][C]1.3419[/C][C]1.4697[/C][C]-0.1278[/C][/ROW]
[ROW][C]103[/C][C]1.3716[/C][C]1.4697[/C][C]-0.0981[/C][/ROW]
[ROW][C]104[/C][C]1.3622[/C][C]1.4697[/C][C]-0.1075[/C][/ROW]
[ROW][C]105[/C][C]1.3896[/C][C]1.4697[/C][C]-0.0801[/C][/ROW]
[ROW][C]106[/C][C]1.4227[/C][C]1.4697[/C][C]-0.0469999999999999[/C][/ROW]
[ROW][C]107[/C][C]1.4684[/C][C]1.4697[/C][C]-0.00130000000000008[/C][/ROW]
[ROW][C]108[/C][C]1.457[/C][C]1.4697[/C][C]-0.0126999999999999[/C][/ROW]
[ROW][C]109[/C][C]1.4718[/C][C]1.4697[/C][C]0.00209999999999999[/C][/ROW]
[ROW][C]110[/C][C]1.4748[/C][C]1.4697[/C][C]0.0051000000000001[/C][/ROW]
[ROW][C]111[/C][C]1.5527[/C][C]1.4697[/C][C]0.083[/C][/ROW]
[ROW][C]112[/C][C]1.5751[/C][C]1.4697[/C][C]0.1054[/C][/ROW]
[ROW][C]113[/C][C]1.5557[/C][C]1.4697[/C][C]0.086[/C][/ROW]
[ROW][C]114[/C][C]1.5553[/C][C]1.4697[/C][C]0.0855999999999999[/C][/ROW]
[ROW][C]115[/C][C]1.577[/C][C]1.4697[/C][C]0.1073[/C][/ROW]
[/TABLE]
Source: https://freestatistics.org/blog/index.php?pk=25308&T=4

Globally Unique Identifier (entire table): ba.freestatistics.org/blog/index.php?pk=25308&T=4

As an alternative you can also use a QR Code:  

The GUIDs for individual cells are displayed in the table below:

Multiple Linear Regression - Actuals, Interpolation, and Residuals
Time or IndexActualsInterpolationForecastResidualsPrediction Error
11.16081.100073267326730.0607267326732693
21.12081.100073267326730.0207267326732672
31.08831.10007326732673-0.0117732673267326
41.07041.10007326732673-0.0296732673267327
51.06281.10007326732673-0.0372732673267327
61.03781.10007326732673-0.0622732673267326
71.03531.10007326732673-0.0647732673267326
81.06041.10007326732673-0.0396732673267327
91.05011.10007326732673-0.0499732673267327
101.07061.10007326732673-0.0294732673267327
111.03381.10007326732673-0.0662732673267326
121.0111.10007326732673-0.0890732673267328
131.01371.10007326732673-0.0863732673267327
140.98341.10007326732673-0.116673267326733
150.96431.10007326732673-0.135773267326733
160.9471.10007326732673-0.153073267326733
170.9061.10007326732673-0.194073267326733
180.94921.10007326732673-0.150873267326733
190.93971.10007326732673-0.160373267326733
200.90411.10007326732673-0.195973267326733
210.87211.10007326732673-0.227973267326733
220.85521.10007326732673-0.244873267326733
230.85641.10007326732673-0.243673267326733
240.89731.10007326732673-0.202773267326733
250.93831.10007326732673-0.161773267326733
260.92171.10007326732673-0.178373267326733
270.90951.10007326732673-0.190573267326733
280.8921.10007326732673-0.208073267326733
290.87421.10007326732673-0.225873267326733
300.85321.10007326732673-0.246873267326733
310.86071.10007326732673-0.239373267326733
320.90051.10007326732673-0.199573267326733
330.91111.10007326732673-0.188973267326733
340.90591.10007326732673-0.194173267326733
350.88831.10007326732673-0.211773267326733
360.89241.10007326732673-0.207673267326733
370.88331.10007326732673-0.216773267326733
380.871.10007326732673-0.230073267326733
390.87581.10007326732673-0.224273267326733
400.88581.10007326732673-0.214273267326733
410.9171.10007326732673-0.183073267326733
420.95541.10007326732673-0.144673267326733
430.99221.10007326732673-0.107873267326733
440.97781.10007326732673-0.122273267326733
450.98081.10007326732673-0.119273267326733
460.98111.10007326732673-0.118973267326733
471.00141.10007326732673-0.0986732673267326
481.01831.10007326732673-0.0817732673267327
491.06221.10007326732673-0.0378732673267327
501.07731.10007326732673-0.0227732673267328
511.08071.10007326732673-0.0193732673267327
521.08481.10007326732673-0.0152732673267327
531.15821.100073267326730.0581267326732672
541.16631.100073267326730.0662267326732672
551.13721.100073267326730.0371267326732673
561.11391.100073267326730.0138267326732672
571.12221.100073267326730.0221267326732674
581.16921.100073267326730.0691267326732673
591.17021.100073267326730.0701267326732672
601.22861.100073267326730.128526732673267
611.26131.100073267326730.161226732673267
621.26461.100073267326730.164526732673267
631.22621.100073267326730.126126732673267
641.19851.100073267326730.0984267326732672
651.20071.100073267326730.100626732673267
661.21381.100073267326730.113726732673267
671.22661.100073267326730.126526732673267
681.21761.100073267326730.117526732673267
691.22181.100073267326730.121726732673267
701.2491.100073267326730.148926732673267
711.29911.100073267326730.199026732673267
721.34081.100073267326730.240726732673267
731.31191.100073267326730.211826732673267
741.30141.100073267326730.201326732673267
751.32011.100073267326730.220026732673267
761.29381.100073267326730.193726732673267
771.26941.100073267326730.169326732673267
781.21651.100073267326730.116426732673267
791.20371.100073267326730.103626732673267
801.22921.100073267326730.129126732673267
811.22561.100073267326730.125526732673267
821.20151.100073267326730.101426732673267
831.17861.100073267326730.0785267326732674
841.18561.100073267326730.0855267326732673
851.21031.100073267326730.110226732673267
861.19381.100073267326730.0937267326732673
871.2021.100073267326730.101926732673267
881.22711.100073267326730.127026732673267
891.2771.100073267326730.176926732673267
901.2651.100073267326730.164926732673267
911.26841.100073267326730.168326732673267
921.28111.100073267326730.181026732673267
931.27271.100073267326730.172626732673267
941.26111.100073267326730.161026732673267
951.28811.100073267326730.188026732673267
961.32131.100073267326730.221226732673267
971.29991.100073267326730.199826732673267
981.30741.100073267326730.207326732673267
991.32421.100073267326730.224126732673267
1001.35161.100073267326730.251526732673267
1011.35111.100073267326730.251026732673267
1021.34191.4697-0.1278
1031.37161.4697-0.0981
1041.36221.4697-0.1075
1051.38961.4697-0.0801
1061.42271.4697-0.0469999999999999
1071.46841.4697-0.00130000000000008
1081.4571.4697-0.0126999999999999
1091.47181.46970.00209999999999999
1101.47481.46970.0051000000000001
1111.55271.46970.083
1121.57511.46970.1054
1131.55571.46970.086
1141.55531.46970.0855999999999999
1151.5771.46970.1073


Parameters (Session):
par1 = 1 ; par2 = Do not include Seasonal Dummies ; par3 = No Linear Trend ;
Parameters (R input):
par1 = 1 ; par2 = Do not include Seasonal Dummies ; par3 = No Linear Trend ;
R code (references can be found in the software module):
library(lattice)
par1 <- as.numeric(par1)
x <- t(y)
k <- length(x[1,])
n <- length(x[,1])
x1 <- cbind(x[,par1], x[,1:k!=par1])
mycolnames <- c(colnames(x)[par1], colnames(x)[1:k!=par1])
colnames(x1) <- mycolnames #colnames(x)[par1]
x <- x1
if (par3 == 'First Differences'){
x2 <- array(0, dim=c(n-1,k), dimnames=list(1:(n-1), paste('(1-B)',colnames(x),sep='')))
for (i in 1:n-1) {
for (j in 1:k) {
x2[i,j] <- x[i+1,j] - x[i,j]
}
}
x <- x2
}
if (par2 == 'Include Monthly Dummies'){
x2 <- array(0, dim=c(n,11), dimnames=list(1:n, paste('M', seq(1:11), sep ='')))
for (i in 1:11){
x2[seq(i,n,12),i] <- 1
}
x <- cbind(x, x2)
}
if (par2 == 'Include Quarterly Dummies'){
x2 <- array(0, dim=c(n,3), dimnames=list(1:n, paste('Q', seq(1:3), sep ='')))
for (i in 1:3){
x2[seq(i,n,4),i] <- 1
}
x <- cbind(x, x2)
}
k <- length(x[1,])
if (par3 == 'Linear Trend'){
x <- cbind(x, c(1:n))
colnames(x)[k+1] <- 't'
}
x
k <- length(x[1,])
df <- as.data.frame(x)
(mylm <- lm(df))
(mysum <- summary(mylm))
bitmap(file='test0.png')
plot(x[,1], type='l', main='Actuals and Interpolation', ylab='value of Actuals and Interpolation (dots)', xlab='time or index')
points(x[,1]-mysum$resid)
grid()
dev.off()
bitmap(file='test1.png')
plot(mysum$resid, type='b', pch=19, main='Residuals', ylab='value of Residuals', xlab='time or index')
grid()
dev.off()
bitmap(file='test2.png')
hist(mysum$resid, main='Residual Histogram', xlab='values of Residuals')
grid()
dev.off()
bitmap(file='test3.png')
densityplot(~mysum$resid,col='black',main='Residual Density Plot', xlab='values of Residuals')
dev.off()
bitmap(file='test4.png')
qqnorm(mysum$resid, main='Residual Normal Q-Q Plot')
grid()
dev.off()
(myerror <- as.ts(mysum$resid))
bitmap(file='test5.png')
dum <- cbind(lag(myerror,k=1),myerror)
dum
dum1 <- dum[2:length(myerror),]
dum1
z <- as.data.frame(dum1)
z
plot(z,main=paste('Residual Lag plot, lowess, and regression line'), ylab='values of Residuals', xlab='lagged values of Residuals')
lines(lowess(z))
abline(lm(z))
grid()
dev.off()
bitmap(file='test6.png')
acf(mysum$resid, lag.max=length(mysum$resid)/2, main='Residual Autocorrelation Function')
grid()
dev.off()
bitmap(file='test7.png')
pacf(mysum$resid, lag.max=length(mysum$resid)/2, main='Residual Partial Autocorrelation Function')
grid()
dev.off()
bitmap(file='test8.png')
opar <- par(mfrow = c(2,2), oma = c(0, 0, 1.1, 0))
plot(mylm, las = 1, sub='Residual Diagnostics')
par(opar)
dev.off()
load(file='createtable')
a<-table.start()
a<-table.row.start(a)
a<-table.element(a, 'Multiple Linear Regression - Estimated Regression Equation', 1, TRUE)
a<-table.row.end(a)
myeq <- colnames(x)[1]
myeq <- paste(myeq, '[t] = ', sep='')
for (i in 1:k){
if (mysum$coefficients[i,1] > 0) myeq <- paste(myeq, '+', '')
myeq <- paste(myeq, mysum$coefficients[i,1], sep=' ')
if (rownames(mysum$coefficients)[i] != '(Intercept)') {
myeq <- paste(myeq, rownames(mysum$coefficients)[i], sep='')
if (rownames(mysum$coefficients)[i] != 't') myeq <- paste(myeq, '[t]', sep='')
}
}
myeq <- paste(myeq, ' + e[t]')
a<-table.row.start(a)
a<-table.element(a, myeq)
a<-table.row.end(a)
a<-table.end(a)
table.save(a,file='mytable1.tab')
a<-table.start()
a<-table.row.start(a)
a<-table.element(a,hyperlink('ols1.htm','Multiple Linear Regression - Ordinary Least Squares',''), 6, TRUE)
a<-table.row.end(a)
a<-table.row.start(a)
a<-table.element(a,'Variable',header=TRUE)
a<-table.element(a,'Parameter',header=TRUE)
a<-table.element(a,'S.D.',header=TRUE)
a<-table.element(a,'T-STAT
H0: parameter = 0',header=TRUE)
a<-table.element(a,'2-tail p-value',header=TRUE)
a<-table.element(a,'1-tail p-value',header=TRUE)
a<-table.row.end(a)
for (i in 1:k){
a<-table.row.start(a)
a<-table.element(a,rownames(mysum$coefficients)[i],header=TRUE)
a<-table.element(a,mysum$coefficients[i,1])
a<-table.element(a, round(mysum$coefficients[i,2],6))
a<-table.element(a, round(mysum$coefficients[i,3],4))
a<-table.element(a, round(mysum$coefficients[i,4],6))
a<-table.element(a, round(mysum$coefficients[i,4]/2,6))
a<-table.row.end(a)
}
a<-table.end(a)
table.save(a,file='mytable2.tab')
a<-table.start()
a<-table.row.start(a)
a<-table.element(a, 'Multiple Linear Regression - Regression Statistics', 2, TRUE)
a<-table.row.end(a)
a<-table.row.start(a)
a<-table.element(a, 'Multiple R',1,TRUE)
a<-table.element(a, sqrt(mysum$r.squared))
a<-table.row.end(a)
a<-table.row.start(a)
a<-table.element(a, 'R-squared',1,TRUE)
a<-table.element(a, mysum$r.squared)
a<-table.row.end(a)
a<-table.row.start(a)
a<-table.element(a, 'Adjusted R-squared',1,TRUE)
a<-table.element(a, mysum$adj.r.squared)
a<-table.row.end(a)
a<-table.row.start(a)
a<-table.element(a, 'F-TEST (value)',1,TRUE)
a<-table.element(a, mysum$fstatistic[1])
a<-table.row.end(a)
a<-table.row.start(a)
a<-table.element(a, 'F-TEST (DF numerator)',1,TRUE)
a<-table.element(a, mysum$fstatistic[2])
a<-table.row.end(a)
a<-table.row.start(a)
a<-table.element(a, 'F-TEST (DF denominator)',1,TRUE)
a<-table.element(a, mysum$fstatistic[3])
a<-table.row.end(a)
a<-table.row.start(a)
a<-table.element(a, 'p-value',1,TRUE)
a<-table.element(a, 1-pf(mysum$fstatistic[1],mysum$fstatistic[2],mysum$fstatistic[3]))
a<-table.row.end(a)
a<-table.row.start(a)
a<-table.element(a, 'Multiple Linear Regression - Residual Statistics', 2, TRUE)
a<-table.row.end(a)
a<-table.row.start(a)
a<-table.element(a, 'Residual Standard Deviation',1,TRUE)
a<-table.element(a, mysum$sigma)
a<-table.row.end(a)
a<-table.row.start(a)
a<-table.element(a, 'Sum Squared Residuals',1,TRUE)
a<-table.element(a, sum(myerror*myerror))
a<-table.row.end(a)
a<-table.end(a)
table.save(a,file='mytable3.tab')
a<-table.start()
a<-table.row.start(a)
a<-table.element(a, 'Multiple Linear Regression - Actuals, Interpolation, and Residuals', 4, TRUE)
a<-table.row.end(a)
a<-table.row.start(a)
a<-table.element(a, 'Time or Index', 1, TRUE)
a<-table.element(a, 'Actuals', 1, TRUE)
a<-table.element(a, 'Interpolation
Forecast', 1, TRUE)
a<-table.element(a, 'Residuals
Prediction Error', 1, TRUE)
a<-table.row.end(a)
for (i in 1:n) {
a<-table.row.start(a)
a<-table.element(a,i, 1, TRUE)
a<-table.element(a,x[i])
a<-table.element(a,x[i]-mysum$resid[i])
a<-table.element(a,mysum$resid[i])
a<-table.row.end(a)
}
a<-table.end(a)
table.save(a,file='mytable4.tab')