Free Statistics

of Irreproducible Research!

Author's title

Author*The author of this computation has been verified*
R Software Modulerwasp_multipleregression.wasp
Title produced by softwareMultiple Regression
Date of computationSun, 23 Nov 2008 08:44:49 -0700
Cite this page as followsStatistical Computations at FreeStatistics.org, Office for Research Development and Education, URL https://freestatistics.org/blog/index.php?v=date/2008/Nov/23/t1227455309gqas9hrtfxvzzn4.htm/, Retrieved Sat, 18 May 2024 03:02:03 +0000
Statistical Computations at FreeStatistics.org, Office for Research Development and Education, URL https://freestatistics.org/blog/index.php?pk=25288, Retrieved Sat, 18 May 2024 03:02:03 +0000
QR Codes:

Original text written by user:
IsPrivate?No (this computation is public)
User-defined keywords
Estimated Impact170
Family? (F = Feedback message, R = changed R code, M = changed R Module, P = changed Parameters, D = changed Data)
F     [Multiple Regression] [] [2007-11-19 19:55:31] [b731da8b544846036771bbf9bf2f34ce]
F    D    [Multiple Regression] [investeringsgoede...] [2008-11-23 15:44:49] [09074fbe368d26382bb94e5bb318a104] [Current]
F           [Multiple Regression] [Q3:Multiple linea...] [2008-11-23 20:06:21] [12d343c4448a5f9e527bb31caeac580b]
F             [Multiple Regression] [Investeringen zon...] [2008-11-27 20:13:40] [7a664918911e34206ce9d0436dd7c1c8]
Feedback Forum
2008-11-28 15:26:16 [Annemiek Hoofman] [reply
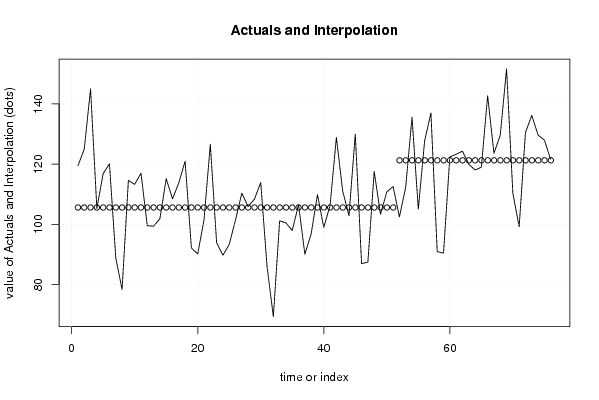
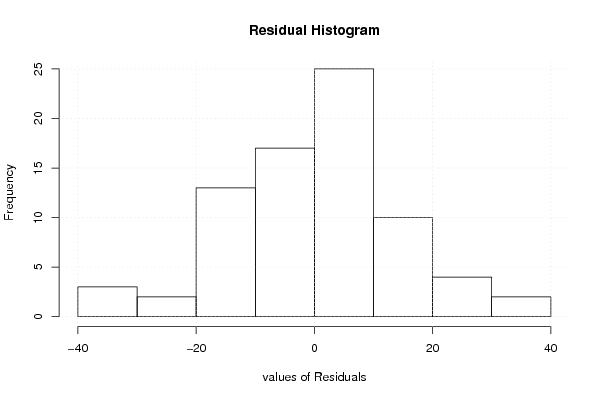
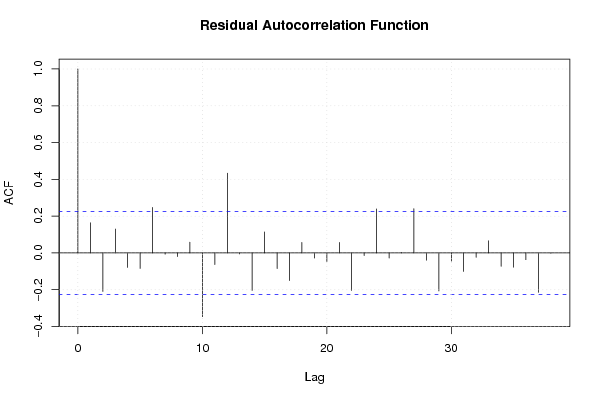
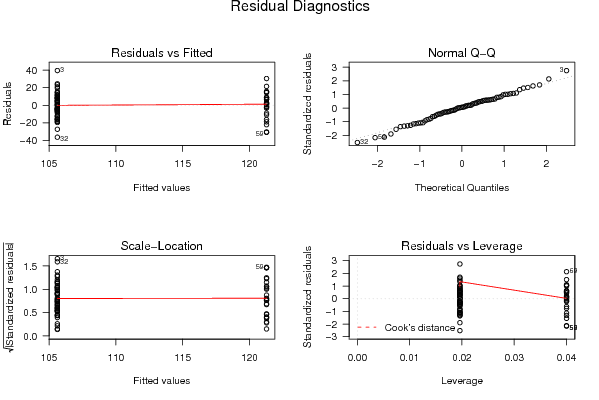
Je kan wat meer zeggen over de verschillende grafieken en tabellen: de intercept, de dummie-variabele en de maand juni hebben een 2-tailed p-value die lager is dan 0.05, dwz dat ze significant verschillend zijn van de 0-hypothese die gelijk is aan 0. Zij zijn dus niet te wijten aan het toeval. De adjusted R-squared is idd veel te laag om alles te kunnen verklaren. De bolletjes op de actuals and interpolation-grafiek vertonen geen echte trend, misschien wel iets wat lijkt op een dalparabool. In de residual histogram zijn niet de gegevens normaal verdeeld, maar wel de voorspellingsfouten. Ik denk dat er in de les gezegd is geweest dat je bij de grafiek van de residual autocorrelation function geen rekening moet houden met het eerste streepje (dat er hier ongelooflijk bovenuit steekt).
Om Q4 op te lossen, moet je de gegevens van de raw output importeren in excel en de formule gebruiken, die je terugvindt in de tabel 'Multiple Linear Regression - Estimated Regression Equation', om toekomstige resultaten te voorspellen, samen met de D, M en t die je reeds kent.
2008-12-01 15:26:27 [Jonas Janssens] [reply
-Grafiek 'Residual Histogram': Volgens mij is die grafiek geen weergave van een normaalverdeling, ze komt in de buurt, maar er zijn nog te veel verschillen tov een normaalverdeling: de top ligt iets meer naar links, hierdoor is er een lichte rechtse scheefheid, helemaal rechts stijgt de staart nog een beetje (wat bij een normaalverdeling dalend zou moeten zijn).
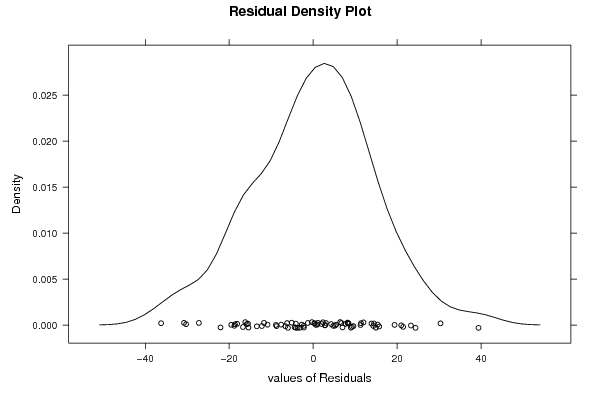
-Grafiek 'Residual density plot': Zoals bij de vorige grafiek is er dit geen normaalverdeling, om dezelfde redenen: de top licht meer naar links en rechtse scheefheid.
2008-12-01 16:15:12 [Loïque Verhasselt] [reply
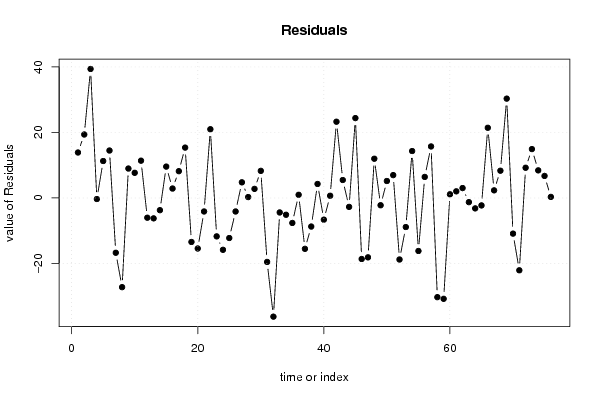
Q3: De student vermeld niet wat ze gaat onderzoeken. Als we de gebeurtenis van de verandering in de tijdreeks niet weten moeten we dit ook vermelden. Maar toch genoeg om het te onderzoeken. De student kijkt naar de R² en vind dat ze maar een lage waarde vind. Deze waarde is zeker geen toeval omdat we een zeer lage p-value krijgen. De student heeft de tabel(Ordinary Least Squares) niet toegelicht waar belangrijke informatie in te vinden is. Omdat we niet weten wat de gebeurtenis inhoud kijken we dus naar de 2-tailed p-value die bijna voor alle maanden groter is dan de alpha fout van 5% wat wil zeggen dat er geen sprake is van seizoenaliteit maar dat deze veroorzaakt is door het toeval.Aan de Residuals zien we duidelijk dat het gemiddelde van de voorspellingsfout niet rond de 0 gaat liggen. Dit is dus geen volledig correct model.
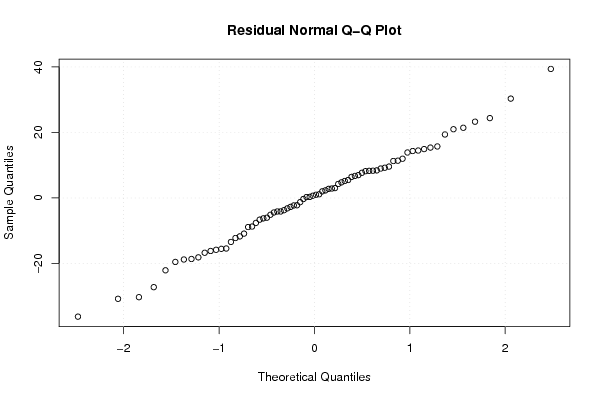
We zien bij het histogram en het density een iets of wat normale verdeling, we kunnen ons hierover niet echt uitspreken. Hetzelfde voor het QQ plot, ze sluiten redelijk goed aan bij de rechte.
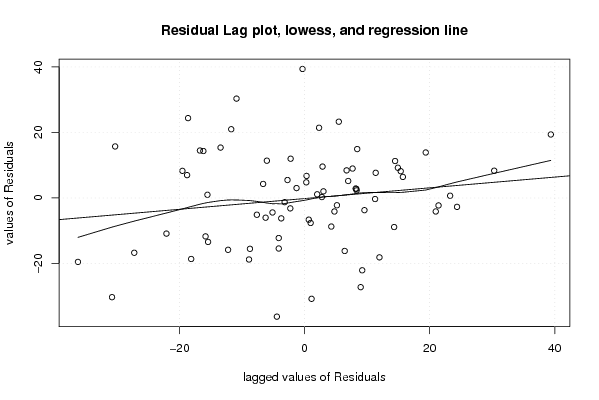
Maar als we gaan kijken naar de Residual Lag plot zien we dat er een positief verband waardoor de residuals voorspelbaar zijn op basis van het verleden wat geen goed teken is. Om dit te bevestigen zien we ook nog naar Residual Autocorrelation function waar vooral in het beging enkele de 0,05 grens overschrijden waardoor we kunnen vaststellen dat we geen correct model beschrijven.
2008-12-01 16:36:22 [Anouk Greeve] [reply
Ik kan er ook niet goed aan uit wat er nu net onderzocht wordt. De student had inderdaad wat meer toelichting kunnen geven bij de verschillende grafieken.

Post a new message
Dataseries X:
119.5	0
125	0
145	0
105.3	0
116.9	0
120.1	0
88.9	0
78.4	0
114.6	0
113.3	0
117	0
99.6	0
99.4	0
101.9	0
115.2	0
108.5	0
113.8	0
121	0
92.2	0
90.2	0
101.5	0
126.6	0
93.9	0
89.8	0
93.4	0
101.5	0
110.4	0
105.9	0
108.4	0
113.9	0
86.1	0
69.4	0
101.2	0
100.5	0
98	0
106.6	0
90.1	0
96.9	0
109.9	0
99	0
106.3	0
128.9	0
111.1	0
102.9	0
130	0
87	0
87.5	0
117.6	0
103.4	0
110.8	0
112.6	0
102.5	1
112.4	1
135.6	1
105.1	1
127.7	1
137	1
91	1
90.5	1
122.4	1
123.3	1
124.3	1
120	1
118.1	1
119	1
142.7	1
123.6	1
129.6	1
151.6	1
110.4	1
99.2	1
130.5	1
136.2	1
129.7	1
128	1
121.6	1


Summary of computational transaction
Raw Inputview raw input (R code)
Raw Outputview raw output of R engine
Computing time8 seconds
R Server'Herman Ole Andreas Wold' @ 193.190.124.10:1001

\begin{tabular}{lllllllll}
\hline
Summary of computational transaction \tabularnewline
Raw Input & view raw input (R code)  \tabularnewline
Raw Output & view raw output of R engine  \tabularnewline
Computing time & 8 seconds \tabularnewline
R Server & 'Herman Ole Andreas Wold' @ 193.190.124.10:1001 \tabularnewline
\hline
\end{tabular}
%Source: https://freestatistics.org/blog/index.php?pk=25288&T=0

[TABLE]
[ROW][C]Summary of computational transaction[/C][/ROW]
[ROW][C]Raw Input[/C][C]view raw input (R code) [/C][/ROW]
[ROW][C]Raw Output[/C][C]view raw output of R engine [/C][/ROW]
[ROW][C]Computing time[/C][C]8 seconds[/C][/ROW]
[ROW][C]R Server[/C][C]'Herman Ole Andreas Wold' @ 193.190.124.10:1001[/C][/ROW]
[/TABLE]
Source: https://freestatistics.org/blog/index.php?pk=25288&T=0

Globally Unique Identifier (entire table): ba.freestatistics.org/blog/index.php?pk=25288&T=0

As an alternative you can also use a QR Code:  

The GUIDs for individual cells are displayed in the table below:

Summary of computational transaction
Raw Inputview raw input (R code)
Raw Outputview raw output of R engine
Computing time8 seconds
R Server'Herman Ole Andreas Wold' @ 193.190.124.10:1001


Multiple Linear Regression - Estimated Regression Equation
y[t] = + 105.625490196078 + 15.6545098039216x[t] + e[t]

\begin{tabular}{lllllllll}
\hline
Multiple Linear Regression - Estimated Regression Equation \tabularnewline
y[t] =  +  105.625490196078 +  15.6545098039216x[t]  + e[t] \tabularnewline
\hline
\end{tabular}
%Source: https://freestatistics.org/blog/index.php?pk=25288&T=1

[TABLE]
[ROW][C]Multiple Linear Regression - Estimated Regression Equation[/C][/ROW]
[ROW][C]y[t] =  +  105.625490196078 +  15.6545098039216x[t]  + e[t][/C][/ROW]
[/TABLE]
Source: https://freestatistics.org/blog/index.php?pk=25288&T=1

Globally Unique Identifier (entire table): ba.freestatistics.org/blog/index.php?pk=25288&T=1

As an alternative you can also use a QR Code:  

The GUIDs for individual cells are displayed in the table below:

Multiple Linear Regression - Estimated Regression Equation
y[t] = + 105.625490196078 + 15.6545098039216x[t] + e[t]


Multiple Linear Regression - Ordinary Least Squares
VariableParameterS.D.T-STATH0: parameter = 02-tail p-value1-tail p-value
(Intercept)105.6254901960782.0318751.984400
x15.65450980392163.5426864.41883.3e-051.7e-05

\begin{tabular}{lllllllll}
\hline
Multiple Linear Regression - Ordinary Least Squares \tabularnewline
Variable & Parameter & S.D. & T-STATH0: parameter = 0 & 2-tail p-value & 1-tail p-value \tabularnewline
(Intercept) & 105.625490196078 & 2.03187 & 51.9844 & 0 & 0 \tabularnewline
x & 15.6545098039216 & 3.542686 & 4.4188 & 3.3e-05 & 1.7e-05 \tabularnewline
\hline
\end{tabular}
%Source: https://freestatistics.org/blog/index.php?pk=25288&T=2

[TABLE]
[ROW][C]Multiple Linear Regression - Ordinary Least Squares[/C][/ROW]
[ROW][C]Variable[/C][C]Parameter[/C][C]S.D.[/C][C]T-STATH0: parameter = 0[/C][C]2-tail p-value[/C][C]1-tail p-value[/C][/ROW]
[ROW][C](Intercept)[/C][C]105.625490196078[/C][C]2.03187[/C][C]51.9844[/C][C]0[/C][C]0[/C][/ROW]
[ROW][C]x[/C][C]15.6545098039216[/C][C]3.542686[/C][C]4.4188[/C][C]3.3e-05[/C][C]1.7e-05[/C][/ROW]
[/TABLE]
Source: https://freestatistics.org/blog/index.php?pk=25288&T=2

Globally Unique Identifier (entire table): ba.freestatistics.org/blog/index.php?pk=25288&T=2

As an alternative you can also use a QR Code:  

The GUIDs for individual cells are displayed in the table below:

Multiple Linear Regression - Ordinary Least Squares
VariableParameterS.D.T-STATH0: parameter = 02-tail p-value1-tail p-value
(Intercept)105.6254901960782.0318751.984400
x15.65450980392163.5426864.41883.3e-051.7e-05


Multiple Linear Regression - Regression Statistics
Multiple R0.456920478182541
R-squared0.208776323382562
Adjusted R-squared0.198084111536381
F-TEST (value)19.5260182257912
F-TEST (DF numerator)1
F-TEST (DF denominator)74
p-value3.33876032617697e-05
Multiple Linear Regression - Residual Statistics
Residual Standard Deviation14.5104514350142
Sum Squared Residuals15580.9368627451

\begin{tabular}{lllllllll}
\hline
Multiple Linear Regression - Regression Statistics \tabularnewline
Multiple R & 0.456920478182541 \tabularnewline
R-squared & 0.208776323382562 \tabularnewline
Adjusted R-squared & 0.198084111536381 \tabularnewline
F-TEST (value) & 19.5260182257912 \tabularnewline
F-TEST (DF numerator) & 1 \tabularnewline
F-TEST (DF denominator) & 74 \tabularnewline
p-value & 3.33876032617697e-05 \tabularnewline
Multiple Linear Regression - Residual Statistics \tabularnewline
Residual Standard Deviation & 14.5104514350142 \tabularnewline
Sum Squared Residuals & 15580.9368627451 \tabularnewline
\hline
\end{tabular}
%Source: https://freestatistics.org/blog/index.php?pk=25288&T=3

[TABLE]
[ROW][C]Multiple Linear Regression - Regression Statistics[/C][/ROW]
[ROW][C]Multiple R[/C][C]0.456920478182541[/C][/ROW]
[ROW][C]R-squared[/C][C]0.208776323382562[/C][/ROW]
[ROW][C]Adjusted R-squared[/C][C]0.198084111536381[/C][/ROW]
[ROW][C]F-TEST (value)[/C][C]19.5260182257912[/C][/ROW]
[ROW][C]F-TEST (DF numerator)[/C][C]1[/C][/ROW]
[ROW][C]F-TEST (DF denominator)[/C][C]74[/C][/ROW]
[ROW][C]p-value[/C][C]3.33876032617697e-05[/C][/ROW]
[ROW][C]Multiple Linear Regression - Residual Statistics[/C][/ROW]
[ROW][C]Residual Standard Deviation[/C][C]14.5104514350142[/C][/ROW]
[ROW][C]Sum Squared Residuals[/C][C]15580.9368627451[/C][/ROW]
[/TABLE]
Source: https://freestatistics.org/blog/index.php?pk=25288&T=3

Globally Unique Identifier (entire table): ba.freestatistics.org/blog/index.php?pk=25288&T=3

As an alternative you can also use a QR Code:  

The GUIDs for individual cells are displayed in the table below:

Multiple Linear Regression - Regression Statistics
Multiple R0.456920478182541
R-squared0.208776323382562
Adjusted R-squared0.198084111536381
F-TEST (value)19.5260182257912
F-TEST (DF numerator)1
F-TEST (DF denominator)74
p-value3.33876032617697e-05
Multiple Linear Regression - Residual Statistics
Residual Standard Deviation14.5104514350142
Sum Squared Residuals15580.9368627451


Multiple Linear Regression - Actuals, Interpolation, and Residuals
Time or IndexActualsInterpolationForecastResidualsPrediction Error
1119.5105.62549019607813.8745098039215
2125105.62549019607819.3745098039216
3145105.62549019607839.3745098039216
4105.3105.625490196078-0.325490196078433
5116.9105.62549019607811.2745098039216
6120.1105.62549019607814.4745098039216
788.9105.625490196078-16.7254901960784
878.4105.625490196078-27.2254901960784
9114.6105.6254901960788.97450980392156
10113.3105.6254901960787.67450980392157
11117105.62549019607811.3745098039216
1299.6105.625490196078-6.02549019607844
1399.4105.625490196078-6.22549019607842
14101.9105.625490196078-3.72549019607842
15115.2105.6254901960789.57450980392157
16108.5105.6254901960782.87450980392157
17113.8105.6254901960788.17450980392157
18121105.62549019607815.3745098039216
1992.2105.625490196078-13.4254901960784
2090.2105.625490196078-15.4254901960784
21101.5105.625490196078-4.12549019607843
22126.6105.62549019607820.9745098039216
2393.9105.625490196078-11.7254901960784
2489.8105.625490196078-15.8254901960784
2593.4105.625490196078-12.2254901960784
26101.5105.625490196078-4.12549019607843
27110.4105.6254901960784.77450980392157
28105.9105.6254901960780.274509803921575
29108.4105.6254901960782.77450980392158
30113.9105.6254901960788.27450980392157
3186.1105.625490196078-19.5254901960784
3269.4105.625490196078-36.2254901960784
33101.2105.625490196078-4.42549019607843
34100.5105.625490196078-5.12549019607843
3598105.625490196078-7.62549019607843
36106.6105.6254901960780.974509803921564
3790.1105.625490196078-15.5254901960784
3896.9105.625490196078-8.72549019607842
39109.9105.6254901960784.27450980392157
4099105.625490196078-6.62549019607843
41106.3105.6254901960780.674509803921567
42128.9105.62549019607823.2745098039216
43111.1105.6254901960785.47450980392156
44102.9105.625490196078-2.72549019607842
45130105.62549019607824.3745098039216
4687105.625490196078-18.6254901960784
4787.5105.625490196078-18.1254901960784
48117.6105.62549019607811.9745098039216
49103.4105.625490196078-2.22549019607842
50110.8105.6254901960785.17450980392157
51112.6105.6254901960786.97450980392156
52102.5121.28-18.78
53112.4121.28-8.88
54135.6121.2814.32
55105.1121.28-16.18
56127.7121.286.42
57137121.2815.72
5891121.28-30.28
5990.5121.28-30.78
60122.4121.281.12000000000001
61123.3121.282.02
62124.3121.283.02
63120121.28-1.28000000000000
64118.1121.28-3.18
65119121.28-2.28000000000000
66142.7121.2821.42
67123.6121.282.32000000000000
68129.6121.288.32
69151.6121.2830.32
70110.4121.28-10.88
7199.2121.28-22.08
72130.5121.289.22
73136.2121.2814.92
74129.7121.288.41999999999999
75128121.286.72
76121.6121.280.319999999999997

\begin{tabular}{lllllllll}
\hline
Multiple Linear Regression - Actuals, Interpolation, and Residuals \tabularnewline
Time or Index & Actuals & InterpolationForecast & ResidualsPrediction Error \tabularnewline
1 & 119.5 & 105.625490196078 & 13.8745098039215 \tabularnewline
2 & 125 & 105.625490196078 & 19.3745098039216 \tabularnewline
3 & 145 & 105.625490196078 & 39.3745098039216 \tabularnewline
4 & 105.3 & 105.625490196078 & -0.325490196078433 \tabularnewline
5 & 116.9 & 105.625490196078 & 11.2745098039216 \tabularnewline
6 & 120.1 & 105.625490196078 & 14.4745098039216 \tabularnewline
7 & 88.9 & 105.625490196078 & -16.7254901960784 \tabularnewline
8 & 78.4 & 105.625490196078 & -27.2254901960784 \tabularnewline
9 & 114.6 & 105.625490196078 & 8.97450980392156 \tabularnewline
10 & 113.3 & 105.625490196078 & 7.67450980392157 \tabularnewline
11 & 117 & 105.625490196078 & 11.3745098039216 \tabularnewline
12 & 99.6 & 105.625490196078 & -6.02549019607844 \tabularnewline
13 & 99.4 & 105.625490196078 & -6.22549019607842 \tabularnewline
14 & 101.9 & 105.625490196078 & -3.72549019607842 \tabularnewline
15 & 115.2 & 105.625490196078 & 9.57450980392157 \tabularnewline
16 & 108.5 & 105.625490196078 & 2.87450980392157 \tabularnewline
17 & 113.8 & 105.625490196078 & 8.17450980392157 \tabularnewline
18 & 121 & 105.625490196078 & 15.3745098039216 \tabularnewline
19 & 92.2 & 105.625490196078 & -13.4254901960784 \tabularnewline
20 & 90.2 & 105.625490196078 & -15.4254901960784 \tabularnewline
21 & 101.5 & 105.625490196078 & -4.12549019607843 \tabularnewline
22 & 126.6 & 105.625490196078 & 20.9745098039216 \tabularnewline
23 & 93.9 & 105.625490196078 & -11.7254901960784 \tabularnewline
24 & 89.8 & 105.625490196078 & -15.8254901960784 \tabularnewline
25 & 93.4 & 105.625490196078 & -12.2254901960784 \tabularnewline
26 & 101.5 & 105.625490196078 & -4.12549019607843 \tabularnewline
27 & 110.4 & 105.625490196078 & 4.77450980392157 \tabularnewline
28 & 105.9 & 105.625490196078 & 0.274509803921575 \tabularnewline
29 & 108.4 & 105.625490196078 & 2.77450980392158 \tabularnewline
30 & 113.9 & 105.625490196078 & 8.27450980392157 \tabularnewline
31 & 86.1 & 105.625490196078 & -19.5254901960784 \tabularnewline
32 & 69.4 & 105.625490196078 & -36.2254901960784 \tabularnewline
33 & 101.2 & 105.625490196078 & -4.42549019607843 \tabularnewline
34 & 100.5 & 105.625490196078 & -5.12549019607843 \tabularnewline
35 & 98 & 105.625490196078 & -7.62549019607843 \tabularnewline
36 & 106.6 & 105.625490196078 & 0.974509803921564 \tabularnewline
37 & 90.1 & 105.625490196078 & -15.5254901960784 \tabularnewline
38 & 96.9 & 105.625490196078 & -8.72549019607842 \tabularnewline
39 & 109.9 & 105.625490196078 & 4.27450980392157 \tabularnewline
40 & 99 & 105.625490196078 & -6.62549019607843 \tabularnewline
41 & 106.3 & 105.625490196078 & 0.674509803921567 \tabularnewline
42 & 128.9 & 105.625490196078 & 23.2745098039216 \tabularnewline
43 & 111.1 & 105.625490196078 & 5.47450980392156 \tabularnewline
44 & 102.9 & 105.625490196078 & -2.72549019607842 \tabularnewline
45 & 130 & 105.625490196078 & 24.3745098039216 \tabularnewline
46 & 87 & 105.625490196078 & -18.6254901960784 \tabularnewline
47 & 87.5 & 105.625490196078 & -18.1254901960784 \tabularnewline
48 & 117.6 & 105.625490196078 & 11.9745098039216 \tabularnewline
49 & 103.4 & 105.625490196078 & -2.22549019607842 \tabularnewline
50 & 110.8 & 105.625490196078 & 5.17450980392157 \tabularnewline
51 & 112.6 & 105.625490196078 & 6.97450980392156 \tabularnewline
52 & 102.5 & 121.28 & -18.78 \tabularnewline
53 & 112.4 & 121.28 & -8.88 \tabularnewline
54 & 135.6 & 121.28 & 14.32 \tabularnewline
55 & 105.1 & 121.28 & -16.18 \tabularnewline
56 & 127.7 & 121.28 & 6.42 \tabularnewline
57 & 137 & 121.28 & 15.72 \tabularnewline
58 & 91 & 121.28 & -30.28 \tabularnewline
59 & 90.5 & 121.28 & -30.78 \tabularnewline
60 & 122.4 & 121.28 & 1.12000000000001 \tabularnewline
61 & 123.3 & 121.28 & 2.02 \tabularnewline
62 & 124.3 & 121.28 & 3.02 \tabularnewline
63 & 120 & 121.28 & -1.28000000000000 \tabularnewline
64 & 118.1 & 121.28 & -3.18 \tabularnewline
65 & 119 & 121.28 & -2.28000000000000 \tabularnewline
66 & 142.7 & 121.28 & 21.42 \tabularnewline
67 & 123.6 & 121.28 & 2.32000000000000 \tabularnewline
68 & 129.6 & 121.28 & 8.32 \tabularnewline
69 & 151.6 & 121.28 & 30.32 \tabularnewline
70 & 110.4 & 121.28 & -10.88 \tabularnewline
71 & 99.2 & 121.28 & -22.08 \tabularnewline
72 & 130.5 & 121.28 & 9.22 \tabularnewline
73 & 136.2 & 121.28 & 14.92 \tabularnewline
74 & 129.7 & 121.28 & 8.41999999999999 \tabularnewline
75 & 128 & 121.28 & 6.72 \tabularnewline
76 & 121.6 & 121.28 & 0.319999999999997 \tabularnewline
\hline
\end{tabular}
%Source: https://freestatistics.org/blog/index.php?pk=25288&T=4

[TABLE]
[ROW][C]Multiple Linear Regression - Actuals, Interpolation, and Residuals[/C][/ROW]
[ROW][C]Time or Index[/C][C]Actuals[/C][C]InterpolationForecast[/C][C]ResidualsPrediction Error[/C][/ROW]
[ROW][C]1[/C][C]119.5[/C][C]105.625490196078[/C][C]13.8745098039215[/C][/ROW]
[ROW][C]2[/C][C]125[/C][C]105.625490196078[/C][C]19.3745098039216[/C][/ROW]
[ROW][C]3[/C][C]145[/C][C]105.625490196078[/C][C]39.3745098039216[/C][/ROW]
[ROW][C]4[/C][C]105.3[/C][C]105.625490196078[/C][C]-0.325490196078433[/C][/ROW]
[ROW][C]5[/C][C]116.9[/C][C]105.625490196078[/C][C]11.2745098039216[/C][/ROW]
[ROW][C]6[/C][C]120.1[/C][C]105.625490196078[/C][C]14.4745098039216[/C][/ROW]
[ROW][C]7[/C][C]88.9[/C][C]105.625490196078[/C][C]-16.7254901960784[/C][/ROW]
[ROW][C]8[/C][C]78.4[/C][C]105.625490196078[/C][C]-27.2254901960784[/C][/ROW]
[ROW][C]9[/C][C]114.6[/C][C]105.625490196078[/C][C]8.97450980392156[/C][/ROW]
[ROW][C]10[/C][C]113.3[/C][C]105.625490196078[/C][C]7.67450980392157[/C][/ROW]
[ROW][C]11[/C][C]117[/C][C]105.625490196078[/C][C]11.3745098039216[/C][/ROW]
[ROW][C]12[/C][C]99.6[/C][C]105.625490196078[/C][C]-6.02549019607844[/C][/ROW]
[ROW][C]13[/C][C]99.4[/C][C]105.625490196078[/C][C]-6.22549019607842[/C][/ROW]
[ROW][C]14[/C][C]101.9[/C][C]105.625490196078[/C][C]-3.72549019607842[/C][/ROW]
[ROW][C]15[/C][C]115.2[/C][C]105.625490196078[/C][C]9.57450980392157[/C][/ROW]
[ROW][C]16[/C][C]108.5[/C][C]105.625490196078[/C][C]2.87450980392157[/C][/ROW]
[ROW][C]17[/C][C]113.8[/C][C]105.625490196078[/C][C]8.17450980392157[/C][/ROW]
[ROW][C]18[/C][C]121[/C][C]105.625490196078[/C][C]15.3745098039216[/C][/ROW]
[ROW][C]19[/C][C]92.2[/C][C]105.625490196078[/C][C]-13.4254901960784[/C][/ROW]
[ROW][C]20[/C][C]90.2[/C][C]105.625490196078[/C][C]-15.4254901960784[/C][/ROW]
[ROW][C]21[/C][C]101.5[/C][C]105.625490196078[/C][C]-4.12549019607843[/C][/ROW]
[ROW][C]22[/C][C]126.6[/C][C]105.625490196078[/C][C]20.9745098039216[/C][/ROW]
[ROW][C]23[/C][C]93.9[/C][C]105.625490196078[/C][C]-11.7254901960784[/C][/ROW]
[ROW][C]24[/C][C]89.8[/C][C]105.625490196078[/C][C]-15.8254901960784[/C][/ROW]
[ROW][C]25[/C][C]93.4[/C][C]105.625490196078[/C][C]-12.2254901960784[/C][/ROW]
[ROW][C]26[/C][C]101.5[/C][C]105.625490196078[/C][C]-4.12549019607843[/C][/ROW]
[ROW][C]27[/C][C]110.4[/C][C]105.625490196078[/C][C]4.77450980392157[/C][/ROW]
[ROW][C]28[/C][C]105.9[/C][C]105.625490196078[/C][C]0.274509803921575[/C][/ROW]
[ROW][C]29[/C][C]108.4[/C][C]105.625490196078[/C][C]2.77450980392158[/C][/ROW]
[ROW][C]30[/C][C]113.9[/C][C]105.625490196078[/C][C]8.27450980392157[/C][/ROW]
[ROW][C]31[/C][C]86.1[/C][C]105.625490196078[/C][C]-19.5254901960784[/C][/ROW]
[ROW][C]32[/C][C]69.4[/C][C]105.625490196078[/C][C]-36.2254901960784[/C][/ROW]
[ROW][C]33[/C][C]101.2[/C][C]105.625490196078[/C][C]-4.42549019607843[/C][/ROW]
[ROW][C]34[/C][C]100.5[/C][C]105.625490196078[/C][C]-5.12549019607843[/C][/ROW]
[ROW][C]35[/C][C]98[/C][C]105.625490196078[/C][C]-7.62549019607843[/C][/ROW]
[ROW][C]36[/C][C]106.6[/C][C]105.625490196078[/C][C]0.974509803921564[/C][/ROW]
[ROW][C]37[/C][C]90.1[/C][C]105.625490196078[/C][C]-15.5254901960784[/C][/ROW]
[ROW][C]38[/C][C]96.9[/C][C]105.625490196078[/C][C]-8.72549019607842[/C][/ROW]
[ROW][C]39[/C][C]109.9[/C][C]105.625490196078[/C][C]4.27450980392157[/C][/ROW]
[ROW][C]40[/C][C]99[/C][C]105.625490196078[/C][C]-6.62549019607843[/C][/ROW]
[ROW][C]41[/C][C]106.3[/C][C]105.625490196078[/C][C]0.674509803921567[/C][/ROW]
[ROW][C]42[/C][C]128.9[/C][C]105.625490196078[/C][C]23.2745098039216[/C][/ROW]
[ROW][C]43[/C][C]111.1[/C][C]105.625490196078[/C][C]5.47450980392156[/C][/ROW]
[ROW][C]44[/C][C]102.9[/C][C]105.625490196078[/C][C]-2.72549019607842[/C][/ROW]
[ROW][C]45[/C][C]130[/C][C]105.625490196078[/C][C]24.3745098039216[/C][/ROW]
[ROW][C]46[/C][C]87[/C][C]105.625490196078[/C][C]-18.6254901960784[/C][/ROW]
[ROW][C]47[/C][C]87.5[/C][C]105.625490196078[/C][C]-18.1254901960784[/C][/ROW]
[ROW][C]48[/C][C]117.6[/C][C]105.625490196078[/C][C]11.9745098039216[/C][/ROW]
[ROW][C]49[/C][C]103.4[/C][C]105.625490196078[/C][C]-2.22549019607842[/C][/ROW]
[ROW][C]50[/C][C]110.8[/C][C]105.625490196078[/C][C]5.17450980392157[/C][/ROW]
[ROW][C]51[/C][C]112.6[/C][C]105.625490196078[/C][C]6.97450980392156[/C][/ROW]
[ROW][C]52[/C][C]102.5[/C][C]121.28[/C][C]-18.78[/C][/ROW]
[ROW][C]53[/C][C]112.4[/C][C]121.28[/C][C]-8.88[/C][/ROW]
[ROW][C]54[/C][C]135.6[/C][C]121.28[/C][C]14.32[/C][/ROW]
[ROW][C]55[/C][C]105.1[/C][C]121.28[/C][C]-16.18[/C][/ROW]
[ROW][C]56[/C][C]127.7[/C][C]121.28[/C][C]6.42[/C][/ROW]
[ROW][C]57[/C][C]137[/C][C]121.28[/C][C]15.72[/C][/ROW]
[ROW][C]58[/C][C]91[/C][C]121.28[/C][C]-30.28[/C][/ROW]
[ROW][C]59[/C][C]90.5[/C][C]121.28[/C][C]-30.78[/C][/ROW]
[ROW][C]60[/C][C]122.4[/C][C]121.28[/C][C]1.12000000000001[/C][/ROW]
[ROW][C]61[/C][C]123.3[/C][C]121.28[/C][C]2.02[/C][/ROW]
[ROW][C]62[/C][C]124.3[/C][C]121.28[/C][C]3.02[/C][/ROW]
[ROW][C]63[/C][C]120[/C][C]121.28[/C][C]-1.28000000000000[/C][/ROW]
[ROW][C]64[/C][C]118.1[/C][C]121.28[/C][C]-3.18[/C][/ROW]
[ROW][C]65[/C][C]119[/C][C]121.28[/C][C]-2.28000000000000[/C][/ROW]
[ROW][C]66[/C][C]142.7[/C][C]121.28[/C][C]21.42[/C][/ROW]
[ROW][C]67[/C][C]123.6[/C][C]121.28[/C][C]2.32000000000000[/C][/ROW]
[ROW][C]68[/C][C]129.6[/C][C]121.28[/C][C]8.32[/C][/ROW]
[ROW][C]69[/C][C]151.6[/C][C]121.28[/C][C]30.32[/C][/ROW]
[ROW][C]70[/C][C]110.4[/C][C]121.28[/C][C]-10.88[/C][/ROW]
[ROW][C]71[/C][C]99.2[/C][C]121.28[/C][C]-22.08[/C][/ROW]
[ROW][C]72[/C][C]130.5[/C][C]121.28[/C][C]9.22[/C][/ROW]
[ROW][C]73[/C][C]136.2[/C][C]121.28[/C][C]14.92[/C][/ROW]
[ROW][C]74[/C][C]129.7[/C][C]121.28[/C][C]8.41999999999999[/C][/ROW]
[ROW][C]75[/C][C]128[/C][C]121.28[/C][C]6.72[/C][/ROW]
[ROW][C]76[/C][C]121.6[/C][C]121.28[/C][C]0.319999999999997[/C][/ROW]
[/TABLE]
Source: https://freestatistics.org/blog/index.php?pk=25288&T=4

Globally Unique Identifier (entire table): ba.freestatistics.org/blog/index.php?pk=25288&T=4

As an alternative you can also use a QR Code:  

The GUIDs for individual cells are displayed in the table below:

Multiple Linear Regression - Actuals, Interpolation, and Residuals
Time or IndexActualsInterpolationForecastResidualsPrediction Error
1119.5105.62549019607813.8745098039215
2125105.62549019607819.3745098039216
3145105.62549019607839.3745098039216
4105.3105.625490196078-0.325490196078433
5116.9105.62549019607811.2745098039216
6120.1105.62549019607814.4745098039216
788.9105.625490196078-16.7254901960784
878.4105.625490196078-27.2254901960784
9114.6105.6254901960788.97450980392156
10113.3105.6254901960787.67450980392157
11117105.62549019607811.3745098039216
1299.6105.625490196078-6.02549019607844
1399.4105.625490196078-6.22549019607842
14101.9105.625490196078-3.72549019607842
15115.2105.6254901960789.57450980392157
16108.5105.6254901960782.87450980392157
17113.8105.6254901960788.17450980392157
18121105.62549019607815.3745098039216
1992.2105.625490196078-13.4254901960784
2090.2105.625490196078-15.4254901960784
21101.5105.625490196078-4.12549019607843
22126.6105.62549019607820.9745098039216
2393.9105.625490196078-11.7254901960784
2489.8105.625490196078-15.8254901960784
2593.4105.625490196078-12.2254901960784
26101.5105.625490196078-4.12549019607843
27110.4105.6254901960784.77450980392157
28105.9105.6254901960780.274509803921575
29108.4105.6254901960782.77450980392158
30113.9105.6254901960788.27450980392157
3186.1105.625490196078-19.5254901960784
3269.4105.625490196078-36.2254901960784
33101.2105.625490196078-4.42549019607843
34100.5105.625490196078-5.12549019607843
3598105.625490196078-7.62549019607843
36106.6105.6254901960780.974509803921564
3790.1105.625490196078-15.5254901960784
3896.9105.625490196078-8.72549019607842
39109.9105.6254901960784.27450980392157
4099105.625490196078-6.62549019607843
41106.3105.6254901960780.674509803921567
42128.9105.62549019607823.2745098039216
43111.1105.6254901960785.47450980392156
44102.9105.625490196078-2.72549019607842
45130105.62549019607824.3745098039216
4687105.625490196078-18.6254901960784
4787.5105.625490196078-18.1254901960784
48117.6105.62549019607811.9745098039216
49103.4105.625490196078-2.22549019607842
50110.8105.6254901960785.17450980392157
51112.6105.6254901960786.97450980392156
52102.5121.28-18.78
53112.4121.28-8.88
54135.6121.2814.32
55105.1121.28-16.18
56127.7121.286.42
57137121.2815.72
5891121.28-30.28
5990.5121.28-30.78
60122.4121.281.12000000000001
61123.3121.282.02
62124.3121.283.02
63120121.28-1.28000000000000
64118.1121.28-3.18
65119121.28-2.28000000000000
66142.7121.2821.42
67123.6121.282.32000000000000
68129.6121.288.32
69151.6121.2830.32
70110.4121.28-10.88
7199.2121.28-22.08
72130.5121.289.22
73136.2121.2814.92
74129.7121.288.41999999999999
75128121.286.72
76121.6121.280.319999999999997


Parameters (Session):
par1 = 1 ; par2 = Do not include Seasonal Dummies ; par3 = No Linear Trend ;
Parameters (R input):
par1 = 1 ; par2 = Do not include Seasonal Dummies ; par3 = No Linear Trend ;
R code (references can be found in the software module):
library(lattice)
par1 <- as.numeric(par1)
x <- t(y)
k <- length(x[1,])
n <- length(x[,1])
x1 <- cbind(x[,par1], x[,1:k!=par1])
mycolnames <- c(colnames(x)[par1], colnames(x)[1:k!=par1])
colnames(x1) <- mycolnames #colnames(x)[par1]
x <- x1
if (par3 == 'First Differences'){
x2 <- array(0, dim=c(n-1,k), dimnames=list(1:(n-1), paste('(1-B)',colnames(x),sep='')))
for (i in 1:n-1) {
for (j in 1:k) {
x2[i,j] <- x[i+1,j] - x[i,j]
}
}
x <- x2
}
if (par2 == 'Include Monthly Dummies'){
x2 <- array(0, dim=c(n,11), dimnames=list(1:n, paste('M', seq(1:11), sep ='')))
for (i in 1:11){
x2[seq(i,n,12),i] <- 1
}
x <- cbind(x, x2)
}
if (par2 == 'Include Quarterly Dummies'){
x2 <- array(0, dim=c(n,3), dimnames=list(1:n, paste('Q', seq(1:3), sep ='')))
for (i in 1:3){
x2[seq(i,n,4),i] <- 1
}
x <- cbind(x, x2)
}
k <- length(x[1,])
if (par3 == 'Linear Trend'){
x <- cbind(x, c(1:n))
colnames(x)[k+1] <- 't'
}
x
k <- length(x[1,])
df <- as.data.frame(x)
(mylm <- lm(df))
(mysum <- summary(mylm))
bitmap(file='test0.png')
plot(x[,1], type='l', main='Actuals and Interpolation', ylab='value of Actuals and Interpolation (dots)', xlab='time or index')
points(x[,1]-mysum$resid)
grid()
dev.off()
bitmap(file='test1.png')
plot(mysum$resid, type='b', pch=19, main='Residuals', ylab='value of Residuals', xlab='time or index')
grid()
dev.off()
bitmap(file='test2.png')
hist(mysum$resid, main='Residual Histogram', xlab='values of Residuals')
grid()
dev.off()
bitmap(file='test3.png')
densityplot(~mysum$resid,col='black',main='Residual Density Plot', xlab='values of Residuals')
dev.off()
bitmap(file='test4.png')
qqnorm(mysum$resid, main='Residual Normal Q-Q Plot')
grid()
dev.off()
(myerror <- as.ts(mysum$resid))
bitmap(file='test5.png')
dum <- cbind(lag(myerror,k=1),myerror)
dum
dum1 <- dum[2:length(myerror),]
dum1
z <- as.data.frame(dum1)
z
plot(z,main=paste('Residual Lag plot, lowess, and regression line'), ylab='values of Residuals', xlab='lagged values of Residuals')
lines(lowess(z))
abline(lm(z))
grid()
dev.off()
bitmap(file='test6.png')
acf(mysum$resid, lag.max=length(mysum$resid)/2, main='Residual Autocorrelation Function')
grid()
dev.off()
bitmap(file='test7.png')
pacf(mysum$resid, lag.max=length(mysum$resid)/2, main='Residual Partial Autocorrelation Function')
grid()
dev.off()
bitmap(file='test8.png')
opar <- par(mfrow = c(2,2), oma = c(0, 0, 1.1, 0))
plot(mylm, las = 1, sub='Residual Diagnostics')
par(opar)
dev.off()
load(file='createtable')
a<-table.start()
a<-table.row.start(a)
a<-table.element(a, 'Multiple Linear Regression - Estimated Regression Equation', 1, TRUE)
a<-table.row.end(a)
myeq <- colnames(x)[1]
myeq <- paste(myeq, '[t] = ', sep='')
for (i in 1:k){
if (mysum$coefficients[i,1] > 0) myeq <- paste(myeq, '+', '')
myeq <- paste(myeq, mysum$coefficients[i,1], sep=' ')
if (rownames(mysum$coefficients)[i] != '(Intercept)') {
myeq <- paste(myeq, rownames(mysum$coefficients)[i], sep='')
if (rownames(mysum$coefficients)[i] != 't') myeq <- paste(myeq, '[t]', sep='')
}
}
myeq <- paste(myeq, ' + e[t]')
a<-table.row.start(a)
a<-table.element(a, myeq)
a<-table.row.end(a)
a<-table.end(a)
table.save(a,file='mytable1.tab')
a<-table.start()
a<-table.row.start(a)
a<-table.element(a,hyperlink('ols1.htm','Multiple Linear Regression - Ordinary Least Squares',''), 6, TRUE)
a<-table.row.end(a)
a<-table.row.start(a)
a<-table.element(a,'Variable',header=TRUE)
a<-table.element(a,'Parameter',header=TRUE)
a<-table.element(a,'S.D.',header=TRUE)
a<-table.element(a,'T-STAT
H0: parameter = 0',header=TRUE)
a<-table.element(a,'2-tail p-value',header=TRUE)
a<-table.element(a,'1-tail p-value',header=TRUE)
a<-table.row.end(a)
for (i in 1:k){
a<-table.row.start(a)
a<-table.element(a,rownames(mysum$coefficients)[i],header=TRUE)
a<-table.element(a,mysum$coefficients[i,1])
a<-table.element(a, round(mysum$coefficients[i,2],6))
a<-table.element(a, round(mysum$coefficients[i,3],4))
a<-table.element(a, round(mysum$coefficients[i,4],6))
a<-table.element(a, round(mysum$coefficients[i,4]/2,6))
a<-table.row.end(a)
}
a<-table.end(a)
table.save(a,file='mytable2.tab')
a<-table.start()
a<-table.row.start(a)
a<-table.element(a, 'Multiple Linear Regression - Regression Statistics', 2, TRUE)
a<-table.row.end(a)
a<-table.row.start(a)
a<-table.element(a, 'Multiple R',1,TRUE)
a<-table.element(a, sqrt(mysum$r.squared))
a<-table.row.end(a)
a<-table.row.start(a)
a<-table.element(a, 'R-squared',1,TRUE)
a<-table.element(a, mysum$r.squared)
a<-table.row.end(a)
a<-table.row.start(a)
a<-table.element(a, 'Adjusted R-squared',1,TRUE)
a<-table.element(a, mysum$adj.r.squared)
a<-table.row.end(a)
a<-table.row.start(a)
a<-table.element(a, 'F-TEST (value)',1,TRUE)
a<-table.element(a, mysum$fstatistic[1])
a<-table.row.end(a)
a<-table.row.start(a)
a<-table.element(a, 'F-TEST (DF numerator)',1,TRUE)
a<-table.element(a, mysum$fstatistic[2])
a<-table.row.end(a)
a<-table.row.start(a)
a<-table.element(a, 'F-TEST (DF denominator)',1,TRUE)
a<-table.element(a, mysum$fstatistic[3])
a<-table.row.end(a)
a<-table.row.start(a)
a<-table.element(a, 'p-value',1,TRUE)
a<-table.element(a, 1-pf(mysum$fstatistic[1],mysum$fstatistic[2],mysum$fstatistic[3]))
a<-table.row.end(a)
a<-table.row.start(a)
a<-table.element(a, 'Multiple Linear Regression - Residual Statistics', 2, TRUE)
a<-table.row.end(a)
a<-table.row.start(a)
a<-table.element(a, 'Residual Standard Deviation',1,TRUE)
a<-table.element(a, mysum$sigma)
a<-table.row.end(a)
a<-table.row.start(a)
a<-table.element(a, 'Sum Squared Residuals',1,TRUE)
a<-table.element(a, sum(myerror*myerror))
a<-table.row.end(a)
a<-table.end(a)
table.save(a,file='mytable3.tab')
a<-table.start()
a<-table.row.start(a)
a<-table.element(a, 'Multiple Linear Regression - Actuals, Interpolation, and Residuals', 4, TRUE)
a<-table.row.end(a)
a<-table.row.start(a)
a<-table.element(a, 'Time or Index', 1, TRUE)
a<-table.element(a, 'Actuals', 1, TRUE)
a<-table.element(a, 'Interpolation
Forecast', 1, TRUE)
a<-table.element(a, 'Residuals
Prediction Error', 1, TRUE)
a<-table.row.end(a)
for (i in 1:n) {
a<-table.row.start(a)
a<-table.element(a,i, 1, TRUE)
a<-table.element(a,x[i])
a<-table.element(a,x[i]-mysum$resid[i])
a<-table.element(a,mysum$resid[i])
a<-table.row.end(a)
}
a<-table.end(a)
table.save(a,file='mytable4.tab')