Free Statistics

of Irreproducible Research!

Author's title

Author*The author of this computation has been verified*
R Software Modulerwasp_multipleregression.wasp
Title produced by softwareMultiple Regression
Date of computationSun, 23 Nov 2008 08:41:01 -0700
Cite this page as followsStatistical Computations at FreeStatistics.org, Office for Research Development and Education, URL https://freestatistics.org/blog/index.php?v=date/2008/Nov/23/t1227454998vhilww79x0p735z.htm/, Retrieved Fri, 17 May 2024 23:39:01 +0000
Statistical Computations at FreeStatistics.org, Office for Research Development and Education, URL https://freestatistics.org/blog/index.php?pk=25287, Retrieved Fri, 17 May 2024 23:39:01 +0000
QR Codes:

Original text written by user:
IsPrivate?No (this computation is public)
User-defined keywords
Estimated Impact172
Family? (F = Feedback message, R = changed R code, M = changed R Module, P = changed Parameters, D = changed Data)
F     [Multiple Regression] [] [2007-11-19 20:22:41] [3a1956effdcb54c39e5044435310d6c8]
F    D    [Multiple Regression] [Q3: Eigen tijdree...] [2008-11-23 15:41:01] [8758b22b4a10c08c31202f233362e983] [Current]
Feedback Forum
2008-11-27 17:27:29 [Matthieu Blondeau] [reply
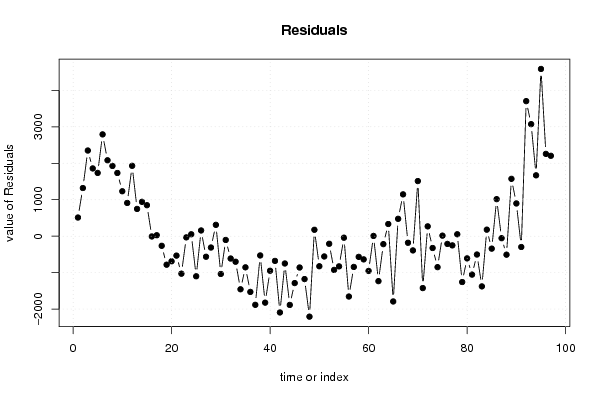
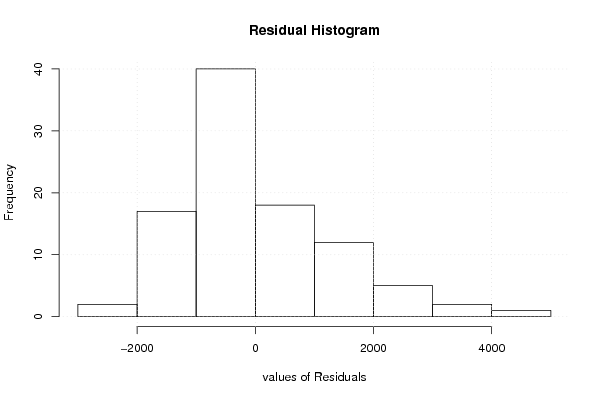
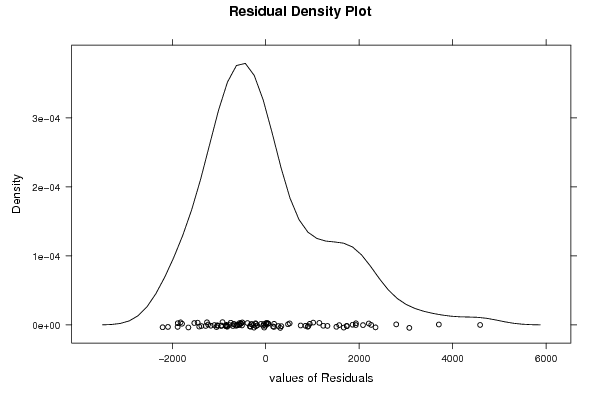
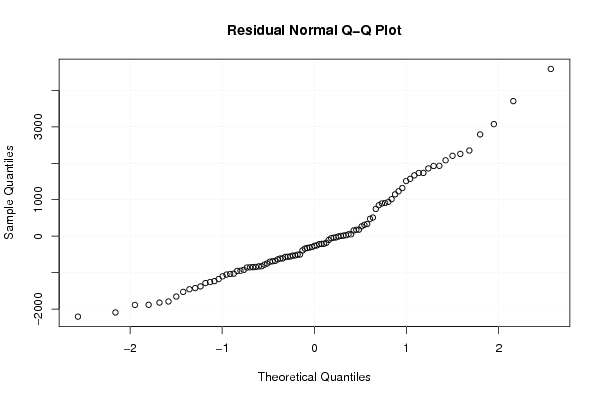
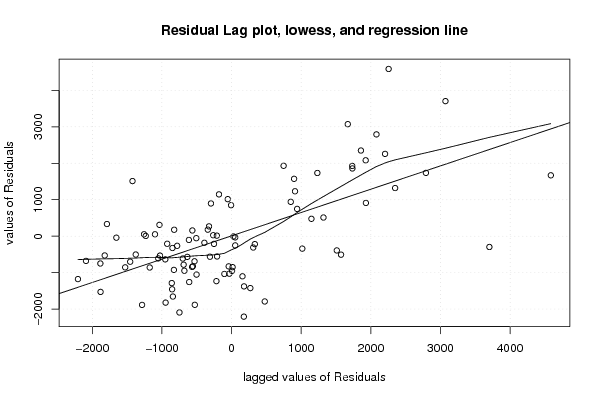
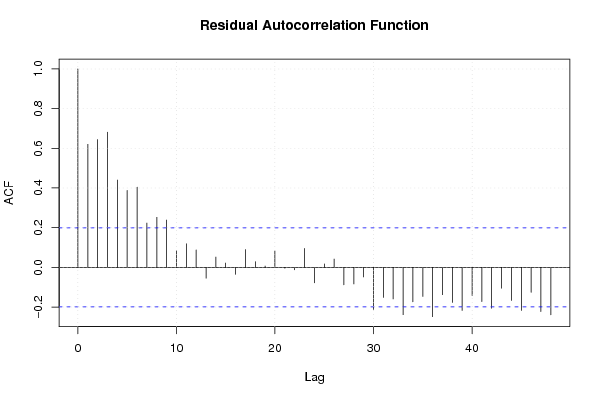
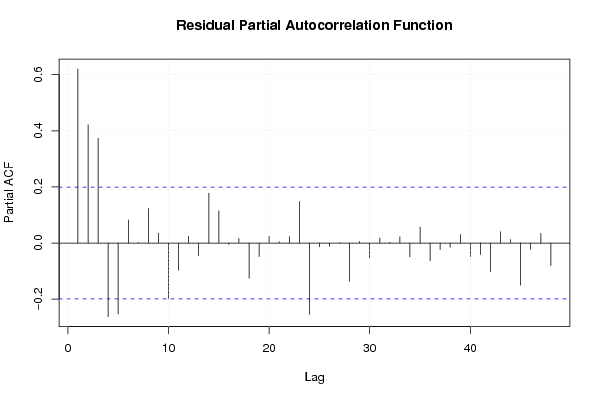
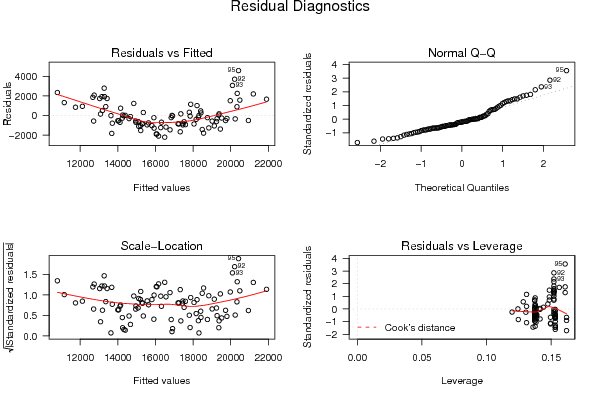
Ik heb hier een dummy variabele kunnen vinden. De T-STAT is niet altijd significant kleiner dan 0. Maar wel telkens significant verschillend van 0. Het gemiddelde bedraagt niet 0 aangezien de residuals niet op de 0-lijn lopen. De histogram en de density plot vertonen geen normaal verdeling maar eerder skewed. Er is ook sprake van autocorrelatie.

De verdere bespreking van de kaders en grafieken is hetzelfde als die voor Q1 en Q2.

Post a new message
Dataseries X:
13698,3	0
12477,6	0
13139,7	0
14532,2	0
15167	0
16071,1	0
14827,5	0
15082	0
14772,7	0
16083	0
14272,5	0
15223,3	0
14897,3	0
13062,6	0
12603,8	0
13629,8	0
14421,1	0
13978,3	0
12927,9	0
13429,9	0
13470,1	0
14785,8	0
14292	0
14308,8	0
14013	0
13240,9	0
12153,4	0
14289,7	0
15669,2	0
14169,5	0
14569,8	0
14469,1	0
14264,9	0
15320,9	0
14433,5	0
13691,5	0
14194,1	0
13519,2	0
11857,9	0
14616	0
15643,4	0
14077,2	0
14887,5	0
14159,9	0
14643	0
17192,5	1
15386,1	1
14287,1	1
17526,6	1
14497	1
14398,3	1
16629,6	1
16670,7	1
16614,8	1
16869,2	1
15663,9	1
16359,9	1
18447,7	1
16889	1
16505	1
18320,9	1
15052,1	1
15699,8	1
18135,3	1
16768,7	1
18883	1
19021	1
18101,9	1
17776,1	1
21489,9	1
17065,3	1
18690	1
18953,1	1
16398,9	1
16895,7	1
18553	1
19270	1
19422,1	1
17579,4	1
18637,3	1
18076,7	1
20438,6	1
18075,2	1
19563	1
19899,2	1
19227,5	1
17789,6	1
19220,8	1
22058,6	1
21230,8	1
19504,4	1
23913,1	1
23165,7	1
23574,3	1
25002	1
22603,9	1
23408,6	1


Summary of computational transaction
Raw Inputview raw input (R code)
Raw Outputview raw output of R engine
Computing time6 seconds
R Server'Herman Ole Andreas Wold' @ 193.190.124.10:1001

\begin{tabular}{lllllllll}
\hline
Summary of computational transaction \tabularnewline
Raw Input & view raw input (R code)  \tabularnewline
Raw Output & view raw output of R engine  \tabularnewline
Computing time & 6 seconds \tabularnewline
R Server & 'Herman Ole Andreas Wold' @ 193.190.124.10:1001 \tabularnewline
\hline
\end{tabular}
%Source: https://freestatistics.org/blog/index.php?pk=25287&T=0

[TABLE]
[ROW][C]Summary of computational transaction[/C][/ROW]
[ROW][C]Raw Input[/C][C]view raw input (R code) [/C][/ROW]
[ROW][C]Raw Output[/C][C]view raw output of R engine [/C][/ROW]
[ROW][C]Computing time[/C][C]6 seconds[/C][/ROW]
[ROW][C]R Server[/C][C]'Herman Ole Andreas Wold' @ 193.190.124.10:1001[/C][/ROW]
[/TABLE]
Source: https://freestatistics.org/blog/index.php?pk=25287&T=0

Globally Unique Identifier (entire table): ba.freestatistics.org/blog/index.php?pk=25287&T=0

As an alternative you can also use a QR Code:  

The GUIDs for individual cells are displayed in the table below:

Summary of computational transaction
Raw Inputview raw input (R code)
Raw Outputview raw output of R engine
Computing time6 seconds
R Server'Herman Ole Andreas Wold' @ 193.190.124.10:1001


Multiple Linear Regression - Estimated Regression Equation
y[t] = + 12329.8027104592 + 310.786017219388x[t] + 776.243568675302M1[t] -1332.96822399967M2[t] -1780.44657638446M3[t] + 22.8000712307497M4[t] + 700.30921884596M5[t] + 467.293366461168M6[t] -145.497485923622M7[t] + 183.024161691587M8[t] -13.2541906932036M9[t] + 1718.06920476958M10[t] + 148.153352384791M11[t] + 80.2783523847907t + e[t]

\begin{tabular}{lllllllll}
\hline
Multiple Linear Regression - Estimated Regression Equation \tabularnewline
y[t] =  +  12329.8027104592 +  310.786017219388x[t] +  776.243568675302M1[t] -1332.96822399967M2[t] -1780.44657638446M3[t] +  22.8000712307497M4[t] +  700.30921884596M5[t] +  467.293366461168M6[t] -145.497485923622M7[t] +  183.024161691587M8[t] -13.2541906932036M9[t] +  1718.06920476958M10[t] +  148.153352384791M11[t] +  80.2783523847907t  + e[t] \tabularnewline
\hline
\end{tabular}
%Source: https://freestatistics.org/blog/index.php?pk=25287&T=1

[TABLE]
[ROW][C]Multiple Linear Regression - Estimated Regression Equation[/C][/ROW]
[ROW][C]y[t] =  +  12329.8027104592 +  310.786017219388x[t] +  776.243568675302M1[t] -1332.96822399967M2[t] -1780.44657638446M3[t] +  22.8000712307497M4[t] +  700.30921884596M5[t] +  467.293366461168M6[t] -145.497485923622M7[t] +  183.024161691587M8[t] -13.2541906932036M9[t] +  1718.06920476958M10[t] +  148.153352384791M11[t] +  80.2783523847907t  + e[t][/C][/ROW]
[/TABLE]
Source: https://freestatistics.org/blog/index.php?pk=25287&T=1

Globally Unique Identifier (entire table): ba.freestatistics.org/blog/index.php?pk=25287&T=1

As an alternative you can also use a QR Code:  

The GUIDs for individual cells are displayed in the table below:

Multiple Linear Regression - Estimated Regression Equation
y[t] = + 12329.8027104592 + 310.786017219388x[t] + 776.243568675302M1[t] -1332.96822399967M2[t] -1780.44657638446M3[t] + 22.8000712307497M4[t] + 700.30921884596M5[t] + 467.293366461168M6[t] -145.497485923622M7[t] + 183.024161691587M8[t] -13.2541906932036M9[t] + 1718.06920476958M10[t] + 148.153352384791M11[t] + 80.2783523847907t + e[t]


Multiple Linear Regression - Ordinary Least Squares
VariableParameterS.D.T-STATH0: parameter = 02-tail p-value1-tail p-value
(Intercept)12329.8027104592582.3381821.172900
x310.786017219388574.6826970.54080.5900970.295048
M1776.243568675302684.9416251.13330.2603520.130176
M2-1332.96822399967706.357792-1.88710.0626430.031321
M3-1780.44657638446705.848812-2.52240.0135650.006782
M422.8000712307497705.4879950.03230.9742960.487148
M5700.30921884596705.275570.9930.3236160.161808
M6467.293366461168705.211670.66260.5094040.254702
M7-145.497485923622705.296335-0.20630.8370670.418534
M8183.024161691587705.5295130.25940.7959580.397979
M9-13.2541906932036705.911055-0.01880.9850650.492532
M101718.06920476958704.5864662.43840.0168860.008443
M11148.153352384791704.3633730.21030.8339210.41696
t80.278352384790710.2360067.842700

\begin{tabular}{lllllllll}
\hline
Multiple Linear Regression - Ordinary Least Squares \tabularnewline
Variable & Parameter & S.D. & T-STATH0: parameter = 0 & 2-tail p-value & 1-tail p-value \tabularnewline
(Intercept) & 12329.8027104592 & 582.33818 & 21.1729 & 0 & 0 \tabularnewline
x & 310.786017219388 & 574.682697 & 0.5408 & 0.590097 & 0.295048 \tabularnewline
M1 & 776.243568675302 & 684.941625 & 1.1333 & 0.260352 & 0.130176 \tabularnewline
M2 & -1332.96822399967 & 706.357792 & -1.8871 & 0.062643 & 0.031321 \tabularnewline
M3 & -1780.44657638446 & 705.848812 & -2.5224 & 0.013565 & 0.006782 \tabularnewline
M4 & 22.8000712307497 & 705.487995 & 0.0323 & 0.974296 & 0.487148 \tabularnewline
M5 & 700.30921884596 & 705.27557 & 0.993 & 0.323616 & 0.161808 \tabularnewline
M6 & 467.293366461168 & 705.21167 & 0.6626 & 0.509404 & 0.254702 \tabularnewline
M7 & -145.497485923622 & 705.296335 & -0.2063 & 0.837067 & 0.418534 \tabularnewline
M8 & 183.024161691587 & 705.529513 & 0.2594 & 0.795958 & 0.397979 \tabularnewline
M9 & -13.2541906932036 & 705.911055 & -0.0188 & 0.985065 & 0.492532 \tabularnewline
M10 & 1718.06920476958 & 704.586466 & 2.4384 & 0.016886 & 0.008443 \tabularnewline
M11 & 148.153352384791 & 704.363373 & 0.2103 & 0.833921 & 0.41696 \tabularnewline
t & 80.2783523847907 & 10.236006 & 7.8427 & 0 & 0 \tabularnewline
\hline
\end{tabular}
%Source: https://freestatistics.org/blog/index.php?pk=25287&T=2

[TABLE]
[ROW][C]Multiple Linear Regression - Ordinary Least Squares[/C][/ROW]
[ROW][C]Variable[/C][C]Parameter[/C][C]S.D.[/C][C]T-STATH0: parameter = 0[/C][C]2-tail p-value[/C][C]1-tail p-value[/C][/ROW]
[ROW][C](Intercept)[/C][C]12329.8027104592[/C][C]582.33818[/C][C]21.1729[/C][C]0[/C][C]0[/C][/ROW]
[ROW][C]x[/C][C]310.786017219388[/C][C]574.682697[/C][C]0.5408[/C][C]0.590097[/C][C]0.295048[/C][/ROW]
[ROW][C]M1[/C][C]776.243568675302[/C][C]684.941625[/C][C]1.1333[/C][C]0.260352[/C][C]0.130176[/C][/ROW]
[ROW][C]M2[/C][C]-1332.96822399967[/C][C]706.357792[/C][C]-1.8871[/C][C]0.062643[/C][C]0.031321[/C][/ROW]
[ROW][C]M3[/C][C]-1780.44657638446[/C][C]705.848812[/C][C]-2.5224[/C][C]0.013565[/C][C]0.006782[/C][/ROW]
[ROW][C]M4[/C][C]22.8000712307497[/C][C]705.487995[/C][C]0.0323[/C][C]0.974296[/C][C]0.487148[/C][/ROW]
[ROW][C]M5[/C][C]700.30921884596[/C][C]705.27557[/C][C]0.993[/C][C]0.323616[/C][C]0.161808[/C][/ROW]
[ROW][C]M6[/C][C]467.293366461168[/C][C]705.21167[/C][C]0.6626[/C][C]0.509404[/C][C]0.254702[/C][/ROW]
[ROW][C]M7[/C][C]-145.497485923622[/C][C]705.296335[/C][C]-0.2063[/C][C]0.837067[/C][C]0.418534[/C][/ROW]
[ROW][C]M8[/C][C]183.024161691587[/C][C]705.529513[/C][C]0.2594[/C][C]0.795958[/C][C]0.397979[/C][/ROW]
[ROW][C]M9[/C][C]-13.2541906932036[/C][C]705.911055[/C][C]-0.0188[/C][C]0.985065[/C][C]0.492532[/C][/ROW]
[ROW][C]M10[/C][C]1718.06920476958[/C][C]704.586466[/C][C]2.4384[/C][C]0.016886[/C][C]0.008443[/C][/ROW]
[ROW][C]M11[/C][C]148.153352384791[/C][C]704.363373[/C][C]0.2103[/C][C]0.833921[/C][C]0.41696[/C][/ROW]
[ROW][C]t[/C][C]80.2783523847907[/C][C]10.236006[/C][C]7.8427[/C][C]0[/C][C]0[/C][/ROW]
[/TABLE]
Source: https://freestatistics.org/blog/index.php?pk=25287&T=2

Globally Unique Identifier (entire table): ba.freestatistics.org/blog/index.php?pk=25287&T=2

As an alternative you can also use a QR Code:  

The GUIDs for individual cells are displayed in the table below:

Multiple Linear Regression - Ordinary Least Squares
VariableParameterS.D.T-STATH0: parameter = 02-tail p-value1-tail p-value
(Intercept)12329.8027104592582.3381821.172900
x310.786017219388574.6826970.54080.5900970.295048
M1776.243568675302684.9416251.13330.2603520.130176
M2-1332.96822399967706.357792-1.88710.0626430.031321
M3-1780.44657638446705.848812-2.52240.0135650.006782
M422.8000712307497705.4879950.03230.9742960.487148
M5700.30921884596705.275570.9930.3236160.161808
M6467.293366461168705.211670.66260.5094040.254702
M7-145.497485923622705.296335-0.20630.8370670.418534
M8183.024161691587705.5295130.25940.7959580.397979
M9-13.2541906932036705.911055-0.01880.9850650.492532
M101718.06920476958704.5864662.43840.0168860.008443
M11148.153352384791704.3633730.21030.8339210.41696
t80.278352384790710.2360067.842700


Multiple Linear Regression - Regression Statistics
Multiple R0.893132535391984
R-squared0.797685725775714
Adjusted R-squared0.765997947885164
F-TEST (value)25.1732932656531
F-TEST (DF numerator)13
F-TEST (DF denominator)83
p-value0
Multiple Linear Regression - Residual Statistics
Residual Standard Deviation1408.57798571772
Sum Squared Residuals164679631.173433

\begin{tabular}{lllllllll}
\hline
Multiple Linear Regression - Regression Statistics \tabularnewline
Multiple R & 0.893132535391984 \tabularnewline
R-squared & 0.797685725775714 \tabularnewline
Adjusted R-squared & 0.765997947885164 \tabularnewline
F-TEST (value) & 25.1732932656531 \tabularnewline
F-TEST (DF numerator) & 13 \tabularnewline
F-TEST (DF denominator) & 83 \tabularnewline
p-value & 0 \tabularnewline
Multiple Linear Regression - Residual Statistics \tabularnewline
Residual Standard Deviation & 1408.57798571772 \tabularnewline
Sum Squared Residuals & 164679631.173433 \tabularnewline
\hline
\end{tabular}
%Source: https://freestatistics.org/blog/index.php?pk=25287&T=3

[TABLE]
[ROW][C]Multiple Linear Regression - Regression Statistics[/C][/ROW]
[ROW][C]Multiple R[/C][C]0.893132535391984[/C][/ROW]
[ROW][C]R-squared[/C][C]0.797685725775714[/C][/ROW]
[ROW][C]Adjusted R-squared[/C][C]0.765997947885164[/C][/ROW]
[ROW][C]F-TEST (value)[/C][C]25.1732932656531[/C][/ROW]
[ROW][C]F-TEST (DF numerator)[/C][C]13[/C][/ROW]
[ROW][C]F-TEST (DF denominator)[/C][C]83[/C][/ROW]
[ROW][C]p-value[/C][C]0[/C][/ROW]
[ROW][C]Multiple Linear Regression - Residual Statistics[/C][/ROW]
[ROW][C]Residual Standard Deviation[/C][C]1408.57798571772[/C][/ROW]
[ROW][C]Sum Squared Residuals[/C][C]164679631.173433[/C][/ROW]
[/TABLE]
Source: https://freestatistics.org/blog/index.php?pk=25287&T=3

Globally Unique Identifier (entire table): ba.freestatistics.org/blog/index.php?pk=25287&T=3

As an alternative you can also use a QR Code:  

The GUIDs for individual cells are displayed in the table below:

Multiple Linear Regression - Regression Statistics
Multiple R0.893132535391984
R-squared0.797685725775714
Adjusted R-squared0.765997947885164
F-TEST (value)25.1732932656531
F-TEST (DF numerator)13
F-TEST (DF denominator)83
p-value0
Multiple Linear Regression - Residual Statistics
Residual Standard Deviation1408.57798571772
Sum Squared Residuals164679631.173433


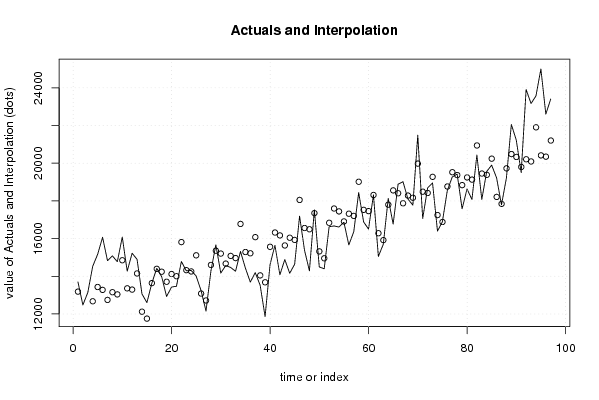
Multiple Linear Regression - Actuals, Interpolation, and Residuals
Time or IndexActualsInterpolationForecastResidualsPrediction Error
113698.313186.3246315193511.975368480741
212477.611157.39119122911320.20880877090
313139.710790.19119122912349.50880877090
414532.212673.71619122911858.48380877091
51516713431.50369122911735.49630877090
616071.113278.76619122912792.33380877090
714827.512746.25369122912081.24630877090
81508213155.05369122911926.94630877090
914772.713039.05369122911733.64630877090
101608314850.65543907671232.34456092333
1114272.513361.0179390767911.482060923327
1215223.313293.14293907671930.15706092333
1314897.314149.6648601368747.635139863234
1413062.612120.7314198466941.868580153417
1512603.811753.5314198466850.268580153414
1613629.813637.0564198466-7.25641984658547
1714421.114394.843919846626.2560801534153
1813978.314242.1064198466-263.806419846586
1912927.913709.5939198466-781.693919846585
2013429.914118.3939198466-688.493919846585
2113470.114002.3939198466-532.293919846585
2214785.815813.9956676942-1028.19566769416
231429214324.3581676942-32.3581676941615
2414308.814256.483167694252.3168323058387
251401315113.0050887543-1100.00508875425
2613240.913084.0716484641156.828351535926
2712153.412716.8716484641-563.471648464074
2814289.714600.3966484641-310.696648464072
2915669.215358.1841484641311.015851535927
3014169.515205.4466484641-1035.94664846407
3114569.814672.9341484641-103.134148464074
3214469.115081.7341484641-612.634148464073
3314264.914965.7341484641-700.834148464074
3415320.916777.3358963116-1456.43589631165
3514433.515287.6983963116-854.19839631165
3613691.515219.8233963116-1528.32339631165
3714194.116076.3453173717-1882.24531737174
3813519.214047.4118770816-528.211877081562
3911857.913680.2118770816-1822.31187708156
401461615563.7368770816-947.736877081561
4115643.416321.5243770816-678.124377081562
4214077.216168.7868770816-2091.58687708156
4314887.515636.2743770816-748.774377081562
4414159.916045.0743770816-1885.17437708156
451464315929.0743770816-1286.07437708156
4617192.518051.4621421485-858.962142148526
4715386.116561.8246421485-1175.72464214853
4814287.116493.9496421485-2206.84964214853
4917526.617350.4715632086176.128436791379
501449715321.5381229184-824.538122918439
5114398.314954.3381229184-556.038122918438
5216629.616837.8631229184-208.263122918441
5316670.717595.6506229184-924.950622918438
5416614.817442.9131229184-828.11312291844
5516869.216910.4006229184-41.2006229184383
5615663.917319.2006229184-1655.30062291844
5716359.917203.2006229184-843.300622918438
5818447.719014.802370766-567.102370766013
591688917525.164870766-636.164870766015
601650517457.289870766-952.289870766015
6118320.918313.81179182617.0882081738942
6215052.116284.8783515359-1232.77835153593
6315699.815917.6783515359-217.878351535927
6418135.317801.2033515359334.096648464073
6516768.718558.9908515359-1790.29085153593
661888318406.2533515359476.746648464073
671902117873.74085153591147.25914846407
6818101.918282.5408515359-180.640851535925
6917776.118166.5408515359-390.440851535928
7021489.919978.14259938351511.7574006165
7117065.318488.5050993835-1423.20509938350
721869018420.6300993835269.369900616498
7318953.119277.1520204436-324.052020443597
7416398.917248.2185801534-849.318580153415
7516895.716881.018580153414.6814198465858
761855318764.5435801534-211.543580153415
771927019522.3310801534-252.331080153416
7819422.119369.593580153452.5064198465836
7917579.418837.0810801534-1257.68108015341
8018637.319245.8810801534-608.581080153416
8118076.719129.8810801534-1053.18108015341
8220438.620941.482828001-502.882828000993
8318075.219451.845328001-1376.64532800099
841956319383.970328001179.029671999009
8519899.220240.4922490611-341.292249061083
8619227.518211.55880877091015.94119122910
8717789.617844.3588087709-54.7588087709044
8819220.819727.8838087709-507.083808770905
8922058.620485.67130877091572.92869122910
9021230.820332.9338087709897.866191229096
9119504.419800.4213087709-296.021308770903
9223913.120209.22130877093703.87869122909
9323165.720093.22130877093072.47869122910
9423574.321904.82305661851669.47694338152
952500220415.18555661854586.81444338152
9622603.920347.31055661852256.58944338152
9723408.621203.83247767862204.76752232143

\begin{tabular}{lllllllll}
\hline
Multiple Linear Regression - Actuals, Interpolation, and Residuals \tabularnewline
Time or Index & Actuals & InterpolationForecast & ResidualsPrediction Error \tabularnewline
1 & 13698.3 & 13186.3246315193 & 511.975368480741 \tabularnewline
2 & 12477.6 & 11157.3911912291 & 1320.20880877090 \tabularnewline
3 & 13139.7 & 10790.1911912291 & 2349.50880877090 \tabularnewline
4 & 14532.2 & 12673.7161912291 & 1858.48380877091 \tabularnewline
5 & 15167 & 13431.5036912291 & 1735.49630877090 \tabularnewline
6 & 16071.1 & 13278.7661912291 & 2792.33380877090 \tabularnewline
7 & 14827.5 & 12746.2536912291 & 2081.24630877090 \tabularnewline
8 & 15082 & 13155.0536912291 & 1926.94630877090 \tabularnewline
9 & 14772.7 & 13039.0536912291 & 1733.64630877090 \tabularnewline
10 & 16083 & 14850.6554390767 & 1232.34456092333 \tabularnewline
11 & 14272.5 & 13361.0179390767 & 911.482060923327 \tabularnewline
12 & 15223.3 & 13293.1429390767 & 1930.15706092333 \tabularnewline
13 & 14897.3 & 14149.6648601368 & 747.635139863234 \tabularnewline
14 & 13062.6 & 12120.7314198466 & 941.868580153417 \tabularnewline
15 & 12603.8 & 11753.5314198466 & 850.268580153414 \tabularnewline
16 & 13629.8 & 13637.0564198466 & -7.25641984658547 \tabularnewline
17 & 14421.1 & 14394.8439198466 & 26.2560801534153 \tabularnewline
18 & 13978.3 & 14242.1064198466 & -263.806419846586 \tabularnewline
19 & 12927.9 & 13709.5939198466 & -781.693919846585 \tabularnewline
20 & 13429.9 & 14118.3939198466 & -688.493919846585 \tabularnewline
21 & 13470.1 & 14002.3939198466 & -532.293919846585 \tabularnewline
22 & 14785.8 & 15813.9956676942 & -1028.19566769416 \tabularnewline
23 & 14292 & 14324.3581676942 & -32.3581676941615 \tabularnewline
24 & 14308.8 & 14256.4831676942 & 52.3168323058387 \tabularnewline
25 & 14013 & 15113.0050887543 & -1100.00508875425 \tabularnewline
26 & 13240.9 & 13084.0716484641 & 156.828351535926 \tabularnewline
27 & 12153.4 & 12716.8716484641 & -563.471648464074 \tabularnewline
28 & 14289.7 & 14600.3966484641 & -310.696648464072 \tabularnewline
29 & 15669.2 & 15358.1841484641 & 311.015851535927 \tabularnewline
30 & 14169.5 & 15205.4466484641 & -1035.94664846407 \tabularnewline
31 & 14569.8 & 14672.9341484641 & -103.134148464074 \tabularnewline
32 & 14469.1 & 15081.7341484641 & -612.634148464073 \tabularnewline
33 & 14264.9 & 14965.7341484641 & -700.834148464074 \tabularnewline
34 & 15320.9 & 16777.3358963116 & -1456.43589631165 \tabularnewline
35 & 14433.5 & 15287.6983963116 & -854.19839631165 \tabularnewline
36 & 13691.5 & 15219.8233963116 & -1528.32339631165 \tabularnewline
37 & 14194.1 & 16076.3453173717 & -1882.24531737174 \tabularnewline
38 & 13519.2 & 14047.4118770816 & -528.211877081562 \tabularnewline
39 & 11857.9 & 13680.2118770816 & -1822.31187708156 \tabularnewline
40 & 14616 & 15563.7368770816 & -947.736877081561 \tabularnewline
41 & 15643.4 & 16321.5243770816 & -678.124377081562 \tabularnewline
42 & 14077.2 & 16168.7868770816 & -2091.58687708156 \tabularnewline
43 & 14887.5 & 15636.2743770816 & -748.774377081562 \tabularnewline
44 & 14159.9 & 16045.0743770816 & -1885.17437708156 \tabularnewline
45 & 14643 & 15929.0743770816 & -1286.07437708156 \tabularnewline
46 & 17192.5 & 18051.4621421485 & -858.962142148526 \tabularnewline
47 & 15386.1 & 16561.8246421485 & -1175.72464214853 \tabularnewline
48 & 14287.1 & 16493.9496421485 & -2206.84964214853 \tabularnewline
49 & 17526.6 & 17350.4715632086 & 176.128436791379 \tabularnewline
50 & 14497 & 15321.5381229184 & -824.538122918439 \tabularnewline
51 & 14398.3 & 14954.3381229184 & -556.038122918438 \tabularnewline
52 & 16629.6 & 16837.8631229184 & -208.263122918441 \tabularnewline
53 & 16670.7 & 17595.6506229184 & -924.950622918438 \tabularnewline
54 & 16614.8 & 17442.9131229184 & -828.11312291844 \tabularnewline
55 & 16869.2 & 16910.4006229184 & -41.2006229184383 \tabularnewline
56 & 15663.9 & 17319.2006229184 & -1655.30062291844 \tabularnewline
57 & 16359.9 & 17203.2006229184 & -843.300622918438 \tabularnewline
58 & 18447.7 & 19014.802370766 & -567.102370766013 \tabularnewline
59 & 16889 & 17525.164870766 & -636.164870766015 \tabularnewline
60 & 16505 & 17457.289870766 & -952.289870766015 \tabularnewline
61 & 18320.9 & 18313.8117918261 & 7.0882081738942 \tabularnewline
62 & 15052.1 & 16284.8783515359 & -1232.77835153593 \tabularnewline
63 & 15699.8 & 15917.6783515359 & -217.878351535927 \tabularnewline
64 & 18135.3 & 17801.2033515359 & 334.096648464073 \tabularnewline
65 & 16768.7 & 18558.9908515359 & -1790.29085153593 \tabularnewline
66 & 18883 & 18406.2533515359 & 476.746648464073 \tabularnewline
67 & 19021 & 17873.7408515359 & 1147.25914846407 \tabularnewline
68 & 18101.9 & 18282.5408515359 & -180.640851535925 \tabularnewline
69 & 17776.1 & 18166.5408515359 & -390.440851535928 \tabularnewline
70 & 21489.9 & 19978.1425993835 & 1511.7574006165 \tabularnewline
71 & 17065.3 & 18488.5050993835 & -1423.20509938350 \tabularnewline
72 & 18690 & 18420.6300993835 & 269.369900616498 \tabularnewline
73 & 18953.1 & 19277.1520204436 & -324.052020443597 \tabularnewline
74 & 16398.9 & 17248.2185801534 & -849.318580153415 \tabularnewline
75 & 16895.7 & 16881.0185801534 & 14.6814198465858 \tabularnewline
76 & 18553 & 18764.5435801534 & -211.543580153415 \tabularnewline
77 & 19270 & 19522.3310801534 & -252.331080153416 \tabularnewline
78 & 19422.1 & 19369.5935801534 & 52.5064198465836 \tabularnewline
79 & 17579.4 & 18837.0810801534 & -1257.68108015341 \tabularnewline
80 & 18637.3 & 19245.8810801534 & -608.581080153416 \tabularnewline
81 & 18076.7 & 19129.8810801534 & -1053.18108015341 \tabularnewline
82 & 20438.6 & 20941.482828001 & -502.882828000993 \tabularnewline
83 & 18075.2 & 19451.845328001 & -1376.64532800099 \tabularnewline
84 & 19563 & 19383.970328001 & 179.029671999009 \tabularnewline
85 & 19899.2 & 20240.4922490611 & -341.292249061083 \tabularnewline
86 & 19227.5 & 18211.5588087709 & 1015.94119122910 \tabularnewline
87 & 17789.6 & 17844.3588087709 & -54.7588087709044 \tabularnewline
88 & 19220.8 & 19727.8838087709 & -507.083808770905 \tabularnewline
89 & 22058.6 & 20485.6713087709 & 1572.92869122910 \tabularnewline
90 & 21230.8 & 20332.9338087709 & 897.866191229096 \tabularnewline
91 & 19504.4 & 19800.4213087709 & -296.021308770903 \tabularnewline
92 & 23913.1 & 20209.2213087709 & 3703.87869122909 \tabularnewline
93 & 23165.7 & 20093.2213087709 & 3072.47869122910 \tabularnewline
94 & 23574.3 & 21904.8230566185 & 1669.47694338152 \tabularnewline
95 & 25002 & 20415.1855566185 & 4586.81444338152 \tabularnewline
96 & 22603.9 & 20347.3105566185 & 2256.58944338152 \tabularnewline
97 & 23408.6 & 21203.8324776786 & 2204.76752232143 \tabularnewline
\hline
\end{tabular}
%Source: https://freestatistics.org/blog/index.php?pk=25287&T=4

[TABLE]
[ROW][C]Multiple Linear Regression - Actuals, Interpolation, and Residuals[/C][/ROW]
[ROW][C]Time or Index[/C][C]Actuals[/C][C]InterpolationForecast[/C][C]ResidualsPrediction Error[/C][/ROW]
[ROW][C]1[/C][C]13698.3[/C][C]13186.3246315193[/C][C]511.975368480741[/C][/ROW]
[ROW][C]2[/C][C]12477.6[/C][C]11157.3911912291[/C][C]1320.20880877090[/C][/ROW]
[ROW][C]3[/C][C]13139.7[/C][C]10790.1911912291[/C][C]2349.50880877090[/C][/ROW]
[ROW][C]4[/C][C]14532.2[/C][C]12673.7161912291[/C][C]1858.48380877091[/C][/ROW]
[ROW][C]5[/C][C]15167[/C][C]13431.5036912291[/C][C]1735.49630877090[/C][/ROW]
[ROW][C]6[/C][C]16071.1[/C][C]13278.7661912291[/C][C]2792.33380877090[/C][/ROW]
[ROW][C]7[/C][C]14827.5[/C][C]12746.2536912291[/C][C]2081.24630877090[/C][/ROW]
[ROW][C]8[/C][C]15082[/C][C]13155.0536912291[/C][C]1926.94630877090[/C][/ROW]
[ROW][C]9[/C][C]14772.7[/C][C]13039.0536912291[/C][C]1733.64630877090[/C][/ROW]
[ROW][C]10[/C][C]16083[/C][C]14850.6554390767[/C][C]1232.34456092333[/C][/ROW]
[ROW][C]11[/C][C]14272.5[/C][C]13361.0179390767[/C][C]911.482060923327[/C][/ROW]
[ROW][C]12[/C][C]15223.3[/C][C]13293.1429390767[/C][C]1930.15706092333[/C][/ROW]
[ROW][C]13[/C][C]14897.3[/C][C]14149.6648601368[/C][C]747.635139863234[/C][/ROW]
[ROW][C]14[/C][C]13062.6[/C][C]12120.7314198466[/C][C]941.868580153417[/C][/ROW]
[ROW][C]15[/C][C]12603.8[/C][C]11753.5314198466[/C][C]850.268580153414[/C][/ROW]
[ROW][C]16[/C][C]13629.8[/C][C]13637.0564198466[/C][C]-7.25641984658547[/C][/ROW]
[ROW][C]17[/C][C]14421.1[/C][C]14394.8439198466[/C][C]26.2560801534153[/C][/ROW]
[ROW][C]18[/C][C]13978.3[/C][C]14242.1064198466[/C][C]-263.806419846586[/C][/ROW]
[ROW][C]19[/C][C]12927.9[/C][C]13709.5939198466[/C][C]-781.693919846585[/C][/ROW]
[ROW][C]20[/C][C]13429.9[/C][C]14118.3939198466[/C][C]-688.493919846585[/C][/ROW]
[ROW][C]21[/C][C]13470.1[/C][C]14002.3939198466[/C][C]-532.293919846585[/C][/ROW]
[ROW][C]22[/C][C]14785.8[/C][C]15813.9956676942[/C][C]-1028.19566769416[/C][/ROW]
[ROW][C]23[/C][C]14292[/C][C]14324.3581676942[/C][C]-32.3581676941615[/C][/ROW]
[ROW][C]24[/C][C]14308.8[/C][C]14256.4831676942[/C][C]52.3168323058387[/C][/ROW]
[ROW][C]25[/C][C]14013[/C][C]15113.0050887543[/C][C]-1100.00508875425[/C][/ROW]
[ROW][C]26[/C][C]13240.9[/C][C]13084.0716484641[/C][C]156.828351535926[/C][/ROW]
[ROW][C]27[/C][C]12153.4[/C][C]12716.8716484641[/C][C]-563.471648464074[/C][/ROW]
[ROW][C]28[/C][C]14289.7[/C][C]14600.3966484641[/C][C]-310.696648464072[/C][/ROW]
[ROW][C]29[/C][C]15669.2[/C][C]15358.1841484641[/C][C]311.015851535927[/C][/ROW]
[ROW][C]30[/C][C]14169.5[/C][C]15205.4466484641[/C][C]-1035.94664846407[/C][/ROW]
[ROW][C]31[/C][C]14569.8[/C][C]14672.9341484641[/C][C]-103.134148464074[/C][/ROW]
[ROW][C]32[/C][C]14469.1[/C][C]15081.7341484641[/C][C]-612.634148464073[/C][/ROW]
[ROW][C]33[/C][C]14264.9[/C][C]14965.7341484641[/C][C]-700.834148464074[/C][/ROW]
[ROW][C]34[/C][C]15320.9[/C][C]16777.3358963116[/C][C]-1456.43589631165[/C][/ROW]
[ROW][C]35[/C][C]14433.5[/C][C]15287.6983963116[/C][C]-854.19839631165[/C][/ROW]
[ROW][C]36[/C][C]13691.5[/C][C]15219.8233963116[/C][C]-1528.32339631165[/C][/ROW]
[ROW][C]37[/C][C]14194.1[/C][C]16076.3453173717[/C][C]-1882.24531737174[/C][/ROW]
[ROW][C]38[/C][C]13519.2[/C][C]14047.4118770816[/C][C]-528.211877081562[/C][/ROW]
[ROW][C]39[/C][C]11857.9[/C][C]13680.2118770816[/C][C]-1822.31187708156[/C][/ROW]
[ROW][C]40[/C][C]14616[/C][C]15563.7368770816[/C][C]-947.736877081561[/C][/ROW]
[ROW][C]41[/C][C]15643.4[/C][C]16321.5243770816[/C][C]-678.124377081562[/C][/ROW]
[ROW][C]42[/C][C]14077.2[/C][C]16168.7868770816[/C][C]-2091.58687708156[/C][/ROW]
[ROW][C]43[/C][C]14887.5[/C][C]15636.2743770816[/C][C]-748.774377081562[/C][/ROW]
[ROW][C]44[/C][C]14159.9[/C][C]16045.0743770816[/C][C]-1885.17437708156[/C][/ROW]
[ROW][C]45[/C][C]14643[/C][C]15929.0743770816[/C][C]-1286.07437708156[/C][/ROW]
[ROW][C]46[/C][C]17192.5[/C][C]18051.4621421485[/C][C]-858.962142148526[/C][/ROW]
[ROW][C]47[/C][C]15386.1[/C][C]16561.8246421485[/C][C]-1175.72464214853[/C][/ROW]
[ROW][C]48[/C][C]14287.1[/C][C]16493.9496421485[/C][C]-2206.84964214853[/C][/ROW]
[ROW][C]49[/C][C]17526.6[/C][C]17350.4715632086[/C][C]176.128436791379[/C][/ROW]
[ROW][C]50[/C][C]14497[/C][C]15321.5381229184[/C][C]-824.538122918439[/C][/ROW]
[ROW][C]51[/C][C]14398.3[/C][C]14954.3381229184[/C][C]-556.038122918438[/C][/ROW]
[ROW][C]52[/C][C]16629.6[/C][C]16837.8631229184[/C][C]-208.263122918441[/C][/ROW]
[ROW][C]53[/C][C]16670.7[/C][C]17595.6506229184[/C][C]-924.950622918438[/C][/ROW]
[ROW][C]54[/C][C]16614.8[/C][C]17442.9131229184[/C][C]-828.11312291844[/C][/ROW]
[ROW][C]55[/C][C]16869.2[/C][C]16910.4006229184[/C][C]-41.2006229184383[/C][/ROW]
[ROW][C]56[/C][C]15663.9[/C][C]17319.2006229184[/C][C]-1655.30062291844[/C][/ROW]
[ROW][C]57[/C][C]16359.9[/C][C]17203.2006229184[/C][C]-843.300622918438[/C][/ROW]
[ROW][C]58[/C][C]18447.7[/C][C]19014.802370766[/C][C]-567.102370766013[/C][/ROW]
[ROW][C]59[/C][C]16889[/C][C]17525.164870766[/C][C]-636.164870766015[/C][/ROW]
[ROW][C]60[/C][C]16505[/C][C]17457.289870766[/C][C]-952.289870766015[/C][/ROW]
[ROW][C]61[/C][C]18320.9[/C][C]18313.8117918261[/C][C]7.0882081738942[/C][/ROW]
[ROW][C]62[/C][C]15052.1[/C][C]16284.8783515359[/C][C]-1232.77835153593[/C][/ROW]
[ROW][C]63[/C][C]15699.8[/C][C]15917.6783515359[/C][C]-217.878351535927[/C][/ROW]
[ROW][C]64[/C][C]18135.3[/C][C]17801.2033515359[/C][C]334.096648464073[/C][/ROW]
[ROW][C]65[/C][C]16768.7[/C][C]18558.9908515359[/C][C]-1790.29085153593[/C][/ROW]
[ROW][C]66[/C][C]18883[/C][C]18406.2533515359[/C][C]476.746648464073[/C][/ROW]
[ROW][C]67[/C][C]19021[/C][C]17873.7408515359[/C][C]1147.25914846407[/C][/ROW]
[ROW][C]68[/C][C]18101.9[/C][C]18282.5408515359[/C][C]-180.640851535925[/C][/ROW]
[ROW][C]69[/C][C]17776.1[/C][C]18166.5408515359[/C][C]-390.440851535928[/C][/ROW]
[ROW][C]70[/C][C]21489.9[/C][C]19978.1425993835[/C][C]1511.7574006165[/C][/ROW]
[ROW][C]71[/C][C]17065.3[/C][C]18488.5050993835[/C][C]-1423.20509938350[/C][/ROW]
[ROW][C]72[/C][C]18690[/C][C]18420.6300993835[/C][C]269.369900616498[/C][/ROW]
[ROW][C]73[/C][C]18953.1[/C][C]19277.1520204436[/C][C]-324.052020443597[/C][/ROW]
[ROW][C]74[/C][C]16398.9[/C][C]17248.2185801534[/C][C]-849.318580153415[/C][/ROW]
[ROW][C]75[/C][C]16895.7[/C][C]16881.0185801534[/C][C]14.6814198465858[/C][/ROW]
[ROW][C]76[/C][C]18553[/C][C]18764.5435801534[/C][C]-211.543580153415[/C][/ROW]
[ROW][C]77[/C][C]19270[/C][C]19522.3310801534[/C][C]-252.331080153416[/C][/ROW]
[ROW][C]78[/C][C]19422.1[/C][C]19369.5935801534[/C][C]52.5064198465836[/C][/ROW]
[ROW][C]79[/C][C]17579.4[/C][C]18837.0810801534[/C][C]-1257.68108015341[/C][/ROW]
[ROW][C]80[/C][C]18637.3[/C][C]19245.8810801534[/C][C]-608.581080153416[/C][/ROW]
[ROW][C]81[/C][C]18076.7[/C][C]19129.8810801534[/C][C]-1053.18108015341[/C][/ROW]
[ROW][C]82[/C][C]20438.6[/C][C]20941.482828001[/C][C]-502.882828000993[/C][/ROW]
[ROW][C]83[/C][C]18075.2[/C][C]19451.845328001[/C][C]-1376.64532800099[/C][/ROW]
[ROW][C]84[/C][C]19563[/C][C]19383.970328001[/C][C]179.029671999009[/C][/ROW]
[ROW][C]85[/C][C]19899.2[/C][C]20240.4922490611[/C][C]-341.292249061083[/C][/ROW]
[ROW][C]86[/C][C]19227.5[/C][C]18211.5588087709[/C][C]1015.94119122910[/C][/ROW]
[ROW][C]87[/C][C]17789.6[/C][C]17844.3588087709[/C][C]-54.7588087709044[/C][/ROW]
[ROW][C]88[/C][C]19220.8[/C][C]19727.8838087709[/C][C]-507.083808770905[/C][/ROW]
[ROW][C]89[/C][C]22058.6[/C][C]20485.6713087709[/C][C]1572.92869122910[/C][/ROW]
[ROW][C]90[/C][C]21230.8[/C][C]20332.9338087709[/C][C]897.866191229096[/C][/ROW]
[ROW][C]91[/C][C]19504.4[/C][C]19800.4213087709[/C][C]-296.021308770903[/C][/ROW]
[ROW][C]92[/C][C]23913.1[/C][C]20209.2213087709[/C][C]3703.87869122909[/C][/ROW]
[ROW][C]93[/C][C]23165.7[/C][C]20093.2213087709[/C][C]3072.47869122910[/C][/ROW]
[ROW][C]94[/C][C]23574.3[/C][C]21904.8230566185[/C][C]1669.47694338152[/C][/ROW]
[ROW][C]95[/C][C]25002[/C][C]20415.1855566185[/C][C]4586.81444338152[/C][/ROW]
[ROW][C]96[/C][C]22603.9[/C][C]20347.3105566185[/C][C]2256.58944338152[/C][/ROW]
[ROW][C]97[/C][C]23408.6[/C][C]21203.8324776786[/C][C]2204.76752232143[/C][/ROW]
[/TABLE]
Source: https://freestatistics.org/blog/index.php?pk=25287&T=4

Globally Unique Identifier (entire table): ba.freestatistics.org/blog/index.php?pk=25287&T=4

As an alternative you can also use a QR Code:  

The GUIDs for individual cells are displayed in the table below:

Multiple Linear Regression - Actuals, Interpolation, and Residuals
Time or IndexActualsInterpolationForecastResidualsPrediction Error
113698.313186.3246315193511.975368480741
212477.611157.39119122911320.20880877090
313139.710790.19119122912349.50880877090
414532.212673.71619122911858.48380877091
51516713431.50369122911735.49630877090
616071.113278.76619122912792.33380877090
714827.512746.25369122912081.24630877090
81508213155.05369122911926.94630877090
914772.713039.05369122911733.64630877090
101608314850.65543907671232.34456092333
1114272.513361.0179390767911.482060923327
1215223.313293.14293907671930.15706092333
1314897.314149.6648601368747.635139863234
1413062.612120.7314198466941.868580153417
1512603.811753.5314198466850.268580153414
1613629.813637.0564198466-7.25641984658547
1714421.114394.843919846626.2560801534153
1813978.314242.1064198466-263.806419846586
1912927.913709.5939198466-781.693919846585
2013429.914118.3939198466-688.493919846585
2113470.114002.3939198466-532.293919846585
2214785.815813.9956676942-1028.19566769416
231429214324.3581676942-32.3581676941615
2414308.814256.483167694252.3168323058387
251401315113.0050887543-1100.00508875425
2613240.913084.0716484641156.828351535926
2712153.412716.8716484641-563.471648464074
2814289.714600.3966484641-310.696648464072
2915669.215358.1841484641311.015851535927
3014169.515205.4466484641-1035.94664846407
3114569.814672.9341484641-103.134148464074
3214469.115081.7341484641-612.634148464073
3314264.914965.7341484641-700.834148464074
3415320.916777.3358963116-1456.43589631165
3514433.515287.6983963116-854.19839631165
3613691.515219.8233963116-1528.32339631165
3714194.116076.3453173717-1882.24531737174
3813519.214047.4118770816-528.211877081562
3911857.913680.2118770816-1822.31187708156
401461615563.7368770816-947.736877081561
4115643.416321.5243770816-678.124377081562
4214077.216168.7868770816-2091.58687708156
4314887.515636.2743770816-748.774377081562
4414159.916045.0743770816-1885.17437708156
451464315929.0743770816-1286.07437708156
4617192.518051.4621421485-858.962142148526
4715386.116561.8246421485-1175.72464214853
4814287.116493.9496421485-2206.84964214853
4917526.617350.4715632086176.128436791379
501449715321.5381229184-824.538122918439
5114398.314954.3381229184-556.038122918438
5216629.616837.8631229184-208.263122918441
5316670.717595.6506229184-924.950622918438
5416614.817442.9131229184-828.11312291844
5516869.216910.4006229184-41.2006229184383
5615663.917319.2006229184-1655.30062291844
5716359.917203.2006229184-843.300622918438
5818447.719014.802370766-567.102370766013
591688917525.164870766-636.164870766015
601650517457.289870766-952.289870766015
6118320.918313.81179182617.0882081738942
6215052.116284.8783515359-1232.77835153593
6315699.815917.6783515359-217.878351535927
6418135.317801.2033515359334.096648464073
6516768.718558.9908515359-1790.29085153593
661888318406.2533515359476.746648464073
671902117873.74085153591147.25914846407
6818101.918282.5408515359-180.640851535925
6917776.118166.5408515359-390.440851535928
7021489.919978.14259938351511.7574006165
7117065.318488.5050993835-1423.20509938350
721869018420.6300993835269.369900616498
7318953.119277.1520204436-324.052020443597
7416398.917248.2185801534-849.318580153415
7516895.716881.018580153414.6814198465858
761855318764.5435801534-211.543580153415
771927019522.3310801534-252.331080153416
7819422.119369.593580153452.5064198465836
7917579.418837.0810801534-1257.68108015341
8018637.319245.8810801534-608.581080153416
8118076.719129.8810801534-1053.18108015341
8220438.620941.482828001-502.882828000993
8318075.219451.845328001-1376.64532800099
841956319383.970328001179.029671999009
8519899.220240.4922490611-341.292249061083
8619227.518211.55880877091015.94119122910
8717789.617844.3588087709-54.7588087709044
8819220.819727.8838087709-507.083808770905
8922058.620485.67130877091572.92869122910
9021230.820332.9338087709897.866191229096
9119504.419800.4213087709-296.021308770903
9223913.120209.22130877093703.87869122909
9323165.720093.22130877093072.47869122910
9423574.321904.82305661851669.47694338152
952500220415.18555661854586.81444338152
9622603.920347.31055661852256.58944338152
9723408.621203.83247767862204.76752232143


Parameters (Session):
par1 = 1 ; par2 = Include Monthly Dummies ; par3 = Linear Trend ;
Parameters (R input):
par1 = 1 ; par2 = Include Monthly Dummies ; par3 = Linear Trend ;
R code (references can be found in the software module):
library(lattice)
par1 <- as.numeric(par1)
x <- t(y)
k <- length(x[1,])
n <- length(x[,1])
x1 <- cbind(x[,par1], x[,1:k!=par1])
mycolnames <- c(colnames(x)[par1], colnames(x)[1:k!=par1])
colnames(x1) <- mycolnames #colnames(x)[par1]
x <- x1
if (par3 == 'First Differences'){
x2 <- array(0, dim=c(n-1,k), dimnames=list(1:(n-1), paste('(1-B)',colnames(x),sep='')))
for (i in 1:n-1) {
for (j in 1:k) {
x2[i,j] <- x[i+1,j] - x[i,j]
}
}
x <- x2
}
if (par2 == 'Include Monthly Dummies'){
x2 <- array(0, dim=c(n,11), dimnames=list(1:n, paste('M', seq(1:11), sep ='')))
for (i in 1:11){
x2[seq(i,n,12),i] <- 1
}
x <- cbind(x, x2)
}
if (par2 == 'Include Quarterly Dummies'){
x2 <- array(0, dim=c(n,3), dimnames=list(1:n, paste('Q', seq(1:3), sep ='')))
for (i in 1:3){
x2[seq(i,n,4),i] <- 1
}
x <- cbind(x, x2)
}
k <- length(x[1,])
if (par3 == 'Linear Trend'){
x <- cbind(x, c(1:n))
colnames(x)[k+1] <- 't'
}
x
k <- length(x[1,])
df <- as.data.frame(x)
(mylm <- lm(df))
(mysum <- summary(mylm))
bitmap(file='test0.png')
plot(x[,1], type='l', main='Actuals and Interpolation', ylab='value of Actuals and Interpolation (dots)', xlab='time or index')
points(x[,1]-mysum$resid)
grid()
dev.off()
bitmap(file='test1.png')
plot(mysum$resid, type='b', pch=19, main='Residuals', ylab='value of Residuals', xlab='time or index')
grid()
dev.off()
bitmap(file='test2.png')
hist(mysum$resid, main='Residual Histogram', xlab='values of Residuals')
grid()
dev.off()
bitmap(file='test3.png')
densityplot(~mysum$resid,col='black',main='Residual Density Plot', xlab='values of Residuals')
dev.off()
bitmap(file='test4.png')
qqnorm(mysum$resid, main='Residual Normal Q-Q Plot')
grid()
dev.off()
(myerror <- as.ts(mysum$resid))
bitmap(file='test5.png')
dum <- cbind(lag(myerror,k=1),myerror)
dum
dum1 <- dum[2:length(myerror),]
dum1
z <- as.data.frame(dum1)
z
plot(z,main=paste('Residual Lag plot, lowess, and regression line'), ylab='values of Residuals', xlab='lagged values of Residuals')
lines(lowess(z))
abline(lm(z))
grid()
dev.off()
bitmap(file='test6.png')
acf(mysum$resid, lag.max=length(mysum$resid)/2, main='Residual Autocorrelation Function')
grid()
dev.off()
bitmap(file='test7.png')
pacf(mysum$resid, lag.max=length(mysum$resid)/2, main='Residual Partial Autocorrelation Function')
grid()
dev.off()
bitmap(file='test8.png')
opar <- par(mfrow = c(2,2), oma = c(0, 0, 1.1, 0))
plot(mylm, las = 1, sub='Residual Diagnostics')
par(opar)
dev.off()
load(file='createtable')
a<-table.start()
a<-table.row.start(a)
a<-table.element(a, 'Multiple Linear Regression - Estimated Regression Equation', 1, TRUE)
a<-table.row.end(a)
myeq <- colnames(x)[1]
myeq <- paste(myeq, '[t] = ', sep='')
for (i in 1:k){
if (mysum$coefficients[i,1] > 0) myeq <- paste(myeq, '+', '')
myeq <- paste(myeq, mysum$coefficients[i,1], sep=' ')
if (rownames(mysum$coefficients)[i] != '(Intercept)') {
myeq <- paste(myeq, rownames(mysum$coefficients)[i], sep='')
if (rownames(mysum$coefficients)[i] != 't') myeq <- paste(myeq, '[t]', sep='')
}
}
myeq <- paste(myeq, ' + e[t]')
a<-table.row.start(a)
a<-table.element(a, myeq)
a<-table.row.end(a)
a<-table.end(a)
table.save(a,file='mytable1.tab')
a<-table.start()
a<-table.row.start(a)
a<-table.element(a,hyperlink('ols1.htm','Multiple Linear Regression - Ordinary Least Squares',''), 6, TRUE)
a<-table.row.end(a)
a<-table.row.start(a)
a<-table.element(a,'Variable',header=TRUE)
a<-table.element(a,'Parameter',header=TRUE)
a<-table.element(a,'S.D.',header=TRUE)
a<-table.element(a,'T-STAT
H0: parameter = 0',header=TRUE)
a<-table.element(a,'2-tail p-value',header=TRUE)
a<-table.element(a,'1-tail p-value',header=TRUE)
a<-table.row.end(a)
for (i in 1:k){
a<-table.row.start(a)
a<-table.element(a,rownames(mysum$coefficients)[i],header=TRUE)
a<-table.element(a,mysum$coefficients[i,1])
a<-table.element(a, round(mysum$coefficients[i,2],6))
a<-table.element(a, round(mysum$coefficients[i,3],4))
a<-table.element(a, round(mysum$coefficients[i,4],6))
a<-table.element(a, round(mysum$coefficients[i,4]/2,6))
a<-table.row.end(a)
}
a<-table.end(a)
table.save(a,file='mytable2.tab')
a<-table.start()
a<-table.row.start(a)
a<-table.element(a, 'Multiple Linear Regression - Regression Statistics', 2, TRUE)
a<-table.row.end(a)
a<-table.row.start(a)
a<-table.element(a, 'Multiple R',1,TRUE)
a<-table.element(a, sqrt(mysum$r.squared))
a<-table.row.end(a)
a<-table.row.start(a)
a<-table.element(a, 'R-squared',1,TRUE)
a<-table.element(a, mysum$r.squared)
a<-table.row.end(a)
a<-table.row.start(a)
a<-table.element(a, 'Adjusted R-squared',1,TRUE)
a<-table.element(a, mysum$adj.r.squared)
a<-table.row.end(a)
a<-table.row.start(a)
a<-table.element(a, 'F-TEST (value)',1,TRUE)
a<-table.element(a, mysum$fstatistic[1])
a<-table.row.end(a)
a<-table.row.start(a)
a<-table.element(a, 'F-TEST (DF numerator)',1,TRUE)
a<-table.element(a, mysum$fstatistic[2])
a<-table.row.end(a)
a<-table.row.start(a)
a<-table.element(a, 'F-TEST (DF denominator)',1,TRUE)
a<-table.element(a, mysum$fstatistic[3])
a<-table.row.end(a)
a<-table.row.start(a)
a<-table.element(a, 'p-value',1,TRUE)
a<-table.element(a, 1-pf(mysum$fstatistic[1],mysum$fstatistic[2],mysum$fstatistic[3]))
a<-table.row.end(a)
a<-table.row.start(a)
a<-table.element(a, 'Multiple Linear Regression - Residual Statistics', 2, TRUE)
a<-table.row.end(a)
a<-table.row.start(a)
a<-table.element(a, 'Residual Standard Deviation',1,TRUE)
a<-table.element(a, mysum$sigma)
a<-table.row.end(a)
a<-table.row.start(a)
a<-table.element(a, 'Sum Squared Residuals',1,TRUE)
a<-table.element(a, sum(myerror*myerror))
a<-table.row.end(a)
a<-table.end(a)
table.save(a,file='mytable3.tab')
a<-table.start()
a<-table.row.start(a)
a<-table.element(a, 'Multiple Linear Regression - Actuals, Interpolation, and Residuals', 4, TRUE)
a<-table.row.end(a)
a<-table.row.start(a)
a<-table.element(a, 'Time or Index', 1, TRUE)
a<-table.element(a, 'Actuals', 1, TRUE)
a<-table.element(a, 'Interpolation
Forecast', 1, TRUE)
a<-table.element(a, 'Residuals
Prediction Error', 1, TRUE)
a<-table.row.end(a)
for (i in 1:n) {
a<-table.row.start(a)
a<-table.element(a,i, 1, TRUE)
a<-table.element(a,x[i])
a<-table.element(a,x[i]-mysum$resid[i])
a<-table.element(a,mysum$resid[i])
a<-table.row.end(a)
}
a<-table.end(a)
table.save(a,file='mytable4.tab')