Free Statistics

of Irreproducible Research!

Author's title

Author*The author of this computation has been verified*
R Software Modulerwasp_multipleregression.wasp
Title produced by softwareMultiple Regression
Date of computationSun, 23 Nov 2008 07:14:40 -0700
Cite this page as followsStatistical Computations at FreeStatistics.org, Office for Research Development and Education, URL https://freestatistics.org/blog/index.php?v=date/2008/Nov/23/t12274497251zwzgsah2oeqyrz.htm/, Retrieved Fri, 17 May 2024 21:08:45 +0000
Statistical Computations at FreeStatistics.org, Office for Research Development and Education, URL https://freestatistics.org/blog/index.php?pk=25262, Retrieved Fri, 17 May 2024 21:08:45 +0000
QR Codes:

Original text written by user:
IsPrivate?No (this computation is public)
User-defined keywords
Estimated Impact187
Family? (F = Feedback message, R = changed R code, M = changed R Module, P = changed Parameters, D = changed Data)
-     [Multiple Regression] [The seatbelt law] [2007-11-19 10:09:20] [179580f635b5f83b2ee77249aac47f19]
F R  D  [Multiple Regression] [] [2008-11-23 13:19:57] [4c8dfb519edec2da3492d7e6be9a5685]
F   PD    [Multiple Regression] [] [2008-11-23 14:06:19] [4c8dfb519edec2da3492d7e6be9a5685]
-   PD      [Multiple Regression] [] [2008-11-23 14:11:11] [4c8dfb519edec2da3492d7e6be9a5685]
F   P           [Multiple Regression] [] [2008-11-23 14:14:40] [6d40a467de0f28bd2350f82ac9522c51] [Current]
Feedback Forum
2008-11-27 23:41:51 [Bob Leysen] [reply
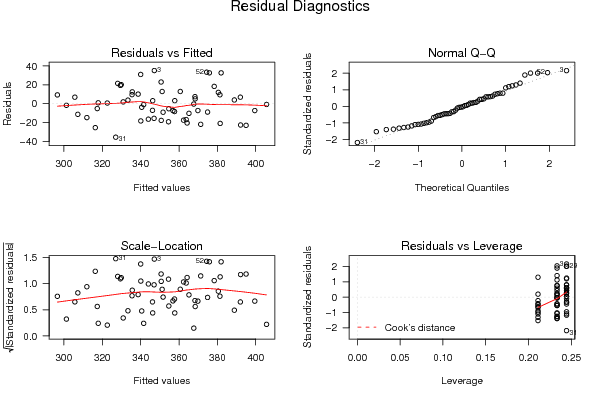
Zoals in Q1 zijn er duidelijke verschillen met of zonder dummies en lineaire trend.

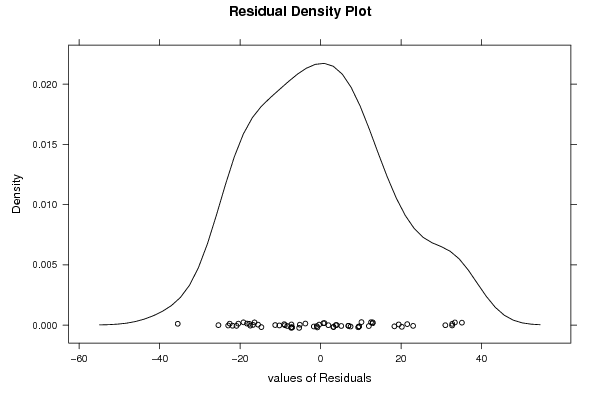
Op de density plot is er meer symmetrie als we seasonaliteit en een lineaire trend toelaten.

Op de QQ-plot liggen de punten niet op de rechte en dit is meer het geval met seasonalitieit en trend.

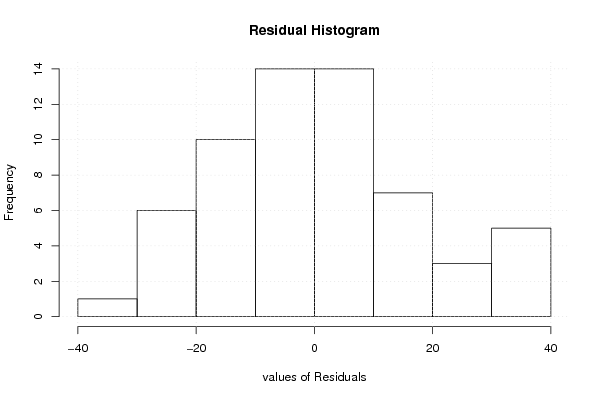
Zonder seasonaliteit en lineaire trend zijn er op de residual histogram meer waarden aan de linkerkant. Met seasonaliteit en trend is deze meer verdeeld.

De R-squared wordt ook hoger met seasonaliteit en trend, dit is het percentage dat aantoont hoeveel procent van de schommelingen te verklaren is.

Post a new message
Dataseries X:
299.63	0
305.945	0
382.252	0
348.846	0
335.367	0
373.617	0
312.612	0
312.232	0
337.161	0
331.476	0
350.103	0
345.127	0
297.256	0
295.979	0
361.007	0
321.803	0
354.937	0
349.432	0
290.979	0
349.576	0
327.625	0
349.377	0
336.777	0
339.134	0
323.321	0
318.86	0
373.583	0
333.03	0
408.556	0
414.646	0
291.514	0
348.857	0
349.368	0
375.765	0
364.136	0
349.53	0
348.167	1
332.856	1
360.551	1
346.969	1
392.815	1
372.02	1
371.027	1
342.672	1
367.343	1
390.786	1
343.785	1
362.6	1
349.468	1
340.624	1
369.536	1
407.782	1
392.239	1
404.824	1
373.669	1
344.902	1
396.7	1
398.911	1
366.009	1
392.484	1


Summary of computational transaction
Raw Inputview raw input (R code)
Raw Outputview raw output of R engine
Computing time7 seconds
R Server'Sir Ronald Aylmer Fisher' @ 193.190.124.24

\begin{tabular}{lllllllll}
\hline
Summary of computational transaction \tabularnewline
Raw Input & view raw input (R code)  \tabularnewline
Raw Output & view raw output of R engine  \tabularnewline
Computing time & 7 seconds \tabularnewline
R Server & 'Sir Ronald Aylmer Fisher' @ 193.190.124.24 \tabularnewline
\hline
\end{tabular}
%Source: https://freestatistics.org/blog/index.php?pk=25262&T=0

[TABLE]
[ROW][C]Summary of computational transaction[/C][/ROW]
[ROW][C]Raw Input[/C][C]view raw input (R code) [/C][/ROW]
[ROW][C]Raw Output[/C][C]view raw output of R engine [/C][/ROW]
[ROW][C]Computing time[/C][C]7 seconds[/C][/ROW]
[ROW][C]R Server[/C][C]'Sir Ronald Aylmer Fisher' @ 193.190.124.24[/C][/ROW]
[/TABLE]
Source: https://freestatistics.org/blog/index.php?pk=25262&T=0

Globally Unique Identifier (entire table): ba.freestatistics.org/blog/index.php?pk=25262&T=0

As an alternative you can also use a QR Code:  

The GUIDs for individual cells are displayed in the table below:

Summary of computational transaction
Raw Inputview raw input (R code)
Raw Outputview raw output of R engine
Computing time7 seconds
R Server'Sir Ronald Aylmer Fisher' @ 193.190.124.24


Multiple Linear Regression - Estimated Regression Equation
x[t] = + 324.873316666667 + 2.36008333333332y[t] -24.4417625M1[t] -30.045075M2[t] + 19.6002125M3[t] + 1.01269999999999M4[t] + 25.2217875M5[t] + 30.459075M6[t] -25.3762375M7[t] -14.5763500000000M8[t] + 0.527537500000004M9[t] + 13.263425M10[t] -4.72528749999999M11[t] + 0.8877125t + e[t]

\begin{tabular}{lllllllll}
\hline
Multiple Linear Regression - Estimated Regression Equation \tabularnewline
x[t] =  +  324.873316666667 +  2.36008333333332y[t] -24.4417625M1[t] -30.045075M2[t] +  19.6002125M3[t] +  1.01269999999999M4[t] +  25.2217875M5[t] +  30.459075M6[t] -25.3762375M7[t] -14.5763500000000M8[t] +  0.527537500000004M9[t] +  13.263425M10[t] -4.72528749999999M11[t] +  0.8877125t  + e[t] \tabularnewline
\hline
\end{tabular}
%Source: https://freestatistics.org/blog/index.php?pk=25262&T=1

[TABLE]
[ROW][C]Multiple Linear Regression - Estimated Regression Equation[/C][/ROW]
[ROW][C]x[t] =  +  324.873316666667 +  2.36008333333332y[t] -24.4417625M1[t] -30.045075M2[t] +  19.6002125M3[t] +  1.01269999999999M4[t] +  25.2217875M5[t] +  30.459075M6[t] -25.3762375M7[t] -14.5763500000000M8[t] +  0.527537500000004M9[t] +  13.263425M10[t] -4.72528749999999M11[t] +  0.8877125t  + e[t][/C][/ROW]
[/TABLE]
Source: https://freestatistics.org/blog/index.php?pk=25262&T=1

Globally Unique Identifier (entire table): ba.freestatistics.org/blog/index.php?pk=25262&T=1

As an alternative you can also use a QR Code:  

The GUIDs for individual cells are displayed in the table below:

Multiple Linear Regression - Estimated Regression Equation
x[t] = + 324.873316666667 + 2.36008333333332y[t] -24.4417625M1[t] -30.045075M2[t] + 19.6002125M3[t] + 1.01269999999999M4[t] + 25.2217875M5[t] + 30.459075M6[t] -25.3762375M7[t] -14.5763500000000M8[t] + 0.527537500000004M9[t] + 13.263425M10[t] -4.72528749999999M11[t] + 0.8877125t + e[t]


Multiple Linear Regression - Ordinary Least Squares
VariableParameterS.D.T-STATH0: parameter = 02-tail p-value1-tail p-value
(Intercept)324.87331666666710.9960129.544700
y2.360083333333329.8747080.2390.8121650.406083
M1-24.441762512.257506-1.9940.0520970.026048
M2-30.04507512.1877-2.46520.0174860.008743
M319.600212512.1241961.61660.1127990.056399
M41.0126999999999912.0670930.08390.9334820.466741
M525.221787512.0164832.09890.0413410.02067
M630.45907511.9724482.54410.0143790.00719
M7-25.376237511.93506-2.12620.0388850.019443
M8-14.576350000000011.904383-1.22450.2270160.113508
M90.52753750000000411.8804680.04440.9647750.482387
M1013.26342511.8633571.1180.2693650.134683
M11-4.7252874999999911.853078-0.39870.6919920.345996
t0.88771250.2850583.11410.0031710.001586

\begin{tabular}{lllllllll}
\hline
Multiple Linear Regression - Ordinary Least Squares \tabularnewline
Variable & Parameter & S.D. & T-STATH0: parameter = 0 & 2-tail p-value & 1-tail p-value \tabularnewline
(Intercept) & 324.873316666667 & 10.99601 & 29.5447 & 0 & 0 \tabularnewline
y & 2.36008333333332 & 9.874708 & 0.239 & 0.812165 & 0.406083 \tabularnewline
M1 & -24.4417625 & 12.257506 & -1.994 & 0.052097 & 0.026048 \tabularnewline
M2 & -30.045075 & 12.1877 & -2.4652 & 0.017486 & 0.008743 \tabularnewline
M3 & 19.6002125 & 12.124196 & 1.6166 & 0.112799 & 0.056399 \tabularnewline
M4 & 1.01269999999999 & 12.067093 & 0.0839 & 0.933482 & 0.466741 \tabularnewline
M5 & 25.2217875 & 12.016483 & 2.0989 & 0.041341 & 0.02067 \tabularnewline
M6 & 30.459075 & 11.972448 & 2.5441 & 0.014379 & 0.00719 \tabularnewline
M7 & -25.3762375 & 11.93506 & -2.1262 & 0.038885 & 0.019443 \tabularnewline
M8 & -14.5763500000000 & 11.904383 & -1.2245 & 0.227016 & 0.113508 \tabularnewline
M9 & 0.527537500000004 & 11.880468 & 0.0444 & 0.964775 & 0.482387 \tabularnewline
M10 & 13.263425 & 11.863357 & 1.118 & 0.269365 & 0.134683 \tabularnewline
M11 & -4.72528749999999 & 11.853078 & -0.3987 & 0.691992 & 0.345996 \tabularnewline
t & 0.8877125 & 0.285058 & 3.1141 & 0.003171 & 0.001586 \tabularnewline
\hline
\end{tabular}
%Source: https://freestatistics.org/blog/index.php?pk=25262&T=2

[TABLE]
[ROW][C]Multiple Linear Regression - Ordinary Least Squares[/C][/ROW]
[ROW][C]Variable[/C][C]Parameter[/C][C]S.D.[/C][C]T-STATH0: parameter = 0[/C][C]2-tail p-value[/C][C]1-tail p-value[/C][/ROW]
[ROW][C](Intercept)[/C][C]324.873316666667[/C][C]10.99601[/C][C]29.5447[/C][C]0[/C][C]0[/C][/ROW]
[ROW][C]y[/C][C]2.36008333333332[/C][C]9.874708[/C][C]0.239[/C][C]0.812165[/C][C]0.406083[/C][/ROW]
[ROW][C]M1[/C][C]-24.4417625[/C][C]12.257506[/C][C]-1.994[/C][C]0.052097[/C][C]0.026048[/C][/ROW]
[ROW][C]M2[/C][C]-30.045075[/C][C]12.1877[/C][C]-2.4652[/C][C]0.017486[/C][C]0.008743[/C][/ROW]
[ROW][C]M3[/C][C]19.6002125[/C][C]12.124196[/C][C]1.6166[/C][C]0.112799[/C][C]0.056399[/C][/ROW]
[ROW][C]M4[/C][C]1.01269999999999[/C][C]12.067093[/C][C]0.0839[/C][C]0.933482[/C][C]0.466741[/C][/ROW]
[ROW][C]M5[/C][C]25.2217875[/C][C]12.016483[/C][C]2.0989[/C][C]0.041341[/C][C]0.02067[/C][/ROW]
[ROW][C]M6[/C][C]30.459075[/C][C]11.972448[/C][C]2.5441[/C][C]0.014379[/C][C]0.00719[/C][/ROW]
[ROW][C]M7[/C][C]-25.3762375[/C][C]11.93506[/C][C]-2.1262[/C][C]0.038885[/C][C]0.019443[/C][/ROW]
[ROW][C]M8[/C][C]-14.5763500000000[/C][C]11.904383[/C][C]-1.2245[/C][C]0.227016[/C][C]0.113508[/C][/ROW]
[ROW][C]M9[/C][C]0.527537500000004[/C][C]11.880468[/C][C]0.0444[/C][C]0.964775[/C][C]0.482387[/C][/ROW]
[ROW][C]M10[/C][C]13.263425[/C][C]11.863357[/C][C]1.118[/C][C]0.269365[/C][C]0.134683[/C][/ROW]
[ROW][C]M11[/C][C]-4.72528749999999[/C][C]11.853078[/C][C]-0.3987[/C][C]0.691992[/C][C]0.345996[/C][/ROW]
[ROW][C]t[/C][C]0.8877125[/C][C]0.285058[/C][C]3.1141[/C][C]0.003171[/C][C]0.001586[/C][/ROW]
[/TABLE]
Source: https://freestatistics.org/blog/index.php?pk=25262&T=2

Globally Unique Identifier (entire table): ba.freestatistics.org/blog/index.php?pk=25262&T=2

As an alternative you can also use a QR Code:  

The GUIDs for individual cells are displayed in the table below:

Multiple Linear Regression - Ordinary Least Squares
VariableParameterS.D.T-STATH0: parameter = 02-tail p-value1-tail p-value
(Intercept)324.87331666666710.9960129.544700
y2.360083333333329.8747080.2390.8121650.406083
M1-24.441762512.257506-1.9940.0520970.026048
M2-30.04507512.1877-2.46520.0174860.008743
M319.600212512.1241961.61660.1127990.056399
M41.0126999999999912.0670930.08390.9334820.466741
M525.221787512.0164832.09890.0413410.02067
M630.45907511.9724482.54410.0143790.00719
M7-25.376237511.93506-2.12620.0388850.019443
M8-14.576350000000011.904383-1.22450.2270160.113508
M90.52753750000000411.8804680.04440.9647750.482387
M1013.26342511.8633571.1180.2693650.134683
M11-4.7252874999999911.853078-0.39870.6919920.345996
t0.88771250.2850583.11410.0031710.001586


Multiple Linear Regression - Regression Statistics
Multiple R0.8433620513171
R-squared0.711259549601787
Adjusted R-squared0.629658987532727
F-TEST (value)8.71635600989898
F-TEST (DF numerator)13
F-TEST (DF denominator)46
p-value1.44897841503067e-08
Multiple Linear Regression - Residual Statistics
Residual Standard Deviation18.7359418727401
Sum Squared Residuals16147.6338215

\begin{tabular}{lllllllll}
\hline
Multiple Linear Regression - Regression Statistics \tabularnewline
Multiple R & 0.8433620513171 \tabularnewline
R-squared & 0.711259549601787 \tabularnewline
Adjusted R-squared & 0.629658987532727 \tabularnewline
F-TEST (value) & 8.71635600989898 \tabularnewline
F-TEST (DF numerator) & 13 \tabularnewline
F-TEST (DF denominator) & 46 \tabularnewline
p-value & 1.44897841503067e-08 \tabularnewline
Multiple Linear Regression - Residual Statistics \tabularnewline
Residual Standard Deviation & 18.7359418727401 \tabularnewline
Sum Squared Residuals & 16147.6338215 \tabularnewline
\hline
\end{tabular}
%Source: https://freestatistics.org/blog/index.php?pk=25262&T=3

[TABLE]
[ROW][C]Multiple Linear Regression - Regression Statistics[/C][/ROW]
[ROW][C]Multiple R[/C][C]0.8433620513171[/C][/ROW]
[ROW][C]R-squared[/C][C]0.711259549601787[/C][/ROW]
[ROW][C]Adjusted R-squared[/C][C]0.629658987532727[/C][/ROW]
[ROW][C]F-TEST (value)[/C][C]8.71635600989898[/C][/ROW]
[ROW][C]F-TEST (DF numerator)[/C][C]13[/C][/ROW]
[ROW][C]F-TEST (DF denominator)[/C][C]46[/C][/ROW]
[ROW][C]p-value[/C][C]1.44897841503067e-08[/C][/ROW]
[ROW][C]Multiple Linear Regression - Residual Statistics[/C][/ROW]
[ROW][C]Residual Standard Deviation[/C][C]18.7359418727401[/C][/ROW]
[ROW][C]Sum Squared Residuals[/C][C]16147.6338215[/C][/ROW]
[/TABLE]
Source: https://freestatistics.org/blog/index.php?pk=25262&T=3

Globally Unique Identifier (entire table): ba.freestatistics.org/blog/index.php?pk=25262&T=3

As an alternative you can also use a QR Code:  

The GUIDs for individual cells are displayed in the table below:

Multiple Linear Regression - Regression Statistics
Multiple R0.8433620513171
R-squared0.711259549601787
Adjusted R-squared0.629658987532727
F-TEST (value)8.71635600989898
F-TEST (DF numerator)13
F-TEST (DF denominator)46
p-value1.44897841503067e-08
Multiple Linear Regression - Residual Statistics
Residual Standard Deviation18.7359418727401
Sum Squared Residuals16147.6338215


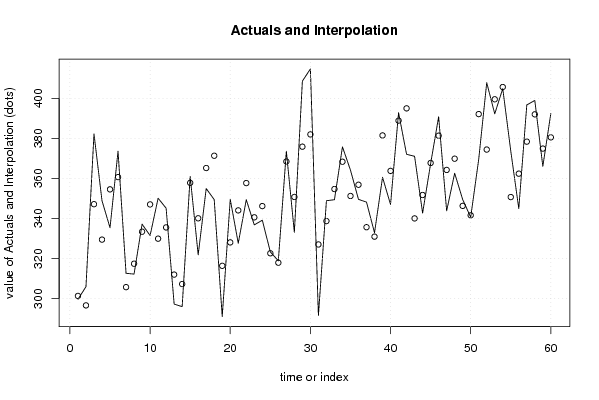
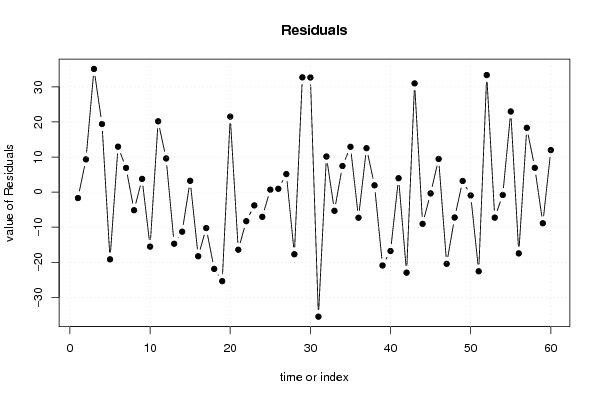
Multiple Linear Regression - Actuals, Interpolation, and Residuals
Time or IndexActualsInterpolationForecastResidualsPrediction Error
1299.63301.319266666667-1.68926666666680
2305.945296.6036666666679.34133333333333
3382.252347.13666666666735.1153333333333
4348.846329.43686666666719.4091333333333
5335.367354.533666666667-19.1666666666666
6373.617360.65866666666712.9583333333333
7312.612305.7110666666676.90093333333334
8312.232317.398666666667-5.16666666666666
9337.161333.3902666666673.77073333333334
10331.476347.013866666667-15.5378666666667
11350.103329.91286666666720.1901333333333
12345.127335.5258666666679.60113333333335
13297.256311.971816666667-14.7158166666667
14295.979307.256216666667-11.2772166666667
15361.007357.7892166666673.21778333333334
16321.803340.089416666667-18.2864166666667
17354.937365.186216666667-10.2492166666666
18349.432371.311216666667-21.8792166666667
19290.979316.363616666667-25.3846166666667
20349.576328.05121666666721.5247833333333
21327.625344.042816666667-16.4178166666667
22349.377357.666416666667-8.28941666666665
23336.777340.565416666667-3.78841666666669
24339.134346.178416666667-7.04441666666665
25323.321322.6243666666670.696633333333397
26318.86317.9087666666670.951233333333345
27373.583368.4417666666675.14123333333335
28333.03350.741966666667-17.7119666666667
29408.556375.83876666666732.7172333333333
30414.646381.96376666666732.6822333333333
31291.514327.016166666667-35.5021666666667
32348.857338.70376666666710.1532333333333
33349.368354.695366666667-5.32736666666667
34375.765368.3189666666677.44603333333333
35364.136351.21796666666712.9180333333333
36349.53356.830966666667-7.30096666666669
37348.167335.63712.5300000000000
38332.856330.92141.9346
39360.551381.4544-20.9034
40346.969363.7546-16.7856
41392.815388.85143.96360000000000
42372.02394.9764-22.9564000000000
43371.027340.028830.9982
44342.672351.7164-9.04439999999999
45367.343367.708-0.364999999999983
46390.786381.33169.4544
47343.785364.2306-20.4456
48362.6369.8436-7.24359999999997
49349.468346.289553.17845000000006
50340.624341.57395-0.94994999999998
51369.536392.10695-22.57095
52407.782374.4071533.37485
53392.239399.50395-7.26495000000003
54404.824405.62895-0.804949999999996
55373.669350.6813522.98765
56344.902362.36895-17.4669500000000
57396.7378.3605518.3394500000000
58398.911391.984156.92684999999999
59366.009374.88315-8.87415
60392.484380.4961511.9878500000000

\begin{tabular}{lllllllll}
\hline
Multiple Linear Regression - Actuals, Interpolation, and Residuals \tabularnewline
Time or Index & Actuals & InterpolationForecast & ResidualsPrediction Error \tabularnewline
1 & 299.63 & 301.319266666667 & -1.68926666666680 \tabularnewline
2 & 305.945 & 296.603666666667 & 9.34133333333333 \tabularnewline
3 & 382.252 & 347.136666666667 & 35.1153333333333 \tabularnewline
4 & 348.846 & 329.436866666667 & 19.4091333333333 \tabularnewline
5 & 335.367 & 354.533666666667 & -19.1666666666666 \tabularnewline
6 & 373.617 & 360.658666666667 & 12.9583333333333 \tabularnewline
7 & 312.612 & 305.711066666667 & 6.90093333333334 \tabularnewline
8 & 312.232 & 317.398666666667 & -5.16666666666666 \tabularnewline
9 & 337.161 & 333.390266666667 & 3.77073333333334 \tabularnewline
10 & 331.476 & 347.013866666667 & -15.5378666666667 \tabularnewline
11 & 350.103 & 329.912866666667 & 20.1901333333333 \tabularnewline
12 & 345.127 & 335.525866666667 & 9.60113333333335 \tabularnewline
13 & 297.256 & 311.971816666667 & -14.7158166666667 \tabularnewline
14 & 295.979 & 307.256216666667 & -11.2772166666667 \tabularnewline
15 & 361.007 & 357.789216666667 & 3.21778333333334 \tabularnewline
16 & 321.803 & 340.089416666667 & -18.2864166666667 \tabularnewline
17 & 354.937 & 365.186216666667 & -10.2492166666666 \tabularnewline
18 & 349.432 & 371.311216666667 & -21.8792166666667 \tabularnewline
19 & 290.979 & 316.363616666667 & -25.3846166666667 \tabularnewline
20 & 349.576 & 328.051216666667 & 21.5247833333333 \tabularnewline
21 & 327.625 & 344.042816666667 & -16.4178166666667 \tabularnewline
22 & 349.377 & 357.666416666667 & -8.28941666666665 \tabularnewline
23 & 336.777 & 340.565416666667 & -3.78841666666669 \tabularnewline
24 & 339.134 & 346.178416666667 & -7.04441666666665 \tabularnewline
25 & 323.321 & 322.624366666667 & 0.696633333333397 \tabularnewline
26 & 318.86 & 317.908766666667 & 0.951233333333345 \tabularnewline
27 & 373.583 & 368.441766666667 & 5.14123333333335 \tabularnewline
28 & 333.03 & 350.741966666667 & -17.7119666666667 \tabularnewline
29 & 408.556 & 375.838766666667 & 32.7172333333333 \tabularnewline
30 & 414.646 & 381.963766666667 & 32.6822333333333 \tabularnewline
31 & 291.514 & 327.016166666667 & -35.5021666666667 \tabularnewline
32 & 348.857 & 338.703766666667 & 10.1532333333333 \tabularnewline
33 & 349.368 & 354.695366666667 & -5.32736666666667 \tabularnewline
34 & 375.765 & 368.318966666667 & 7.44603333333333 \tabularnewline
35 & 364.136 & 351.217966666667 & 12.9180333333333 \tabularnewline
36 & 349.53 & 356.830966666667 & -7.30096666666669 \tabularnewline
37 & 348.167 & 335.637 & 12.5300000000000 \tabularnewline
38 & 332.856 & 330.9214 & 1.9346 \tabularnewline
39 & 360.551 & 381.4544 & -20.9034 \tabularnewline
40 & 346.969 & 363.7546 & -16.7856 \tabularnewline
41 & 392.815 & 388.8514 & 3.96360000000000 \tabularnewline
42 & 372.02 & 394.9764 & -22.9564000000000 \tabularnewline
43 & 371.027 & 340.0288 & 30.9982 \tabularnewline
44 & 342.672 & 351.7164 & -9.04439999999999 \tabularnewline
45 & 367.343 & 367.708 & -0.364999999999983 \tabularnewline
46 & 390.786 & 381.3316 & 9.4544 \tabularnewline
47 & 343.785 & 364.2306 & -20.4456 \tabularnewline
48 & 362.6 & 369.8436 & -7.24359999999997 \tabularnewline
49 & 349.468 & 346.28955 & 3.17845000000006 \tabularnewline
50 & 340.624 & 341.57395 & -0.94994999999998 \tabularnewline
51 & 369.536 & 392.10695 & -22.57095 \tabularnewline
52 & 407.782 & 374.40715 & 33.37485 \tabularnewline
53 & 392.239 & 399.50395 & -7.26495000000003 \tabularnewline
54 & 404.824 & 405.62895 & -0.804949999999996 \tabularnewline
55 & 373.669 & 350.68135 & 22.98765 \tabularnewline
56 & 344.902 & 362.36895 & -17.4669500000000 \tabularnewline
57 & 396.7 & 378.36055 & 18.3394500000000 \tabularnewline
58 & 398.911 & 391.98415 & 6.92684999999999 \tabularnewline
59 & 366.009 & 374.88315 & -8.87415 \tabularnewline
60 & 392.484 & 380.49615 & 11.9878500000000 \tabularnewline
\hline
\end{tabular}
%Source: https://freestatistics.org/blog/index.php?pk=25262&T=4

[TABLE]
[ROW][C]Multiple Linear Regression - Actuals, Interpolation, and Residuals[/C][/ROW]
[ROW][C]Time or Index[/C][C]Actuals[/C][C]InterpolationForecast[/C][C]ResidualsPrediction Error[/C][/ROW]
[ROW][C]1[/C][C]299.63[/C][C]301.319266666667[/C][C]-1.68926666666680[/C][/ROW]
[ROW][C]2[/C][C]305.945[/C][C]296.603666666667[/C][C]9.34133333333333[/C][/ROW]
[ROW][C]3[/C][C]382.252[/C][C]347.136666666667[/C][C]35.1153333333333[/C][/ROW]
[ROW][C]4[/C][C]348.846[/C][C]329.436866666667[/C][C]19.4091333333333[/C][/ROW]
[ROW][C]5[/C][C]335.367[/C][C]354.533666666667[/C][C]-19.1666666666666[/C][/ROW]
[ROW][C]6[/C][C]373.617[/C][C]360.658666666667[/C][C]12.9583333333333[/C][/ROW]
[ROW][C]7[/C][C]312.612[/C][C]305.711066666667[/C][C]6.90093333333334[/C][/ROW]
[ROW][C]8[/C][C]312.232[/C][C]317.398666666667[/C][C]-5.16666666666666[/C][/ROW]
[ROW][C]9[/C][C]337.161[/C][C]333.390266666667[/C][C]3.77073333333334[/C][/ROW]
[ROW][C]10[/C][C]331.476[/C][C]347.013866666667[/C][C]-15.5378666666667[/C][/ROW]
[ROW][C]11[/C][C]350.103[/C][C]329.912866666667[/C][C]20.1901333333333[/C][/ROW]
[ROW][C]12[/C][C]345.127[/C][C]335.525866666667[/C][C]9.60113333333335[/C][/ROW]
[ROW][C]13[/C][C]297.256[/C][C]311.971816666667[/C][C]-14.7158166666667[/C][/ROW]
[ROW][C]14[/C][C]295.979[/C][C]307.256216666667[/C][C]-11.2772166666667[/C][/ROW]
[ROW][C]15[/C][C]361.007[/C][C]357.789216666667[/C][C]3.21778333333334[/C][/ROW]
[ROW][C]16[/C][C]321.803[/C][C]340.089416666667[/C][C]-18.2864166666667[/C][/ROW]
[ROW][C]17[/C][C]354.937[/C][C]365.186216666667[/C][C]-10.2492166666666[/C][/ROW]
[ROW][C]18[/C][C]349.432[/C][C]371.311216666667[/C][C]-21.8792166666667[/C][/ROW]
[ROW][C]19[/C][C]290.979[/C][C]316.363616666667[/C][C]-25.3846166666667[/C][/ROW]
[ROW][C]20[/C][C]349.576[/C][C]328.051216666667[/C][C]21.5247833333333[/C][/ROW]
[ROW][C]21[/C][C]327.625[/C][C]344.042816666667[/C][C]-16.4178166666667[/C][/ROW]
[ROW][C]22[/C][C]349.377[/C][C]357.666416666667[/C][C]-8.28941666666665[/C][/ROW]
[ROW][C]23[/C][C]336.777[/C][C]340.565416666667[/C][C]-3.78841666666669[/C][/ROW]
[ROW][C]24[/C][C]339.134[/C][C]346.178416666667[/C][C]-7.04441666666665[/C][/ROW]
[ROW][C]25[/C][C]323.321[/C][C]322.624366666667[/C][C]0.696633333333397[/C][/ROW]
[ROW][C]26[/C][C]318.86[/C][C]317.908766666667[/C][C]0.951233333333345[/C][/ROW]
[ROW][C]27[/C][C]373.583[/C][C]368.441766666667[/C][C]5.14123333333335[/C][/ROW]
[ROW][C]28[/C][C]333.03[/C][C]350.741966666667[/C][C]-17.7119666666667[/C][/ROW]
[ROW][C]29[/C][C]408.556[/C][C]375.838766666667[/C][C]32.7172333333333[/C][/ROW]
[ROW][C]30[/C][C]414.646[/C][C]381.963766666667[/C][C]32.6822333333333[/C][/ROW]
[ROW][C]31[/C][C]291.514[/C][C]327.016166666667[/C][C]-35.5021666666667[/C][/ROW]
[ROW][C]32[/C][C]348.857[/C][C]338.703766666667[/C][C]10.1532333333333[/C][/ROW]
[ROW][C]33[/C][C]349.368[/C][C]354.695366666667[/C][C]-5.32736666666667[/C][/ROW]
[ROW][C]34[/C][C]375.765[/C][C]368.318966666667[/C][C]7.44603333333333[/C][/ROW]
[ROW][C]35[/C][C]364.136[/C][C]351.217966666667[/C][C]12.9180333333333[/C][/ROW]
[ROW][C]36[/C][C]349.53[/C][C]356.830966666667[/C][C]-7.30096666666669[/C][/ROW]
[ROW][C]37[/C][C]348.167[/C][C]335.637[/C][C]12.5300000000000[/C][/ROW]
[ROW][C]38[/C][C]332.856[/C][C]330.9214[/C][C]1.9346[/C][/ROW]
[ROW][C]39[/C][C]360.551[/C][C]381.4544[/C][C]-20.9034[/C][/ROW]
[ROW][C]40[/C][C]346.969[/C][C]363.7546[/C][C]-16.7856[/C][/ROW]
[ROW][C]41[/C][C]392.815[/C][C]388.8514[/C][C]3.96360000000000[/C][/ROW]
[ROW][C]42[/C][C]372.02[/C][C]394.9764[/C][C]-22.9564000000000[/C][/ROW]
[ROW][C]43[/C][C]371.027[/C][C]340.0288[/C][C]30.9982[/C][/ROW]
[ROW][C]44[/C][C]342.672[/C][C]351.7164[/C][C]-9.04439999999999[/C][/ROW]
[ROW][C]45[/C][C]367.343[/C][C]367.708[/C][C]-0.364999999999983[/C][/ROW]
[ROW][C]46[/C][C]390.786[/C][C]381.3316[/C][C]9.4544[/C][/ROW]
[ROW][C]47[/C][C]343.785[/C][C]364.2306[/C][C]-20.4456[/C][/ROW]
[ROW][C]48[/C][C]362.6[/C][C]369.8436[/C][C]-7.24359999999997[/C][/ROW]
[ROW][C]49[/C][C]349.468[/C][C]346.28955[/C][C]3.17845000000006[/C][/ROW]
[ROW][C]50[/C][C]340.624[/C][C]341.57395[/C][C]-0.94994999999998[/C][/ROW]
[ROW][C]51[/C][C]369.536[/C][C]392.10695[/C][C]-22.57095[/C][/ROW]
[ROW][C]52[/C][C]407.782[/C][C]374.40715[/C][C]33.37485[/C][/ROW]
[ROW][C]53[/C][C]392.239[/C][C]399.50395[/C][C]-7.26495000000003[/C][/ROW]
[ROW][C]54[/C][C]404.824[/C][C]405.62895[/C][C]-0.804949999999996[/C][/ROW]
[ROW][C]55[/C][C]373.669[/C][C]350.68135[/C][C]22.98765[/C][/ROW]
[ROW][C]56[/C][C]344.902[/C][C]362.36895[/C][C]-17.4669500000000[/C][/ROW]
[ROW][C]57[/C][C]396.7[/C][C]378.36055[/C][C]18.3394500000000[/C][/ROW]
[ROW][C]58[/C][C]398.911[/C][C]391.98415[/C][C]6.92684999999999[/C][/ROW]
[ROW][C]59[/C][C]366.009[/C][C]374.88315[/C][C]-8.87415[/C][/ROW]
[ROW][C]60[/C][C]392.484[/C][C]380.49615[/C][C]11.9878500000000[/C][/ROW]
[/TABLE]
Source: https://freestatistics.org/blog/index.php?pk=25262&T=4

Globally Unique Identifier (entire table): ba.freestatistics.org/blog/index.php?pk=25262&T=4

As an alternative you can also use a QR Code:  

The GUIDs for individual cells are displayed in the table below:

Multiple Linear Regression - Actuals, Interpolation, and Residuals
Time or IndexActualsInterpolationForecastResidualsPrediction Error
1299.63301.319266666667-1.68926666666680
2305.945296.6036666666679.34133333333333
3382.252347.13666666666735.1153333333333
4348.846329.43686666666719.4091333333333
5335.367354.533666666667-19.1666666666666
6373.617360.65866666666712.9583333333333
7312.612305.7110666666676.90093333333334
8312.232317.398666666667-5.16666666666666
9337.161333.3902666666673.77073333333334
10331.476347.013866666667-15.5378666666667
11350.103329.91286666666720.1901333333333
12345.127335.5258666666679.60113333333335
13297.256311.971816666667-14.7158166666667
14295.979307.256216666667-11.2772166666667
15361.007357.7892166666673.21778333333334
16321.803340.089416666667-18.2864166666667
17354.937365.186216666667-10.2492166666666
18349.432371.311216666667-21.8792166666667
19290.979316.363616666667-25.3846166666667
20349.576328.05121666666721.5247833333333
21327.625344.042816666667-16.4178166666667
22349.377357.666416666667-8.28941666666665
23336.777340.565416666667-3.78841666666669
24339.134346.178416666667-7.04441666666665
25323.321322.6243666666670.696633333333397
26318.86317.9087666666670.951233333333345
27373.583368.4417666666675.14123333333335
28333.03350.741966666667-17.7119666666667
29408.556375.83876666666732.7172333333333
30414.646381.96376666666732.6822333333333
31291.514327.016166666667-35.5021666666667
32348.857338.70376666666710.1532333333333
33349.368354.695366666667-5.32736666666667
34375.765368.3189666666677.44603333333333
35364.136351.21796666666712.9180333333333
36349.53356.830966666667-7.30096666666669
37348.167335.63712.5300000000000
38332.856330.92141.9346
39360.551381.4544-20.9034
40346.969363.7546-16.7856
41392.815388.85143.96360000000000
42372.02394.9764-22.9564000000000
43371.027340.028830.9982
44342.672351.7164-9.04439999999999
45367.343367.708-0.364999999999983
46390.786381.33169.4544
47343.785364.2306-20.4456
48362.6369.8436-7.24359999999997
49349.468346.289553.17845000000006
50340.624341.57395-0.94994999999998
51369.536392.10695-22.57095
52407.782374.4071533.37485
53392.239399.50395-7.26495000000003
54404.824405.62895-0.804949999999996
55373.669350.6813522.98765
56344.902362.36895-17.4669500000000
57396.7378.3605518.3394500000000
58398.911391.984156.92684999999999
59366.009374.88315-8.87415
60392.484380.4961511.9878500000000


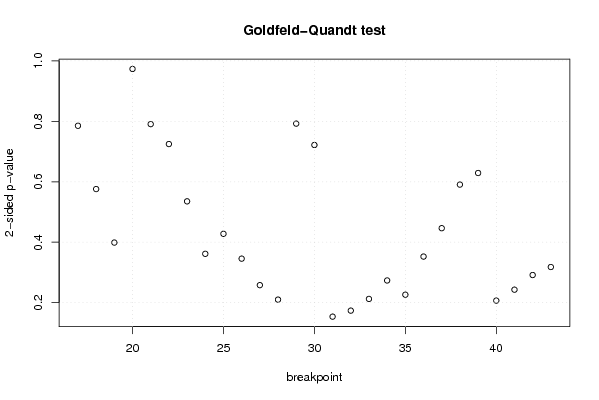
Goldfeld-Quandt test for Heteroskedasticity
p-valuesAlternative Hypothesis
breakpoint indexgreater2-sidedless
170.3926905682687030.7853811365374050.607309431731297
180.2879721949146960.5759443898293910.712027805085304
190.1993615441264770.3987230882529540.800638455873523
200.5132627420424540.9734745159150910.486737257957546
210.3954027641737190.7908055283474380.604597235826281
220.3624547992140170.7249095984280340.637545200785983
230.267632097035040.535264194070080.73236790296496
240.1807439690768350.3614879381536690.819256030923165
250.2138694023830290.4277388047660570.786130597616971
260.1727584404897340.3455168809794670.827241559510266
270.1288802785649700.2577605571299400.87111972143503
280.1049414947615360.2098829895230720.895058505238464
290.3962384774496080.7924769548992150.603761522550393
300.6391090947947060.7217818104105870.360890905205294
310.9232513199112140.1534973601775720.076748680088786
320.9132851338257280.1734297323485440.086714866174272
330.8939286708740630.2121426582518730.106071329125937
340.8633679336829140.2732641326341730.136632066317086
350.8869229040219020.2261541919561970.113077095978098
360.8238085571038050.3523828857923900.176191442896195
370.7768391615889020.4463216768221960.223160838411098
380.7046776574040580.5906446851918840.295322342595942
390.6854873028917290.6290253942165420.314512697108271
400.89672143176020.2065571364795990.103278568239800
410.8786166240761280.2427667518477450.121383375923872
420.8543441881815620.2913116236368760.145655811818438
430.8410847291665250.3178305416669510.158915270833476

\begin{tabular}{lllllllll}
\hline
Goldfeld-Quandt test for Heteroskedasticity \tabularnewline
p-values & Alternative Hypothesis \tabularnewline
breakpoint index & greater & 2-sided & less \tabularnewline
17 & 0.392690568268703 & 0.785381136537405 & 0.607309431731297 \tabularnewline
18 & 0.287972194914696 & 0.575944389829391 & 0.712027805085304 \tabularnewline
19 & 0.199361544126477 & 0.398723088252954 & 0.800638455873523 \tabularnewline
20 & 0.513262742042454 & 0.973474515915091 & 0.486737257957546 \tabularnewline
21 & 0.395402764173719 & 0.790805528347438 & 0.604597235826281 \tabularnewline
22 & 0.362454799214017 & 0.724909598428034 & 0.637545200785983 \tabularnewline
23 & 0.26763209703504 & 0.53526419407008 & 0.73236790296496 \tabularnewline
24 & 0.180743969076835 & 0.361487938153669 & 0.819256030923165 \tabularnewline
25 & 0.213869402383029 & 0.427738804766057 & 0.786130597616971 \tabularnewline
26 & 0.172758440489734 & 0.345516880979467 & 0.827241559510266 \tabularnewline
27 & 0.128880278564970 & 0.257760557129940 & 0.87111972143503 \tabularnewline
28 & 0.104941494761536 & 0.209882989523072 & 0.895058505238464 \tabularnewline
29 & 0.396238477449608 & 0.792476954899215 & 0.603761522550393 \tabularnewline
30 & 0.639109094794706 & 0.721781810410587 & 0.360890905205294 \tabularnewline
31 & 0.923251319911214 & 0.153497360177572 & 0.076748680088786 \tabularnewline
32 & 0.913285133825728 & 0.173429732348544 & 0.086714866174272 \tabularnewline
33 & 0.893928670874063 & 0.212142658251873 & 0.106071329125937 \tabularnewline
34 & 0.863367933682914 & 0.273264132634173 & 0.136632066317086 \tabularnewline
35 & 0.886922904021902 & 0.226154191956197 & 0.113077095978098 \tabularnewline
36 & 0.823808557103805 & 0.352382885792390 & 0.176191442896195 \tabularnewline
37 & 0.776839161588902 & 0.446321676822196 & 0.223160838411098 \tabularnewline
38 & 0.704677657404058 & 0.590644685191884 & 0.295322342595942 \tabularnewline
39 & 0.685487302891729 & 0.629025394216542 & 0.314512697108271 \tabularnewline
40 & 0.8967214317602 & 0.206557136479599 & 0.103278568239800 \tabularnewline
41 & 0.878616624076128 & 0.242766751847745 & 0.121383375923872 \tabularnewline
42 & 0.854344188181562 & 0.291311623636876 & 0.145655811818438 \tabularnewline
43 & 0.841084729166525 & 0.317830541666951 & 0.158915270833476 \tabularnewline
\hline
\end{tabular}
%Source: https://freestatistics.org/blog/index.php?pk=25262&T=5

[TABLE]
[ROW][C]Goldfeld-Quandt test for Heteroskedasticity[/C][/ROW]
[ROW][C]p-values[/C][C]Alternative Hypothesis[/C][/ROW]
[ROW][C]breakpoint index[/C][C]greater[/C][C]2-sided[/C][C]less[/C][/ROW]
[ROW][C]17[/C][C]0.392690568268703[/C][C]0.785381136537405[/C][C]0.607309431731297[/C][/ROW]
[ROW][C]18[/C][C]0.287972194914696[/C][C]0.575944389829391[/C][C]0.712027805085304[/C][/ROW]
[ROW][C]19[/C][C]0.199361544126477[/C][C]0.398723088252954[/C][C]0.800638455873523[/C][/ROW]
[ROW][C]20[/C][C]0.513262742042454[/C][C]0.973474515915091[/C][C]0.486737257957546[/C][/ROW]
[ROW][C]21[/C][C]0.395402764173719[/C][C]0.790805528347438[/C][C]0.604597235826281[/C][/ROW]
[ROW][C]22[/C][C]0.362454799214017[/C][C]0.724909598428034[/C][C]0.637545200785983[/C][/ROW]
[ROW][C]23[/C][C]0.26763209703504[/C][C]0.53526419407008[/C][C]0.73236790296496[/C][/ROW]
[ROW][C]24[/C][C]0.180743969076835[/C][C]0.361487938153669[/C][C]0.819256030923165[/C][/ROW]
[ROW][C]25[/C][C]0.213869402383029[/C][C]0.427738804766057[/C][C]0.786130597616971[/C][/ROW]
[ROW][C]26[/C][C]0.172758440489734[/C][C]0.345516880979467[/C][C]0.827241559510266[/C][/ROW]
[ROW][C]27[/C][C]0.128880278564970[/C][C]0.257760557129940[/C][C]0.87111972143503[/C][/ROW]
[ROW][C]28[/C][C]0.104941494761536[/C][C]0.209882989523072[/C][C]0.895058505238464[/C][/ROW]
[ROW][C]29[/C][C]0.396238477449608[/C][C]0.792476954899215[/C][C]0.603761522550393[/C][/ROW]
[ROW][C]30[/C][C]0.639109094794706[/C][C]0.721781810410587[/C][C]0.360890905205294[/C][/ROW]
[ROW][C]31[/C][C]0.923251319911214[/C][C]0.153497360177572[/C][C]0.076748680088786[/C][/ROW]
[ROW][C]32[/C][C]0.913285133825728[/C][C]0.173429732348544[/C][C]0.086714866174272[/C][/ROW]
[ROW][C]33[/C][C]0.893928670874063[/C][C]0.212142658251873[/C][C]0.106071329125937[/C][/ROW]
[ROW][C]34[/C][C]0.863367933682914[/C][C]0.273264132634173[/C][C]0.136632066317086[/C][/ROW]
[ROW][C]35[/C][C]0.886922904021902[/C][C]0.226154191956197[/C][C]0.113077095978098[/C][/ROW]
[ROW][C]36[/C][C]0.823808557103805[/C][C]0.352382885792390[/C][C]0.176191442896195[/C][/ROW]
[ROW][C]37[/C][C]0.776839161588902[/C][C]0.446321676822196[/C][C]0.223160838411098[/C][/ROW]
[ROW][C]38[/C][C]0.704677657404058[/C][C]0.590644685191884[/C][C]0.295322342595942[/C][/ROW]
[ROW][C]39[/C][C]0.685487302891729[/C][C]0.629025394216542[/C][C]0.314512697108271[/C][/ROW]
[ROW][C]40[/C][C]0.8967214317602[/C][C]0.206557136479599[/C][C]0.103278568239800[/C][/ROW]
[ROW][C]41[/C][C]0.878616624076128[/C][C]0.242766751847745[/C][C]0.121383375923872[/C][/ROW]
[ROW][C]42[/C][C]0.854344188181562[/C][C]0.291311623636876[/C][C]0.145655811818438[/C][/ROW]
[ROW][C]43[/C][C]0.841084729166525[/C][C]0.317830541666951[/C][C]0.158915270833476[/C][/ROW]
[/TABLE]
Source: https://freestatistics.org/blog/index.php?pk=25262&T=5

Globally Unique Identifier (entire table): ba.freestatistics.org/blog/index.php?pk=25262&T=5

As an alternative you can also use a QR Code:  

The GUIDs for individual cells are displayed in the table below:

Goldfeld-Quandt test for Heteroskedasticity
p-valuesAlternative Hypothesis
breakpoint indexgreater2-sidedless
170.3926905682687030.7853811365374050.607309431731297
180.2879721949146960.5759443898293910.712027805085304
190.1993615441264770.3987230882529540.800638455873523
200.5132627420424540.9734745159150910.486737257957546
210.3954027641737190.7908055283474380.604597235826281
220.3624547992140170.7249095984280340.637545200785983
230.267632097035040.535264194070080.73236790296496
240.1807439690768350.3614879381536690.819256030923165
250.2138694023830290.4277388047660570.786130597616971
260.1727584404897340.3455168809794670.827241559510266
270.1288802785649700.2577605571299400.87111972143503
280.1049414947615360.2098829895230720.895058505238464
290.3962384774496080.7924769548992150.603761522550393
300.6391090947947060.7217818104105870.360890905205294
310.9232513199112140.1534973601775720.076748680088786
320.9132851338257280.1734297323485440.086714866174272
330.8939286708740630.2121426582518730.106071329125937
340.8633679336829140.2732641326341730.136632066317086
350.8869229040219020.2261541919561970.113077095978098
360.8238085571038050.3523828857923900.176191442896195
370.7768391615889020.4463216768221960.223160838411098
380.7046776574040580.5906446851918840.295322342595942
390.6854873028917290.6290253942165420.314512697108271
400.89672143176020.2065571364795990.103278568239800
410.8786166240761280.2427667518477450.121383375923872
420.8543441881815620.2913116236368760.145655811818438
430.8410847291665250.3178305416669510.158915270833476


Meta Analysis of Goldfeld-Quandt test for Heteroskedasticity
Description# significant tests% significant testsOK/NOK
1% type I error level00OK
5% type I error level00OK
10% type I error level00OK

\begin{tabular}{lllllllll}
\hline
Meta Analysis of Goldfeld-Quandt test for Heteroskedasticity \tabularnewline
Description & # significant tests & % significant tests & OK/NOK \tabularnewline
1% type I error level & 0 & 0 & OK \tabularnewline
5% type I error level & 0 & 0 & OK \tabularnewline
10% type I error level & 0 & 0 & OK \tabularnewline
\hline
\end{tabular}
%Source: https://freestatistics.org/blog/index.php?pk=25262&T=6

[TABLE]
[ROW][C]Meta Analysis of Goldfeld-Quandt test for Heteroskedasticity[/C][/ROW]
[ROW][C]Description[/C][C]# significant tests[/C][C]% significant tests[/C][C]OK/NOK[/C][/ROW]
[ROW][C]1% type I error level[/C][C]0[/C][C]0[/C][C]OK[/C][/ROW]
[ROW][C]5% type I error level[/C][C]0[/C][C]0[/C][C]OK[/C][/ROW]
[ROW][C]10% type I error level[/C][C]0[/C][C]0[/C][C]OK[/C][/ROW]
[/TABLE]
Source: https://freestatistics.org/blog/index.php?pk=25262&T=6

Globally Unique Identifier (entire table): ba.freestatistics.org/blog/index.php?pk=25262&T=6

As an alternative you can also use a QR Code:  

The GUIDs for individual cells are displayed in the table below:

Meta Analysis of Goldfeld-Quandt test for Heteroskedasticity
Description# significant tests% significant testsOK/NOK
1% type I error level00OK
5% type I error level00OK
10% type I error level00OK


Parameters (Session):
par1 = 1 ; par2 = Include Monthly Dummies ; par3 = Linear Trend ;
Parameters (R input):
par1 = 1 ; par2 = Include Monthly Dummies ; par3 = Linear Trend ;
R code (references can be found in the software module):
library(lattice)
library(lmtest)
n25 <- 25 #minimum number of obs. for Goldfeld-Quandt test
par1 <- as.numeric(par1)
x <- t(y)
k <- length(x[1,])
n <- length(x[,1])
x1 <- cbind(x[,par1], x[,1:k!=par1])
mycolnames <- c(colnames(x)[par1], colnames(x)[1:k!=par1])
colnames(x1) <- mycolnames #colnames(x)[par1]
x <- x1
if (par3 == 'First Differences'){
x2 <- array(0, dim=c(n-1,k), dimnames=list(1:(n-1), paste('(1-B)',colnames(x),sep='')))
for (i in 1:n-1) {
for (j in 1:k) {
x2[i,j] <- x[i+1,j] - x[i,j]
}
}
x <- x2
}
if (par2 == 'Include Monthly Dummies'){
x2 <- array(0, dim=c(n,11), dimnames=list(1:n, paste('M', seq(1:11), sep ='')))
for (i in 1:11){
x2[seq(i,n,12),i] <- 1
}
x <- cbind(x, x2)
}
if (par2 == 'Include Quarterly Dummies'){
x2 <- array(0, dim=c(n,3), dimnames=list(1:n, paste('Q', seq(1:3), sep ='')))
for (i in 1:3){
x2[seq(i,n,4),i] <- 1
}
x <- cbind(x, x2)
}
k <- length(x[1,])
if (par3 == 'Linear Trend'){
x <- cbind(x, c(1:n))
colnames(x)[k+1] <- 't'
}
x
k <- length(x[1,])
df <- as.data.frame(x)
(mylm <- lm(df))
(mysum <- summary(mylm))
if (n > n25) {
kp3 <- k + 3
nmkm3 <- n - k - 3
gqarr <- array(NA, dim=c(nmkm3-kp3+1,3))
numgqtests <- 0
numsignificant1 <- 0
numsignificant5 <- 0
numsignificant10 <- 0
for (mypoint in kp3:nmkm3) {
j <- 0
numgqtests <- numgqtests + 1
for (myalt in c('greater', 'two.sided', 'less')) {
j <- j + 1
gqarr[mypoint-kp3+1,j] <- gqtest(mylm, point=mypoint, alternative=myalt)$p.value
}
if (gqarr[mypoint-kp3+1,2] < 0.01) numsignificant1 <- numsignificant1 + 1
if (gqarr[mypoint-kp3+1,2] < 0.05) numsignificant5 <- numsignificant5 + 1
if (gqarr[mypoint-kp3+1,2] < 0.10) numsignificant10 <- numsignificant10 + 1
}
gqarr
}
bitmap(file='test0.png')
plot(x[,1], type='l', main='Actuals and Interpolation', ylab='value of Actuals and Interpolation (dots)', xlab='time or index')
points(x[,1]-mysum$resid)
grid()
dev.off()
bitmap(file='test1.png')
plot(mysum$resid, type='b', pch=19, main='Residuals', ylab='value of Residuals', xlab='time or index')
grid()
dev.off()
bitmap(file='test2.png')
hist(mysum$resid, main='Residual Histogram', xlab='values of Residuals')
grid()
dev.off()
bitmap(file='test3.png')
densityplot(~mysum$resid,col='black',main='Residual Density Plot', xlab='values of Residuals')
dev.off()
bitmap(file='test4.png')
qqnorm(mysum$resid, main='Residual Normal Q-Q Plot')
qqline(mysum$resid)
grid()
dev.off()
(myerror <- as.ts(mysum$resid))
bitmap(file='test5.png')
dum <- cbind(lag(myerror,k=1),myerror)
dum
dum1 <- dum[2:length(myerror),]
dum1
z <- as.data.frame(dum1)
z
plot(z,main=paste('Residual Lag plot, lowess, and regression line'), ylab='values of Residuals', xlab='lagged values of Residuals')
lines(lowess(z))
abline(lm(z))
grid()
dev.off()
bitmap(file='test6.png')
acf(mysum$resid, lag.max=length(mysum$resid)/2, main='Residual Autocorrelation Function')
grid()
dev.off()
bitmap(file='test7.png')
pacf(mysum$resid, lag.max=length(mysum$resid)/2, main='Residual Partial Autocorrelation Function')
grid()
dev.off()
bitmap(file='test8.png')
opar <- par(mfrow = c(2,2), oma = c(0, 0, 1.1, 0))
plot(mylm, las = 1, sub='Residual Diagnostics')
par(opar)
dev.off()
if (n > n25) {
bitmap(file='test9.png')
plot(kp3:nmkm3,gqarr[,2], main='Goldfeld-Quandt test',ylab='2-sided p-value',xlab='breakpoint')
grid()
dev.off()
}
load(file='createtable')
a<-table.start()
a<-table.row.start(a)
a<-table.element(a, 'Multiple Linear Regression - Estimated Regression Equation', 1, TRUE)
a<-table.row.end(a)
myeq <- colnames(x)[1]
myeq <- paste(myeq, '[t] = ', sep='')
for (i in 1:k){
if (mysum$coefficients[i,1] > 0) myeq <- paste(myeq, '+', '')
myeq <- paste(myeq, mysum$coefficients[i,1], sep=' ')
if (rownames(mysum$coefficients)[i] != '(Intercept)') {
myeq <- paste(myeq, rownames(mysum$coefficients)[i], sep='')
if (rownames(mysum$coefficients)[i] != 't') myeq <- paste(myeq, '[t]', sep='')
}
}
myeq <- paste(myeq, ' + e[t]')
a<-table.row.start(a)
a<-table.element(a, myeq)
a<-table.row.end(a)
a<-table.end(a)
table.save(a,file='mytable1.tab')
a<-table.start()
a<-table.row.start(a)
a<-table.element(a,hyperlink('ols1.htm','Multiple Linear Regression - Ordinary Least Squares',''), 6, TRUE)
a<-table.row.end(a)
a<-table.row.start(a)
a<-table.element(a,'Variable',header=TRUE)
a<-table.element(a,'Parameter',header=TRUE)
a<-table.element(a,'S.D.',header=TRUE)
a<-table.element(a,'T-STAT
H0: parameter = 0',header=TRUE)
a<-table.element(a,'2-tail p-value',header=TRUE)
a<-table.element(a,'1-tail p-value',header=TRUE)
a<-table.row.end(a)
for (i in 1:k){
a<-table.row.start(a)
a<-table.element(a,rownames(mysum$coefficients)[i],header=TRUE)
a<-table.element(a,mysum$coefficients[i,1])
a<-table.element(a, round(mysum$coefficients[i,2],6))
a<-table.element(a, round(mysum$coefficients[i,3],4))
a<-table.element(a, round(mysum$coefficients[i,4],6))
a<-table.element(a, round(mysum$coefficients[i,4]/2,6))
a<-table.row.end(a)
}
a<-table.end(a)
table.save(a,file='mytable2.tab')
a<-table.start()
a<-table.row.start(a)
a<-table.element(a, 'Multiple Linear Regression - Regression Statistics', 2, TRUE)
a<-table.row.end(a)
a<-table.row.start(a)
a<-table.element(a, 'Multiple R',1,TRUE)
a<-table.element(a, sqrt(mysum$r.squared))
a<-table.row.end(a)
a<-table.row.start(a)
a<-table.element(a, 'R-squared',1,TRUE)
a<-table.element(a, mysum$r.squared)
a<-table.row.end(a)
a<-table.row.start(a)
a<-table.element(a, 'Adjusted R-squared',1,TRUE)
a<-table.element(a, mysum$adj.r.squared)
a<-table.row.end(a)
a<-table.row.start(a)
a<-table.element(a, 'F-TEST (value)',1,TRUE)
a<-table.element(a, mysum$fstatistic[1])
a<-table.row.end(a)
a<-table.row.start(a)
a<-table.element(a, 'F-TEST (DF numerator)',1,TRUE)
a<-table.element(a, mysum$fstatistic[2])
a<-table.row.end(a)
a<-table.row.start(a)
a<-table.element(a, 'F-TEST (DF denominator)',1,TRUE)
a<-table.element(a, mysum$fstatistic[3])
a<-table.row.end(a)
a<-table.row.start(a)
a<-table.element(a, 'p-value',1,TRUE)
a<-table.element(a, 1-pf(mysum$fstatistic[1],mysum$fstatistic[2],mysum$fstatistic[3]))
a<-table.row.end(a)
a<-table.row.start(a)
a<-table.element(a, 'Multiple Linear Regression - Residual Statistics', 2, TRUE)
a<-table.row.end(a)
a<-table.row.start(a)
a<-table.element(a, 'Residual Standard Deviation',1,TRUE)
a<-table.element(a, mysum$sigma)
a<-table.row.end(a)
a<-table.row.start(a)
a<-table.element(a, 'Sum Squared Residuals',1,TRUE)
a<-table.element(a, sum(myerror*myerror))
a<-table.row.end(a)
a<-table.end(a)
table.save(a,file='mytable3.tab')
a<-table.start()
a<-table.row.start(a)
a<-table.element(a, 'Multiple Linear Regression - Actuals, Interpolation, and Residuals', 4, TRUE)
a<-table.row.end(a)
a<-table.row.start(a)
a<-table.element(a, 'Time or Index', 1, TRUE)
a<-table.element(a, 'Actuals', 1, TRUE)
a<-table.element(a, 'Interpolation
Forecast', 1, TRUE)
a<-table.element(a, 'Residuals
Prediction Error', 1, TRUE)
a<-table.row.end(a)
for (i in 1:n) {
a<-table.row.start(a)
a<-table.element(a,i, 1, TRUE)
a<-table.element(a,x[i])
a<-table.element(a,x[i]-mysum$resid[i])
a<-table.element(a,mysum$resid[i])
a<-table.row.end(a)
}
a<-table.end(a)
table.save(a,file='mytable4.tab')
if (n > n25) {
a<-table.start()
a<-table.row.start(a)
a<-table.element(a,'Goldfeld-Quandt test for Heteroskedasticity',4,TRUE)
a<-table.row.end(a)
a<-table.row.start(a)
a<-table.element(a,'p-values',header=TRUE)
a<-table.element(a,'Alternative Hypothesis',3,header=TRUE)
a<-table.row.end(a)
a<-table.row.start(a)
a<-table.element(a,'breakpoint index',header=TRUE)
a<-table.element(a,'greater',header=TRUE)
a<-table.element(a,'2-sided',header=TRUE)
a<-table.element(a,'less',header=TRUE)
a<-table.row.end(a)
for (mypoint in kp3:nmkm3) {
a<-table.row.start(a)
a<-table.element(a,mypoint,header=TRUE)
a<-table.element(a,gqarr[mypoint-kp3+1,1])
a<-table.element(a,gqarr[mypoint-kp3+1,2])
a<-table.element(a,gqarr[mypoint-kp3+1,3])
a<-table.row.end(a)
}
a<-table.end(a)
table.save(a,file='mytable5.tab')
a<-table.start()
a<-table.row.start(a)
a<-table.element(a,'Meta Analysis of Goldfeld-Quandt test for Heteroskedasticity',4,TRUE)
a<-table.row.end(a)
a<-table.row.start(a)
a<-table.element(a,'Description',header=TRUE)
a<-table.element(a,'# significant tests',header=TRUE)
a<-table.element(a,'% significant tests',header=TRUE)
a<-table.element(a,'OK/NOK',header=TRUE)
a<-table.row.end(a)
a<-table.row.start(a)
a<-table.element(a,'1% type I error level',header=TRUE)
a<-table.element(a,numsignificant1)
a<-table.element(a,numsignificant1/numgqtests)
if (numsignificant1/numgqtests < 0.01) dum <- 'OK' else dum <- 'NOK'
a<-table.element(a,dum)
a<-table.row.end(a)
a<-table.row.start(a)
a<-table.element(a,'5% type I error level',header=TRUE)
a<-table.element(a,numsignificant5)
a<-table.element(a,numsignificant5/numgqtests)
if (numsignificant5/numgqtests < 0.05) dum <- 'OK' else dum <- 'NOK'
a<-table.element(a,dum)
a<-table.row.end(a)
a<-table.row.start(a)
a<-table.element(a,'10% type I error level',header=TRUE)
a<-table.element(a,numsignificant10)
a<-table.element(a,numsignificant10/numgqtests)
if (numsignificant10/numgqtests < 0.1) dum <- 'OK' else dum <- 'NOK'
a<-table.element(a,dum)
a<-table.row.end(a)
a<-table.end(a)
table.save(a,file='mytable6.tab')
}