Free Statistics

of Irreproducible Research!

Author's title

Author*The author of this computation has been verified*
R Software Modulerwasp_multipleregression.wasp
Title produced by softwareMultiple Regression
Date of computationSat, 22 Nov 2008 07:38:00 -0700
Cite this page as followsStatistical Computations at FreeStatistics.org, Office for Research Development and Education, URL https://freestatistics.org/blog/index.php?v=date/2008/Nov/22/t1227365307ot8ap441cr0r4cj.htm/, Retrieved Fri, 17 May 2024 21:25:54 +0000
Statistical Computations at FreeStatistics.org, Office for Research Development and Education, URL https://freestatistics.org/blog/index.php?pk=25189, Retrieved Fri, 17 May 2024 21:25:54 +0000
QR Codes:

Original text written by user:
IsPrivate?No (this computation is public)
User-defined keywords
Estimated Impact227
Family? (F = Feedback message, R = changed R code, M = changed R Module, P = changed Parameters, D = changed Data)
F     [Multiple Regression] [] [2007-11-19 20:22:41] [3a1956effdcb54c39e5044435310d6c8]
F    D    [Multiple Regression] [Seatbelt Q3] [2008-11-22 14:38:00] [2ae704d6b0222e84f58032588d68322b] [Current]
Feedback Forum
2008-11-27 15:35:49 [Matthieu Blondeau] [reply
De student heeft deze vraag correct geanalyseerd.
Hij heeft de verschillende methoden van Q1 en Q2 goed toegepast op deze vraag, alles loopt hier eigenlijk gelijk aan de 2 eerste vragen alleen zijn er hier andere getallen.

Als we de verschillende kaders willen interpreteren kan men daar het volgende over zeggen:

- 1ste kader: het eerste getal komt van de referentiemaand(dit is hier december). Hiervan wordt het gemiddeld aantal veranderingen van afgetrokken indien de dummie gelijk is aan 1. Indien de dummie gelijk is aan 0 wordt er geen rekening gehouden met dit getal. De getallen die hierop volgen zijn het aantal veranderingen per maand genomen. Daarna kan er rekening gehouden worden met een lange termijn trend, dit getal wordt gemarkeerd met de 't'.

- 2de kader: hier vindt men de dummies terug met de parameter die bij deze dummie hoort. De standaardfout is het gemiddeld aantal schattingen dat we verkeerd zijn. De T-STAT is een formule met de parameter, de nulhypothese en de standaardfout. Dit helpt er onder andere bij om na te gaan of de parameters significant kleiner zijn dan 0. In dit geval is het zo dat de parameters significant kleiner zijn dan 0 aangezien de p-waarden kleiner zijn dan 5% en de T-STAT is groter dan de absolute waarde van 2.

- 3de kader: Hier kijken we vooral naar de R squared en de adjusted R squared. Dit is altijd een getal tussen de 0 en de 1 en stelt een percentage voor. Dit percentage kan het aantal veranderingen verklaren. De F-test is de voorspelling van het significant verschil.


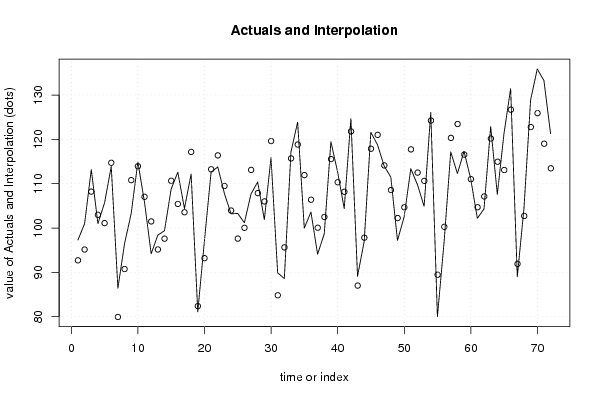
Er is weliswaar een duidelijke dalende trend en een niveauverschil terug te vinden in de eerste grafiek.

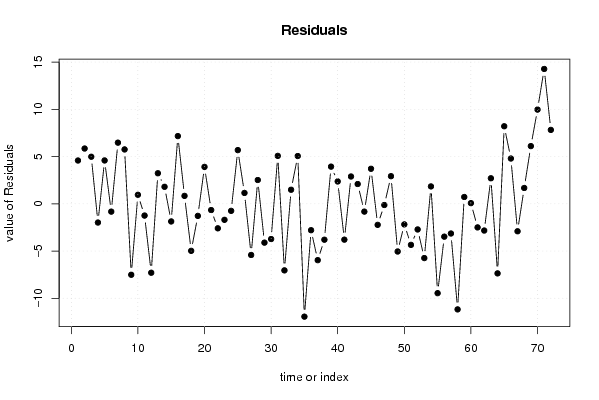
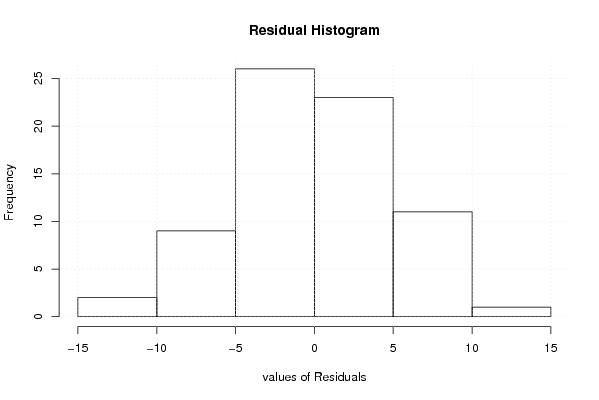
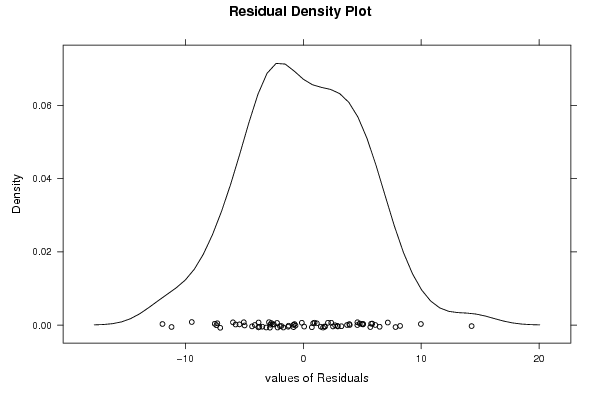
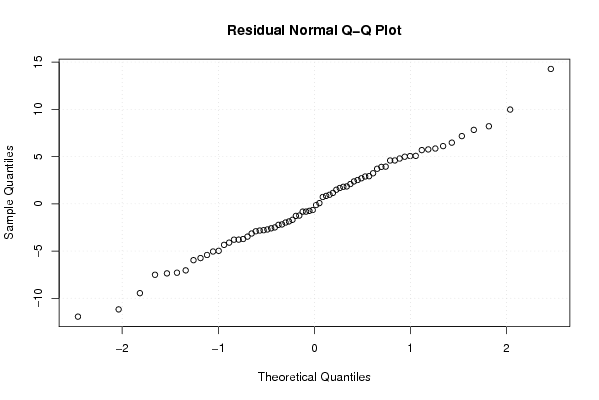
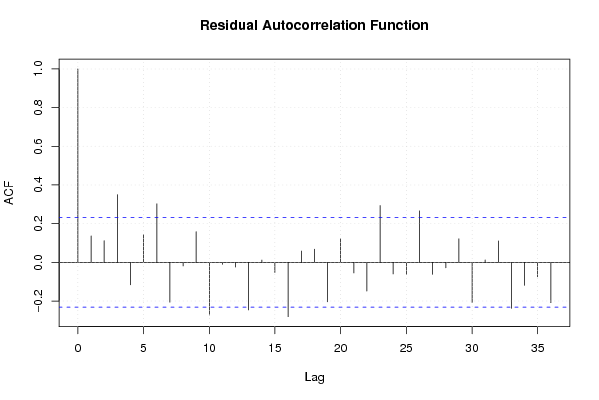
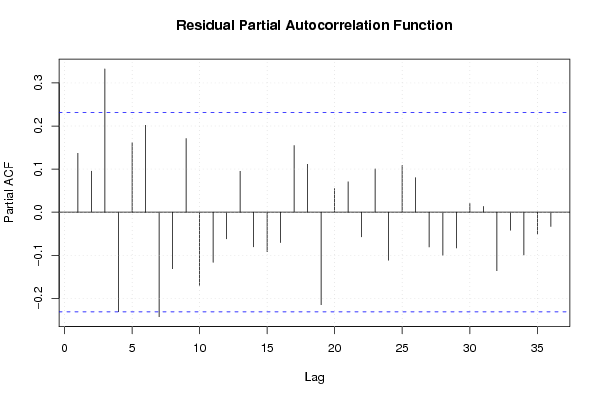
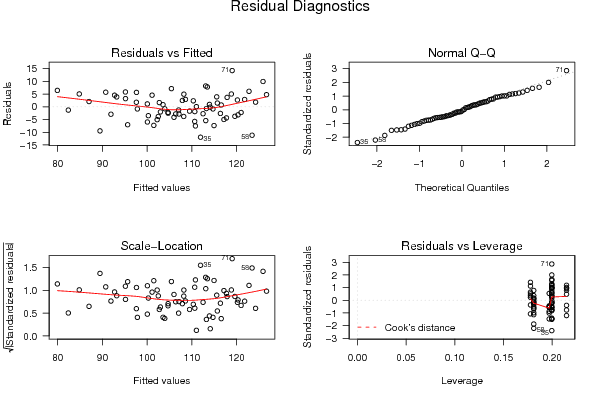
Dit model is evenwel niet geslaagd. Dit kan men in de grafieken zien doordat er nog steeds autocorrelatie aanwezig is. Eerst was er een duidelijk patroon terug te vinden. Dit is al veel afgezwakt maar er is nog steeds autocorrelatie. Men kan dit ook aflezen in de histogram en de density plot. Deze 2 grafieken vertonen geen normaalverdeling. Ook kan men zien aan de residuals dat deze niet
gelijk lopen met de 0-lijn, het gemiddelde is bijgevolg niet gelijk aan 0.

Men kan dit ook met andere methoden nagaan zoals de Central Tendency(valt de 0-lijn tussen het betrouwbaarheidsinterval) of via de testing mean with unknown variance.
2008-11-28 16:03:07 [Mehmet Yilmaz] [reply
De berekening en conclusie is correct.

Post a new message
Dataseries X:
97.3	0
101	0
113.2	0
101	0
105.7	0
113.9	0
86.4	0
96.5	0
103.3	0
114.9	0
105.8	0
94.2	0
98.4	0
99.4	0
108.8	0
112.6	0
104.4	0
112.2	0
81.1	0
97.1	0
112.6	0
113.8	0
107.8	0
103.2	0
103.3	0
101.2	0
107.7	0
110.4	0
101.9	0
115.9	0
89.9	0
88.6	0
117.2	0
123.9	0
100	0
103.6	0
94.1	0
98.7	0
119.5	0
112.7	0
104.4	1
124.7	1
89.1	1
97	1
121.6	1
118.8	1
114	1
111.5	1
97.2	1
102.5	1
113.4	1
109.8	1
104.9	1
126.1	1
80	1
96.8	1
117.2	1
112.3	1
117.3	1
111.1	1
102.2	1
104.3	1
122.9	1
107.6	1
121.3	1
131.5	1
89	1
104.4	1
128.9	1
135.9	1
133.3	1
121.3	1


Summary of computational transaction
Raw Inputview raw input (R code)
Raw Outputview raw output of R engine
Computing time6 seconds
R Server'Herman Ole Andreas Wold' @ 193.190.124.10:1001

\begin{tabular}{lllllllll}
\hline
Summary of computational transaction \tabularnewline
Raw Input & view raw input (R code)  \tabularnewline
Raw Output & view raw output of R engine  \tabularnewline
Computing time & 6 seconds \tabularnewline
R Server & 'Herman Ole Andreas Wold' @ 193.190.124.10:1001 \tabularnewline
\hline
\end{tabular}
%Source: https://freestatistics.org/blog/index.php?pk=25189&T=0

[TABLE]
[ROW][C]Summary of computational transaction[/C][/ROW]
[ROW][C]Raw Input[/C][C]view raw input (R code) [/C][/ROW]
[ROW][C]Raw Output[/C][C]view raw output of R engine [/C][/ROW]
[ROW][C]Computing time[/C][C]6 seconds[/C][/ROW]
[ROW][C]R Server[/C][C]'Herman Ole Andreas Wold' @ 193.190.124.10:1001[/C][/ROW]
[/TABLE]
Source: https://freestatistics.org/blog/index.php?pk=25189&T=0

Globally Unique Identifier (entire table): ba.freestatistics.org/blog/index.php?pk=25189&T=0

As an alternative you can also use a QR Code:  

The GUIDs for individual cells are displayed in the table below:

Summary of computational transaction
Raw Inputview raw input (R code)
Raw Outputview raw output of R engine
Computing time6 seconds
R Server'Herman Ole Andreas Wold' @ 193.190.124.10:1001


Multiple Linear Regression - Estimated Regression Equation
y[t] = + 99.042467948718 -0.268269230769214x[t] -6.53221153846149M1[t] -4.30304487179487M2[t] + 8.55945512820513M3[t] + 3.12195512820513M4[t] + 1.04583333333333M5[t] + 14.4583333333333M6[t] -20.5458333333333M7[t] -9.93333333333334M8[t] + 9.92916666666667M9[t] + 12.8583333333333M10[t] + 5.75416666666667M11[t] + 0.204166666666666t + e[t]

\begin{tabular}{lllllllll}
\hline
Multiple Linear Regression - Estimated Regression Equation \tabularnewline
y[t] =  +  99.042467948718 -0.268269230769214x[t] -6.53221153846149M1[t] -4.30304487179487M2[t] +  8.55945512820513M3[t] +  3.12195512820513M4[t] +  1.04583333333333M5[t] +  14.4583333333333M6[t] -20.5458333333333M7[t] -9.93333333333334M8[t] +  9.92916666666667M9[t] +  12.8583333333333M10[t] +  5.75416666666667M11[t] +  0.204166666666666t  + e[t] \tabularnewline
\hline
\end{tabular}
%Source: https://freestatistics.org/blog/index.php?pk=25189&T=1

[TABLE]
[ROW][C]Multiple Linear Regression - Estimated Regression Equation[/C][/ROW]
[ROW][C]y[t] =  +  99.042467948718 -0.268269230769214x[t] -6.53221153846149M1[t] -4.30304487179487M2[t] +  8.55945512820513M3[t] +  3.12195512820513M4[t] +  1.04583333333333M5[t] +  14.4583333333333M6[t] -20.5458333333333M7[t] -9.93333333333334M8[t] +  9.92916666666667M9[t] +  12.8583333333333M10[t] +  5.75416666666667M11[t] +  0.204166666666666t  + e[t][/C][/ROW]
[/TABLE]
Source: https://freestatistics.org/blog/index.php?pk=25189&T=1

Globally Unique Identifier (entire table): ba.freestatistics.org/blog/index.php?pk=25189&T=1

As an alternative you can also use a QR Code:  

The GUIDs for individual cells are displayed in the table below:

Multiple Linear Regression - Estimated Regression Equation
y[t] = + 99.042467948718 -0.268269230769214x[t] -6.53221153846149M1[t] -4.30304487179487M2[t] + 8.55945512820513M3[t] + 3.12195512820513M4[t] + 1.04583333333333M5[t] + 14.4583333333333M6[t] -20.5458333333333M7[t] -9.93333333333334M8[t] + 9.92916666666667M9[t] + 12.8583333333333M10[t] + 5.75416666666667M11[t] + 0.204166666666666t + e[t]


Multiple Linear Regression - Ordinary Least Squares
VariableParameterS.D.T-STATH0: parameter = 02-tail p-value1-tail p-value
(Intercept)99.0424679487182.81646835.165500
x-0.2682692307692142.640991-0.10160.9194410.459721
M1-6.532211538461493.24228-2.01470.0485810.02429
M2-4.303044871794873.236726-1.32940.1889070.094454
M38.559455128205133.23242.6480.0104110.005205
M43.121955128205133.2293070.96680.3376790.16884
M51.045833333333333.2493860.32190.7487190.37436
M614.45833333333333.2413794.46063.8e-051.9e-05
M7-20.54583333333333.234588-6.351900
M8-9.933333333333343.229021-3.07630.0031960.001598
M99.929166666666673.2246853.07910.003170.001585
M1012.85833333333333.2215843.99130.0001879.4e-05
M115.754166666666673.2197221.78720.0791370.039568
t0.2041666666666660.0632293.2290.0020470.001023

\begin{tabular}{lllllllll}
\hline
Multiple Linear Regression - Ordinary Least Squares \tabularnewline
Variable & Parameter & S.D. & T-STATH0: parameter = 0 & 2-tail p-value & 1-tail p-value \tabularnewline
(Intercept) & 99.042467948718 & 2.816468 & 35.1655 & 0 & 0 \tabularnewline
x & -0.268269230769214 & 2.640991 & -0.1016 & 0.919441 & 0.459721 \tabularnewline
M1 & -6.53221153846149 & 3.24228 & -2.0147 & 0.048581 & 0.02429 \tabularnewline
M2 & -4.30304487179487 & 3.236726 & -1.3294 & 0.188907 & 0.094454 \tabularnewline
M3 & 8.55945512820513 & 3.2324 & 2.648 & 0.010411 & 0.005205 \tabularnewline
M4 & 3.12195512820513 & 3.229307 & 0.9668 & 0.337679 & 0.16884 \tabularnewline
M5 & 1.04583333333333 & 3.249386 & 0.3219 & 0.748719 & 0.37436 \tabularnewline
M6 & 14.4583333333333 & 3.241379 & 4.4606 & 3.8e-05 & 1.9e-05 \tabularnewline
M7 & -20.5458333333333 & 3.234588 & -6.3519 & 0 & 0 \tabularnewline
M8 & -9.93333333333334 & 3.229021 & -3.0763 & 0.003196 & 0.001598 \tabularnewline
M9 & 9.92916666666667 & 3.224685 & 3.0791 & 0.00317 & 0.001585 \tabularnewline
M10 & 12.8583333333333 & 3.221584 & 3.9913 & 0.000187 & 9.4e-05 \tabularnewline
M11 & 5.75416666666667 & 3.219722 & 1.7872 & 0.079137 & 0.039568 \tabularnewline
t & 0.204166666666666 & 0.063229 & 3.229 & 0.002047 & 0.001023 \tabularnewline
\hline
\end{tabular}
%Source: https://freestatistics.org/blog/index.php?pk=25189&T=2

[TABLE]
[ROW][C]Multiple Linear Regression - Ordinary Least Squares[/C][/ROW]
[ROW][C]Variable[/C][C]Parameter[/C][C]S.D.[/C][C]T-STATH0: parameter = 0[/C][C]2-tail p-value[/C][C]1-tail p-value[/C][/ROW]
[ROW][C](Intercept)[/C][C]99.042467948718[/C][C]2.816468[/C][C]35.1655[/C][C]0[/C][C]0[/C][/ROW]
[ROW][C]x[/C][C]-0.268269230769214[/C][C]2.640991[/C][C]-0.1016[/C][C]0.919441[/C][C]0.459721[/C][/ROW]
[ROW][C]M1[/C][C]-6.53221153846149[/C][C]3.24228[/C][C]-2.0147[/C][C]0.048581[/C][C]0.02429[/C][/ROW]
[ROW][C]M2[/C][C]-4.30304487179487[/C][C]3.236726[/C][C]-1.3294[/C][C]0.188907[/C][C]0.094454[/C][/ROW]
[ROW][C]M3[/C][C]8.55945512820513[/C][C]3.2324[/C][C]2.648[/C][C]0.010411[/C][C]0.005205[/C][/ROW]
[ROW][C]M4[/C][C]3.12195512820513[/C][C]3.229307[/C][C]0.9668[/C][C]0.337679[/C][C]0.16884[/C][/ROW]
[ROW][C]M5[/C][C]1.04583333333333[/C][C]3.249386[/C][C]0.3219[/C][C]0.748719[/C][C]0.37436[/C][/ROW]
[ROW][C]M6[/C][C]14.4583333333333[/C][C]3.241379[/C][C]4.4606[/C][C]3.8e-05[/C][C]1.9e-05[/C][/ROW]
[ROW][C]M7[/C][C]-20.5458333333333[/C][C]3.234588[/C][C]-6.3519[/C][C]0[/C][C]0[/C][/ROW]
[ROW][C]M8[/C][C]-9.93333333333334[/C][C]3.229021[/C][C]-3.0763[/C][C]0.003196[/C][C]0.001598[/C][/ROW]
[ROW][C]M9[/C][C]9.92916666666667[/C][C]3.224685[/C][C]3.0791[/C][C]0.00317[/C][C]0.001585[/C][/ROW]
[ROW][C]M10[/C][C]12.8583333333333[/C][C]3.221584[/C][C]3.9913[/C][C]0.000187[/C][C]9.4e-05[/C][/ROW]
[ROW][C]M11[/C][C]5.75416666666667[/C][C]3.219722[/C][C]1.7872[/C][C]0.079137[/C][C]0.039568[/C][/ROW]
[ROW][C]t[/C][C]0.204166666666666[/C][C]0.063229[/C][C]3.229[/C][C]0.002047[/C][C]0.001023[/C][/ROW]
[/TABLE]
Source: https://freestatistics.org/blog/index.php?pk=25189&T=2

Globally Unique Identifier (entire table): ba.freestatistics.org/blog/index.php?pk=25189&T=2

As an alternative you can also use a QR Code:  

The GUIDs for individual cells are displayed in the table below:

Multiple Linear Regression - Ordinary Least Squares
VariableParameterS.D.T-STATH0: parameter = 02-tail p-value1-tail p-value
(Intercept)99.0424679487182.81646835.165500
x-0.2682692307692142.640991-0.10160.9194410.459721
M1-6.532211538461493.24228-2.01470.0485810.02429
M2-4.303044871794873.236726-1.32940.1889070.094454
M38.559455128205133.23242.6480.0104110.005205
M43.121955128205133.2293070.96680.3376790.16884
M51.045833333333333.2493860.32190.7487190.37436
M614.45833333333333.2413794.46063.8e-051.9e-05
M7-20.54583333333333.234588-6.351900
M8-9.933333333333343.229021-3.07630.0031960.001598
M99.929166666666673.2246853.07910.003170.001585
M1012.85833333333333.2215843.99130.0001879.4e-05
M115.754166666666673.2197221.78720.0791370.039568
t0.2041666666666660.0632293.2290.0020470.001023


Multiple Linear Regression - Regression Statistics
Multiple R0.906855705245502
R-squared0.822387270136318
Adjusted R-squared0.782577520339285
F-TEST (value)20.6579361671252
F-TEST (DF numerator)13
F-TEST (DF denominator)58
p-value0
Multiple Linear Regression - Residual Statistics
Residual Standard Deviation5.5756462664594
Sum Squared Residuals1803.09421474359

\begin{tabular}{lllllllll}
\hline
Multiple Linear Regression - Regression Statistics \tabularnewline
Multiple R & 0.906855705245502 \tabularnewline
R-squared & 0.822387270136318 \tabularnewline
Adjusted R-squared & 0.782577520339285 \tabularnewline
F-TEST (value) & 20.6579361671252 \tabularnewline
F-TEST (DF numerator) & 13 \tabularnewline
F-TEST (DF denominator) & 58 \tabularnewline
p-value & 0 \tabularnewline
Multiple Linear Regression - Residual Statistics \tabularnewline
Residual Standard Deviation & 5.5756462664594 \tabularnewline
Sum Squared Residuals & 1803.09421474359 \tabularnewline
\hline
\end{tabular}
%Source: https://freestatistics.org/blog/index.php?pk=25189&T=3

[TABLE]
[ROW][C]Multiple Linear Regression - Regression Statistics[/C][/ROW]
[ROW][C]Multiple R[/C][C]0.906855705245502[/C][/ROW]
[ROW][C]R-squared[/C][C]0.822387270136318[/C][/ROW]
[ROW][C]Adjusted R-squared[/C][C]0.782577520339285[/C][/ROW]
[ROW][C]F-TEST (value)[/C][C]20.6579361671252[/C][/ROW]
[ROW][C]F-TEST (DF numerator)[/C][C]13[/C][/ROW]
[ROW][C]F-TEST (DF denominator)[/C][C]58[/C][/ROW]
[ROW][C]p-value[/C][C]0[/C][/ROW]
[ROW][C]Multiple Linear Regression - Residual Statistics[/C][/ROW]
[ROW][C]Residual Standard Deviation[/C][C]5.5756462664594[/C][/ROW]
[ROW][C]Sum Squared Residuals[/C][C]1803.09421474359[/C][/ROW]
[/TABLE]
Source: https://freestatistics.org/blog/index.php?pk=25189&T=3

Globally Unique Identifier (entire table): ba.freestatistics.org/blog/index.php?pk=25189&T=3

As an alternative you can also use a QR Code:  

The GUIDs for individual cells are displayed in the table below:

Multiple Linear Regression - Regression Statistics
Multiple R0.906855705245502
R-squared0.822387270136318
Adjusted R-squared0.782577520339285
F-TEST (value)20.6579361671252
F-TEST (DF numerator)13
F-TEST (DF denominator)58
p-value0
Multiple Linear Regression - Residual Statistics
Residual Standard Deviation5.5756462664594
Sum Squared Residuals1803.09421474359


Multiple Linear Regression - Actuals, Interpolation, and Residuals
Time or IndexActualsInterpolationForecastResidualsPrediction Error
197.392.71442307692294.58557692307713
210195.14775641025645.85224358974357
3113.2108.2144230769234.98557692307691
4101102.981089743590-1.98108974358975
5105.7101.1091346153854.59086538461537
6113.9114.725801282051-0.825801282051288
786.479.92580128205136.47419871794872
896.590.7424679487185.75753205128204
9103.3110.809134615385-7.50913461538463
10114.9113.9424679487180.957532051282047
11105.8107.042467948718-1.24246794871797
1294.2101.492467948718-7.29246794871796
1398.495.16442307692313.23557692307688
1499.497.59775641025641.80224358974359
15108.8110.664423076923-1.86442307692309
16112.6105.4310897435907.16891025641024
17104.4103.5591346153850.840865384615384
18112.2117.175801282051-4.97580128205128
1981.182.3758012820513-1.27580128205129
2097.193.1924679487183.90753205128205
21112.6113.259134615385-0.659134615384621
22113.8116.392467948718-2.59246794871795
23107.8109.492467948718-1.69246794871795
24103.2103.942467948718-0.742467948717947
25103.397.61442307692315.68557692307688
26101.2100.0477564102561.15224358974359
27107.7113.114423076923-5.41442307692307
28110.4107.8810897435902.51891025641027
29101.9106.009134615385-4.10913461538461
30115.9119.625801282051-3.72580128205127
3189.984.82580128205135.07419871794872
3288.695.642467948718-7.04246794871795
33117.2115.7091346153851.49086538461539
34123.9118.8424679487185.05753205128207
35100111.942467948718-11.9424679487179
36103.6106.392467948718-2.79246794871795
3794.1100.064423076923-5.96442307692312
3898.7102.497756410256-3.7977564102564
39119.5115.5644230769233.93557692307693
40112.7110.3310897435902.36891025641027
41104.4108.190865384615-3.79086538461539
42124.7121.8075320512822.89246794871795
4389.187.0075320512822.09246794871794
449797.8241987179487-0.82419871794872
45121.6117.8908653846153.70913461538461
46118.8121.024198717949-2.22419871794873
47114114.124198717949-0.124198717948722
48111.5108.5741987179492.92580128205128
4997.2102.246153846154-5.04615384615389
50102.5104.679487179487-2.17948717948718
51113.4117.746153846154-4.34615384615384
52109.8112.512820512821-2.71282051282051
53104.9110.640865384615-5.74086538461538
54126.1124.2575320512821.84246794871794
558089.457532051282-9.45753205128205
5696.8100.274198717949-3.47419871794871
57117.2120.340865384615-3.14086538461538
58112.3123.474198717949-11.1741987179487
59117.3116.5741987179490.725801282051282
60111.1111.0241987179490.0758012820512806
61102.2104.696153846154-2.49615384615388
62104.3107.129487179487-2.82948717948718
63122.9120.1961538461542.70384615384617
64107.6114.962820512820-7.36282051282051
65121.3113.0908653846158.20913461538462
66131.5126.7075320512824.79246794871795
678991.907532051282-2.90753205128204
68104.4102.7241987179491.67580128205130
69128.9122.7908653846156.10913461538463
70135.9125.9241987179499.9758012820513
71133.3119.02419871794914.2758012820513
72121.3113.4741987179497.82580128205129

\begin{tabular}{lllllllll}
\hline
Multiple Linear Regression - Actuals, Interpolation, and Residuals \tabularnewline
Time or Index & Actuals & InterpolationForecast & ResidualsPrediction Error \tabularnewline
1 & 97.3 & 92.7144230769229 & 4.58557692307713 \tabularnewline
2 & 101 & 95.1477564102564 & 5.85224358974357 \tabularnewline
3 & 113.2 & 108.214423076923 & 4.98557692307691 \tabularnewline
4 & 101 & 102.981089743590 & -1.98108974358975 \tabularnewline
5 & 105.7 & 101.109134615385 & 4.59086538461537 \tabularnewline
6 & 113.9 & 114.725801282051 & -0.825801282051288 \tabularnewline
7 & 86.4 & 79.9258012820513 & 6.47419871794872 \tabularnewline
8 & 96.5 & 90.742467948718 & 5.75753205128204 \tabularnewline
9 & 103.3 & 110.809134615385 & -7.50913461538463 \tabularnewline
10 & 114.9 & 113.942467948718 & 0.957532051282047 \tabularnewline
11 & 105.8 & 107.042467948718 & -1.24246794871797 \tabularnewline
12 & 94.2 & 101.492467948718 & -7.29246794871796 \tabularnewline
13 & 98.4 & 95.1644230769231 & 3.23557692307688 \tabularnewline
14 & 99.4 & 97.5977564102564 & 1.80224358974359 \tabularnewline
15 & 108.8 & 110.664423076923 & -1.86442307692309 \tabularnewline
16 & 112.6 & 105.431089743590 & 7.16891025641024 \tabularnewline
17 & 104.4 & 103.559134615385 & 0.840865384615384 \tabularnewline
18 & 112.2 & 117.175801282051 & -4.97580128205128 \tabularnewline
19 & 81.1 & 82.3758012820513 & -1.27580128205129 \tabularnewline
20 & 97.1 & 93.192467948718 & 3.90753205128205 \tabularnewline
21 & 112.6 & 113.259134615385 & -0.659134615384621 \tabularnewline
22 & 113.8 & 116.392467948718 & -2.59246794871795 \tabularnewline
23 & 107.8 & 109.492467948718 & -1.69246794871795 \tabularnewline
24 & 103.2 & 103.942467948718 & -0.742467948717947 \tabularnewline
25 & 103.3 & 97.6144230769231 & 5.68557692307688 \tabularnewline
26 & 101.2 & 100.047756410256 & 1.15224358974359 \tabularnewline
27 & 107.7 & 113.114423076923 & -5.41442307692307 \tabularnewline
28 & 110.4 & 107.881089743590 & 2.51891025641027 \tabularnewline
29 & 101.9 & 106.009134615385 & -4.10913461538461 \tabularnewline
30 & 115.9 & 119.625801282051 & -3.72580128205127 \tabularnewline
31 & 89.9 & 84.8258012820513 & 5.07419871794872 \tabularnewline
32 & 88.6 & 95.642467948718 & -7.04246794871795 \tabularnewline
33 & 117.2 & 115.709134615385 & 1.49086538461539 \tabularnewline
34 & 123.9 & 118.842467948718 & 5.05753205128207 \tabularnewline
35 & 100 & 111.942467948718 & -11.9424679487179 \tabularnewline
36 & 103.6 & 106.392467948718 & -2.79246794871795 \tabularnewline
37 & 94.1 & 100.064423076923 & -5.96442307692312 \tabularnewline
38 & 98.7 & 102.497756410256 & -3.7977564102564 \tabularnewline
39 & 119.5 & 115.564423076923 & 3.93557692307693 \tabularnewline
40 & 112.7 & 110.331089743590 & 2.36891025641027 \tabularnewline
41 & 104.4 & 108.190865384615 & -3.79086538461539 \tabularnewline
42 & 124.7 & 121.807532051282 & 2.89246794871795 \tabularnewline
43 & 89.1 & 87.007532051282 & 2.09246794871794 \tabularnewline
44 & 97 & 97.8241987179487 & -0.82419871794872 \tabularnewline
45 & 121.6 & 117.890865384615 & 3.70913461538461 \tabularnewline
46 & 118.8 & 121.024198717949 & -2.22419871794873 \tabularnewline
47 & 114 & 114.124198717949 & -0.124198717948722 \tabularnewline
48 & 111.5 & 108.574198717949 & 2.92580128205128 \tabularnewline
49 & 97.2 & 102.246153846154 & -5.04615384615389 \tabularnewline
50 & 102.5 & 104.679487179487 & -2.17948717948718 \tabularnewline
51 & 113.4 & 117.746153846154 & -4.34615384615384 \tabularnewline
52 & 109.8 & 112.512820512821 & -2.71282051282051 \tabularnewline
53 & 104.9 & 110.640865384615 & -5.74086538461538 \tabularnewline
54 & 126.1 & 124.257532051282 & 1.84246794871794 \tabularnewline
55 & 80 & 89.457532051282 & -9.45753205128205 \tabularnewline
56 & 96.8 & 100.274198717949 & -3.47419871794871 \tabularnewline
57 & 117.2 & 120.340865384615 & -3.14086538461538 \tabularnewline
58 & 112.3 & 123.474198717949 & -11.1741987179487 \tabularnewline
59 & 117.3 & 116.574198717949 & 0.725801282051282 \tabularnewline
60 & 111.1 & 111.024198717949 & 0.0758012820512806 \tabularnewline
61 & 102.2 & 104.696153846154 & -2.49615384615388 \tabularnewline
62 & 104.3 & 107.129487179487 & -2.82948717948718 \tabularnewline
63 & 122.9 & 120.196153846154 & 2.70384615384617 \tabularnewline
64 & 107.6 & 114.962820512820 & -7.36282051282051 \tabularnewline
65 & 121.3 & 113.090865384615 & 8.20913461538462 \tabularnewline
66 & 131.5 & 126.707532051282 & 4.79246794871795 \tabularnewline
67 & 89 & 91.907532051282 & -2.90753205128204 \tabularnewline
68 & 104.4 & 102.724198717949 & 1.67580128205130 \tabularnewline
69 & 128.9 & 122.790865384615 & 6.10913461538463 \tabularnewline
70 & 135.9 & 125.924198717949 & 9.9758012820513 \tabularnewline
71 & 133.3 & 119.024198717949 & 14.2758012820513 \tabularnewline
72 & 121.3 & 113.474198717949 & 7.82580128205129 \tabularnewline
\hline
\end{tabular}
%Source: https://freestatistics.org/blog/index.php?pk=25189&T=4

[TABLE]
[ROW][C]Multiple Linear Regression - Actuals, Interpolation, and Residuals[/C][/ROW]
[ROW][C]Time or Index[/C][C]Actuals[/C][C]InterpolationForecast[/C][C]ResidualsPrediction Error[/C][/ROW]
[ROW][C]1[/C][C]97.3[/C][C]92.7144230769229[/C][C]4.58557692307713[/C][/ROW]
[ROW][C]2[/C][C]101[/C][C]95.1477564102564[/C][C]5.85224358974357[/C][/ROW]
[ROW][C]3[/C][C]113.2[/C][C]108.214423076923[/C][C]4.98557692307691[/C][/ROW]
[ROW][C]4[/C][C]101[/C][C]102.981089743590[/C][C]-1.98108974358975[/C][/ROW]
[ROW][C]5[/C][C]105.7[/C][C]101.109134615385[/C][C]4.59086538461537[/C][/ROW]
[ROW][C]6[/C][C]113.9[/C][C]114.725801282051[/C][C]-0.825801282051288[/C][/ROW]
[ROW][C]7[/C][C]86.4[/C][C]79.9258012820513[/C][C]6.47419871794872[/C][/ROW]
[ROW][C]8[/C][C]96.5[/C][C]90.742467948718[/C][C]5.75753205128204[/C][/ROW]
[ROW][C]9[/C][C]103.3[/C][C]110.809134615385[/C][C]-7.50913461538463[/C][/ROW]
[ROW][C]10[/C][C]114.9[/C][C]113.942467948718[/C][C]0.957532051282047[/C][/ROW]
[ROW][C]11[/C][C]105.8[/C][C]107.042467948718[/C][C]-1.24246794871797[/C][/ROW]
[ROW][C]12[/C][C]94.2[/C][C]101.492467948718[/C][C]-7.29246794871796[/C][/ROW]
[ROW][C]13[/C][C]98.4[/C][C]95.1644230769231[/C][C]3.23557692307688[/C][/ROW]
[ROW][C]14[/C][C]99.4[/C][C]97.5977564102564[/C][C]1.80224358974359[/C][/ROW]
[ROW][C]15[/C][C]108.8[/C][C]110.664423076923[/C][C]-1.86442307692309[/C][/ROW]
[ROW][C]16[/C][C]112.6[/C][C]105.431089743590[/C][C]7.16891025641024[/C][/ROW]
[ROW][C]17[/C][C]104.4[/C][C]103.559134615385[/C][C]0.840865384615384[/C][/ROW]
[ROW][C]18[/C][C]112.2[/C][C]117.175801282051[/C][C]-4.97580128205128[/C][/ROW]
[ROW][C]19[/C][C]81.1[/C][C]82.3758012820513[/C][C]-1.27580128205129[/C][/ROW]
[ROW][C]20[/C][C]97.1[/C][C]93.192467948718[/C][C]3.90753205128205[/C][/ROW]
[ROW][C]21[/C][C]112.6[/C][C]113.259134615385[/C][C]-0.659134615384621[/C][/ROW]
[ROW][C]22[/C][C]113.8[/C][C]116.392467948718[/C][C]-2.59246794871795[/C][/ROW]
[ROW][C]23[/C][C]107.8[/C][C]109.492467948718[/C][C]-1.69246794871795[/C][/ROW]
[ROW][C]24[/C][C]103.2[/C][C]103.942467948718[/C][C]-0.742467948717947[/C][/ROW]
[ROW][C]25[/C][C]103.3[/C][C]97.6144230769231[/C][C]5.68557692307688[/C][/ROW]
[ROW][C]26[/C][C]101.2[/C][C]100.047756410256[/C][C]1.15224358974359[/C][/ROW]
[ROW][C]27[/C][C]107.7[/C][C]113.114423076923[/C][C]-5.41442307692307[/C][/ROW]
[ROW][C]28[/C][C]110.4[/C][C]107.881089743590[/C][C]2.51891025641027[/C][/ROW]
[ROW][C]29[/C][C]101.9[/C][C]106.009134615385[/C][C]-4.10913461538461[/C][/ROW]
[ROW][C]30[/C][C]115.9[/C][C]119.625801282051[/C][C]-3.72580128205127[/C][/ROW]
[ROW][C]31[/C][C]89.9[/C][C]84.8258012820513[/C][C]5.07419871794872[/C][/ROW]
[ROW][C]32[/C][C]88.6[/C][C]95.642467948718[/C][C]-7.04246794871795[/C][/ROW]
[ROW][C]33[/C][C]117.2[/C][C]115.709134615385[/C][C]1.49086538461539[/C][/ROW]
[ROW][C]34[/C][C]123.9[/C][C]118.842467948718[/C][C]5.05753205128207[/C][/ROW]
[ROW][C]35[/C][C]100[/C][C]111.942467948718[/C][C]-11.9424679487179[/C][/ROW]
[ROW][C]36[/C][C]103.6[/C][C]106.392467948718[/C][C]-2.79246794871795[/C][/ROW]
[ROW][C]37[/C][C]94.1[/C][C]100.064423076923[/C][C]-5.96442307692312[/C][/ROW]
[ROW][C]38[/C][C]98.7[/C][C]102.497756410256[/C][C]-3.7977564102564[/C][/ROW]
[ROW][C]39[/C][C]119.5[/C][C]115.564423076923[/C][C]3.93557692307693[/C][/ROW]
[ROW][C]40[/C][C]112.7[/C][C]110.331089743590[/C][C]2.36891025641027[/C][/ROW]
[ROW][C]41[/C][C]104.4[/C][C]108.190865384615[/C][C]-3.79086538461539[/C][/ROW]
[ROW][C]42[/C][C]124.7[/C][C]121.807532051282[/C][C]2.89246794871795[/C][/ROW]
[ROW][C]43[/C][C]89.1[/C][C]87.007532051282[/C][C]2.09246794871794[/C][/ROW]
[ROW][C]44[/C][C]97[/C][C]97.8241987179487[/C][C]-0.82419871794872[/C][/ROW]
[ROW][C]45[/C][C]121.6[/C][C]117.890865384615[/C][C]3.70913461538461[/C][/ROW]
[ROW][C]46[/C][C]118.8[/C][C]121.024198717949[/C][C]-2.22419871794873[/C][/ROW]
[ROW][C]47[/C][C]114[/C][C]114.124198717949[/C][C]-0.124198717948722[/C][/ROW]
[ROW][C]48[/C][C]111.5[/C][C]108.574198717949[/C][C]2.92580128205128[/C][/ROW]
[ROW][C]49[/C][C]97.2[/C][C]102.246153846154[/C][C]-5.04615384615389[/C][/ROW]
[ROW][C]50[/C][C]102.5[/C][C]104.679487179487[/C][C]-2.17948717948718[/C][/ROW]
[ROW][C]51[/C][C]113.4[/C][C]117.746153846154[/C][C]-4.34615384615384[/C][/ROW]
[ROW][C]52[/C][C]109.8[/C][C]112.512820512821[/C][C]-2.71282051282051[/C][/ROW]
[ROW][C]53[/C][C]104.9[/C][C]110.640865384615[/C][C]-5.74086538461538[/C][/ROW]
[ROW][C]54[/C][C]126.1[/C][C]124.257532051282[/C][C]1.84246794871794[/C][/ROW]
[ROW][C]55[/C][C]80[/C][C]89.457532051282[/C][C]-9.45753205128205[/C][/ROW]
[ROW][C]56[/C][C]96.8[/C][C]100.274198717949[/C][C]-3.47419871794871[/C][/ROW]
[ROW][C]57[/C][C]117.2[/C][C]120.340865384615[/C][C]-3.14086538461538[/C][/ROW]
[ROW][C]58[/C][C]112.3[/C][C]123.474198717949[/C][C]-11.1741987179487[/C][/ROW]
[ROW][C]59[/C][C]117.3[/C][C]116.574198717949[/C][C]0.725801282051282[/C][/ROW]
[ROW][C]60[/C][C]111.1[/C][C]111.024198717949[/C][C]0.0758012820512806[/C][/ROW]
[ROW][C]61[/C][C]102.2[/C][C]104.696153846154[/C][C]-2.49615384615388[/C][/ROW]
[ROW][C]62[/C][C]104.3[/C][C]107.129487179487[/C][C]-2.82948717948718[/C][/ROW]
[ROW][C]63[/C][C]122.9[/C][C]120.196153846154[/C][C]2.70384615384617[/C][/ROW]
[ROW][C]64[/C][C]107.6[/C][C]114.962820512820[/C][C]-7.36282051282051[/C][/ROW]
[ROW][C]65[/C][C]121.3[/C][C]113.090865384615[/C][C]8.20913461538462[/C][/ROW]
[ROW][C]66[/C][C]131.5[/C][C]126.707532051282[/C][C]4.79246794871795[/C][/ROW]
[ROW][C]67[/C][C]89[/C][C]91.907532051282[/C][C]-2.90753205128204[/C][/ROW]
[ROW][C]68[/C][C]104.4[/C][C]102.724198717949[/C][C]1.67580128205130[/C][/ROW]
[ROW][C]69[/C][C]128.9[/C][C]122.790865384615[/C][C]6.10913461538463[/C][/ROW]
[ROW][C]70[/C][C]135.9[/C][C]125.924198717949[/C][C]9.9758012820513[/C][/ROW]
[ROW][C]71[/C][C]133.3[/C][C]119.024198717949[/C][C]14.2758012820513[/C][/ROW]
[ROW][C]72[/C][C]121.3[/C][C]113.474198717949[/C][C]7.82580128205129[/C][/ROW]
[/TABLE]
Source: https://freestatistics.org/blog/index.php?pk=25189&T=4

Globally Unique Identifier (entire table): ba.freestatistics.org/blog/index.php?pk=25189&T=4

As an alternative you can also use a QR Code:  

The GUIDs for individual cells are displayed in the table below:

Multiple Linear Regression - Actuals, Interpolation, and Residuals
Time or IndexActualsInterpolationForecastResidualsPrediction Error
197.392.71442307692294.58557692307713
210195.14775641025645.85224358974357
3113.2108.2144230769234.98557692307691
4101102.981089743590-1.98108974358975
5105.7101.1091346153854.59086538461537
6113.9114.725801282051-0.825801282051288
786.479.92580128205136.47419871794872
896.590.7424679487185.75753205128204
9103.3110.809134615385-7.50913461538463
10114.9113.9424679487180.957532051282047
11105.8107.042467948718-1.24246794871797
1294.2101.492467948718-7.29246794871796
1398.495.16442307692313.23557692307688
1499.497.59775641025641.80224358974359
15108.8110.664423076923-1.86442307692309
16112.6105.4310897435907.16891025641024
17104.4103.5591346153850.840865384615384
18112.2117.175801282051-4.97580128205128
1981.182.3758012820513-1.27580128205129
2097.193.1924679487183.90753205128205
21112.6113.259134615385-0.659134615384621
22113.8116.392467948718-2.59246794871795
23107.8109.492467948718-1.69246794871795
24103.2103.942467948718-0.742467948717947
25103.397.61442307692315.68557692307688
26101.2100.0477564102561.15224358974359
27107.7113.114423076923-5.41442307692307
28110.4107.8810897435902.51891025641027
29101.9106.009134615385-4.10913461538461
30115.9119.625801282051-3.72580128205127
3189.984.82580128205135.07419871794872
3288.695.642467948718-7.04246794871795
33117.2115.7091346153851.49086538461539
34123.9118.8424679487185.05753205128207
35100111.942467948718-11.9424679487179
36103.6106.392467948718-2.79246794871795
3794.1100.064423076923-5.96442307692312
3898.7102.497756410256-3.7977564102564
39119.5115.5644230769233.93557692307693
40112.7110.3310897435902.36891025641027
41104.4108.190865384615-3.79086538461539
42124.7121.8075320512822.89246794871795
4389.187.0075320512822.09246794871794
449797.8241987179487-0.82419871794872
45121.6117.8908653846153.70913461538461
46118.8121.024198717949-2.22419871794873
47114114.124198717949-0.124198717948722
48111.5108.5741987179492.92580128205128
4997.2102.246153846154-5.04615384615389
50102.5104.679487179487-2.17948717948718
51113.4117.746153846154-4.34615384615384
52109.8112.512820512821-2.71282051282051
53104.9110.640865384615-5.74086538461538
54126.1124.2575320512821.84246794871794
558089.457532051282-9.45753205128205
5696.8100.274198717949-3.47419871794871
57117.2120.340865384615-3.14086538461538
58112.3123.474198717949-11.1741987179487
59117.3116.5741987179490.725801282051282
60111.1111.0241987179490.0758012820512806
61102.2104.696153846154-2.49615384615388
62104.3107.129487179487-2.82948717948718
63122.9120.1961538461542.70384615384617
64107.6114.962820512820-7.36282051282051
65121.3113.0908653846158.20913461538462
66131.5126.7075320512824.79246794871795
678991.907532051282-2.90753205128204
68104.4102.7241987179491.67580128205130
69128.9122.7908653846156.10913461538463
70135.9125.9241987179499.9758012820513
71133.3119.02419871794914.2758012820513
72121.3113.4741987179497.82580128205129


Parameters (Session):
par1 = 1 ; par2 = Include Monthly Dummies ; par3 = Linear Trend ;
Parameters (R input):
par1 = 1 ; par2 = Include Monthly Dummies ; par3 = Linear Trend ;
R code (references can be found in the software module):
library(lattice)
par1 <- as.numeric(par1)
x <- t(y)
k <- length(x[1,])
n <- length(x[,1])
x1 <- cbind(x[,par1], x[,1:k!=par1])
mycolnames <- c(colnames(x)[par1], colnames(x)[1:k!=par1])
colnames(x1) <- mycolnames #colnames(x)[par1]
x <- x1
if (par3 == 'First Differences'){
x2 <- array(0, dim=c(n-1,k), dimnames=list(1:(n-1), paste('(1-B)',colnames(x),sep='')))
for (i in 1:n-1) {
for (j in 1:k) {
x2[i,j] <- x[i+1,j] - x[i,j]
}
}
x <- x2
}
if (par2 == 'Include Monthly Dummies'){
x2 <- array(0, dim=c(n,11), dimnames=list(1:n, paste('M', seq(1:11), sep ='')))
for (i in 1:11){
x2[seq(i,n,12),i] <- 1
}
x <- cbind(x, x2)
}
if (par2 == 'Include Quarterly Dummies'){
x2 <- array(0, dim=c(n,3), dimnames=list(1:n, paste('Q', seq(1:3), sep ='')))
for (i in 1:3){
x2[seq(i,n,4),i] <- 1
}
x <- cbind(x, x2)
}
k <- length(x[1,])
if (par3 == 'Linear Trend'){
x <- cbind(x, c(1:n))
colnames(x)[k+1] <- 't'
}
x
k <- length(x[1,])
df <- as.data.frame(x)
(mylm <- lm(df))
(mysum <- summary(mylm))
bitmap(file='test0.png')
plot(x[,1], type='l', main='Actuals and Interpolation', ylab='value of Actuals and Interpolation (dots)', xlab='time or index')
points(x[,1]-mysum$resid)
grid()
dev.off()
bitmap(file='test1.png')
plot(mysum$resid, type='b', pch=19, main='Residuals', ylab='value of Residuals', xlab='time or index')
grid()
dev.off()
bitmap(file='test2.png')
hist(mysum$resid, main='Residual Histogram', xlab='values of Residuals')
grid()
dev.off()
bitmap(file='test3.png')
densityplot(~mysum$resid,col='black',main='Residual Density Plot', xlab='values of Residuals')
dev.off()
bitmap(file='test4.png')
qqnorm(mysum$resid, main='Residual Normal Q-Q Plot')
grid()
dev.off()
(myerror <- as.ts(mysum$resid))
bitmap(file='test5.png')
dum <- cbind(lag(myerror,k=1),myerror)
dum
dum1 <- dum[2:length(myerror),]
dum1
z <- as.data.frame(dum1)
z
plot(z,main=paste('Residual Lag plot, lowess, and regression line'), ylab='values of Residuals', xlab='lagged values of Residuals')
lines(lowess(z))
abline(lm(z))
grid()
dev.off()
bitmap(file='test6.png')
acf(mysum$resid, lag.max=length(mysum$resid)/2, main='Residual Autocorrelation Function')
grid()
dev.off()
bitmap(file='test7.png')
pacf(mysum$resid, lag.max=length(mysum$resid)/2, main='Residual Partial Autocorrelation Function')
grid()
dev.off()
bitmap(file='test8.png')
opar <- par(mfrow = c(2,2), oma = c(0, 0, 1.1, 0))
plot(mylm, las = 1, sub='Residual Diagnostics')
par(opar)
dev.off()
load(file='createtable')
a<-table.start()
a<-table.row.start(a)
a<-table.element(a, 'Multiple Linear Regression - Estimated Regression Equation', 1, TRUE)
a<-table.row.end(a)
myeq <- colnames(x)[1]
myeq <- paste(myeq, '[t] = ', sep='')
for (i in 1:k){
if (mysum$coefficients[i,1] > 0) myeq <- paste(myeq, '+', '')
myeq <- paste(myeq, mysum$coefficients[i,1], sep=' ')
if (rownames(mysum$coefficients)[i] != '(Intercept)') {
myeq <- paste(myeq, rownames(mysum$coefficients)[i], sep='')
if (rownames(mysum$coefficients)[i] != 't') myeq <- paste(myeq, '[t]', sep='')
}
}
myeq <- paste(myeq, ' + e[t]')
a<-table.row.start(a)
a<-table.element(a, myeq)
a<-table.row.end(a)
a<-table.end(a)
table.save(a,file='mytable1.tab')
a<-table.start()
a<-table.row.start(a)
a<-table.element(a,hyperlink('ols1.htm','Multiple Linear Regression - Ordinary Least Squares',''), 6, TRUE)
a<-table.row.end(a)
a<-table.row.start(a)
a<-table.element(a,'Variable',header=TRUE)
a<-table.element(a,'Parameter',header=TRUE)
a<-table.element(a,'S.D.',header=TRUE)
a<-table.element(a,'T-STAT
H0: parameter = 0',header=TRUE)
a<-table.element(a,'2-tail p-value',header=TRUE)
a<-table.element(a,'1-tail p-value',header=TRUE)
a<-table.row.end(a)
for (i in 1:k){
a<-table.row.start(a)
a<-table.element(a,rownames(mysum$coefficients)[i],header=TRUE)
a<-table.element(a,mysum$coefficients[i,1])
a<-table.element(a, round(mysum$coefficients[i,2],6))
a<-table.element(a, round(mysum$coefficients[i,3],4))
a<-table.element(a, round(mysum$coefficients[i,4],6))
a<-table.element(a, round(mysum$coefficients[i,4]/2,6))
a<-table.row.end(a)
}
a<-table.end(a)
table.save(a,file='mytable2.tab')
a<-table.start()
a<-table.row.start(a)
a<-table.element(a, 'Multiple Linear Regression - Regression Statistics', 2, TRUE)
a<-table.row.end(a)
a<-table.row.start(a)
a<-table.element(a, 'Multiple R',1,TRUE)
a<-table.element(a, sqrt(mysum$r.squared))
a<-table.row.end(a)
a<-table.row.start(a)
a<-table.element(a, 'R-squared',1,TRUE)
a<-table.element(a, mysum$r.squared)
a<-table.row.end(a)
a<-table.row.start(a)
a<-table.element(a, 'Adjusted R-squared',1,TRUE)
a<-table.element(a, mysum$adj.r.squared)
a<-table.row.end(a)
a<-table.row.start(a)
a<-table.element(a, 'F-TEST (value)',1,TRUE)
a<-table.element(a, mysum$fstatistic[1])
a<-table.row.end(a)
a<-table.row.start(a)
a<-table.element(a, 'F-TEST (DF numerator)',1,TRUE)
a<-table.element(a, mysum$fstatistic[2])
a<-table.row.end(a)
a<-table.row.start(a)
a<-table.element(a, 'F-TEST (DF denominator)',1,TRUE)
a<-table.element(a, mysum$fstatistic[3])
a<-table.row.end(a)
a<-table.row.start(a)
a<-table.element(a, 'p-value',1,TRUE)
a<-table.element(a, 1-pf(mysum$fstatistic[1],mysum$fstatistic[2],mysum$fstatistic[3]))
a<-table.row.end(a)
a<-table.row.start(a)
a<-table.element(a, 'Multiple Linear Regression - Residual Statistics', 2, TRUE)
a<-table.row.end(a)
a<-table.row.start(a)
a<-table.element(a, 'Residual Standard Deviation',1,TRUE)
a<-table.element(a, mysum$sigma)
a<-table.row.end(a)
a<-table.row.start(a)
a<-table.element(a, 'Sum Squared Residuals',1,TRUE)
a<-table.element(a, sum(myerror*myerror))
a<-table.row.end(a)
a<-table.end(a)
table.save(a,file='mytable3.tab')
a<-table.start()
a<-table.row.start(a)
a<-table.element(a, 'Multiple Linear Regression - Actuals, Interpolation, and Residuals', 4, TRUE)
a<-table.row.end(a)
a<-table.row.start(a)
a<-table.element(a, 'Time or Index', 1, TRUE)
a<-table.element(a, 'Actuals', 1, TRUE)
a<-table.element(a, 'Interpolation
Forecast', 1, TRUE)
a<-table.element(a, 'Residuals
Prediction Error', 1, TRUE)
a<-table.row.end(a)
for (i in 1:n) {
a<-table.row.start(a)
a<-table.element(a,i, 1, TRUE)
a<-table.element(a,x[i])
a<-table.element(a,x[i]-mysum$resid[i])
a<-table.element(a,mysum$resid[i])
a<-table.row.end(a)
}
a<-table.end(a)
table.save(a,file='mytable4.tab')