Free Statistics

of Irreproducible Research!

Author's title

Author*The author of this computation has been verified*
R Software Modulerwasp_multipleregression.wasp
Title produced by softwareMultiple Regression
Date of computationSat, 22 Nov 2008 04:23:15 -0700
Cite this page as followsStatistical Computations at FreeStatistics.org, Office for Research Development and Education, URL https://freestatistics.org/blog/index.php?v=date/2008/Nov/22/t1227353070ehpb9dccmdr2wxt.htm/, Retrieved Sat, 18 May 2024 02:50:19 +0000
Statistical Computations at FreeStatistics.org, Office for Research Development and Education, URL https://freestatistics.org/blog/index.php?pk=25177, Retrieved Sat, 18 May 2024 02:50:19 +0000
QR Codes:

Original text written by user:
IsPrivate?No (this computation is public)
User-defined keywords
Estimated Impact222
Family? (F = Feedback message, R = changed R code, M = changed R Module, P = changed Parameters, D = changed Data)
F     [Multiple Regression] [] [2007-11-19 19:55:31] [b731da8b544846036771bbf9bf2f34ce]
F R  D  [Multiple Regression] [marlies.polfliet_...] [2008-11-22 10:33:23] [fdc296cbeb5d8064cb0dbd634c3fdc55]
F   PD      [Multiple Regression] [marlies.polfliet_...] [2008-11-22 11:23:15] [e221948dd14811c7d88a6530ac2a8702] [Current]
Feedback Forum
2008-12-01 13:47:41 [Hundra Smet] [reply
er werd vanaf 31 december 2006 een klom ingevoerd met waarden 0 en . ook werd 'lineair trend' aangeduid. zo komen we dus tot het beste resultaat.
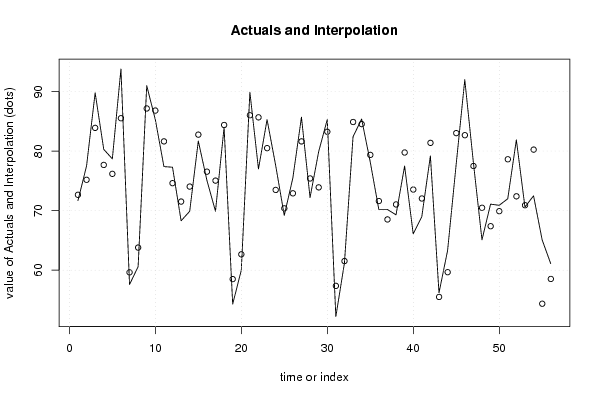
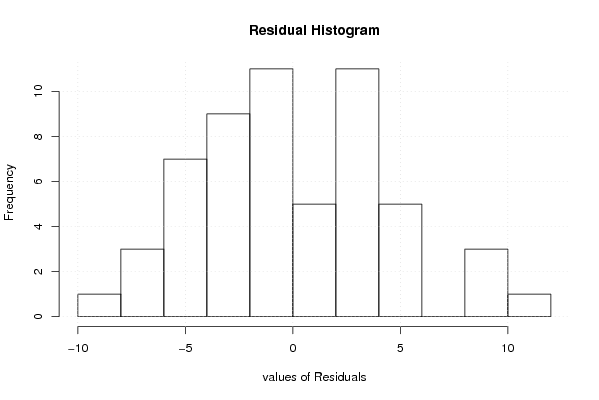
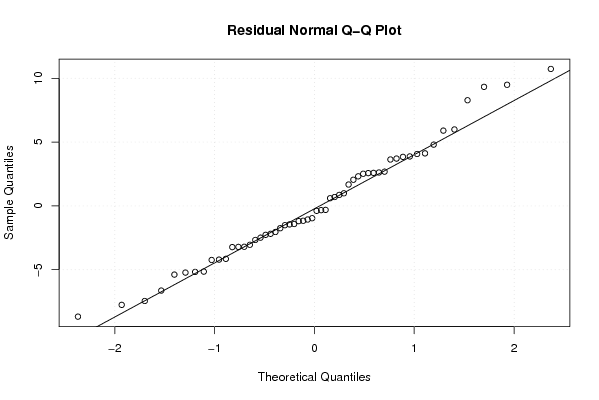
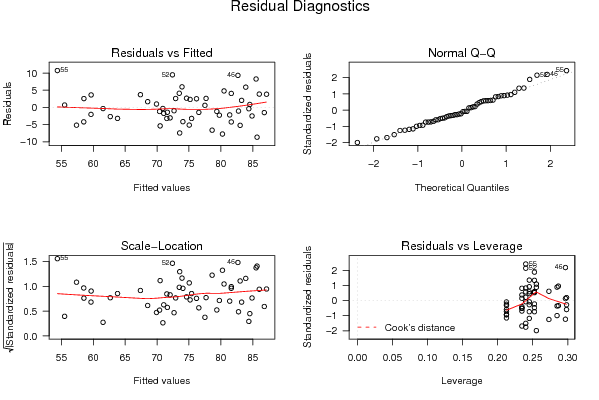
er wordt een zeer uitgebreide uitleg gegeven en ook bij elke grafiek kan je goed volgen wat er gebeurt. bijvoorbeeld bij het residual histogram wordt een beschrijving gegeven van de grafiek. de student zegt dat het histogram een normaalverdeling zou moeten weergeven, maar dat dat nog niet het geval is (de top is ingevallen en ook in de staarten zijn er oneffenheden).
2008-12-01 17:56:01 [Hannes Van Hoof] [reply
Grafieken worden gegeven met een goede interpretatie.
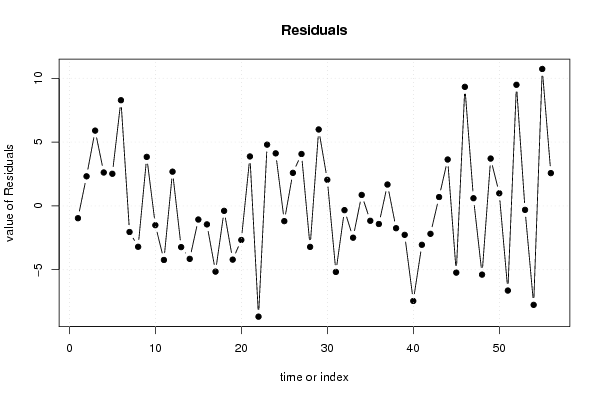
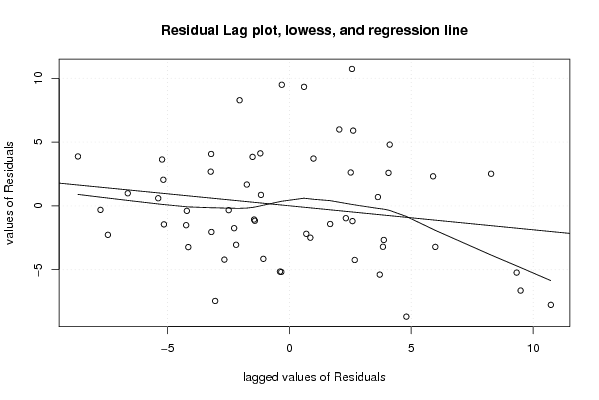
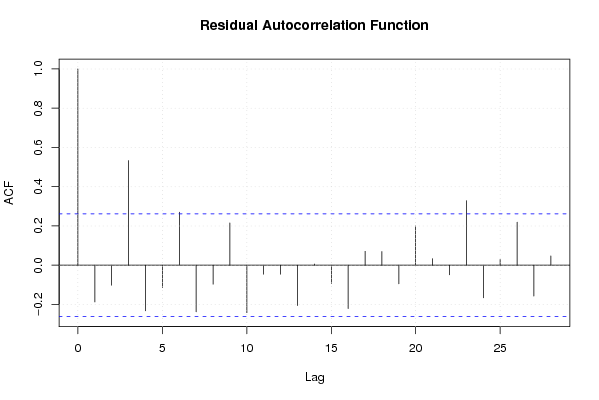
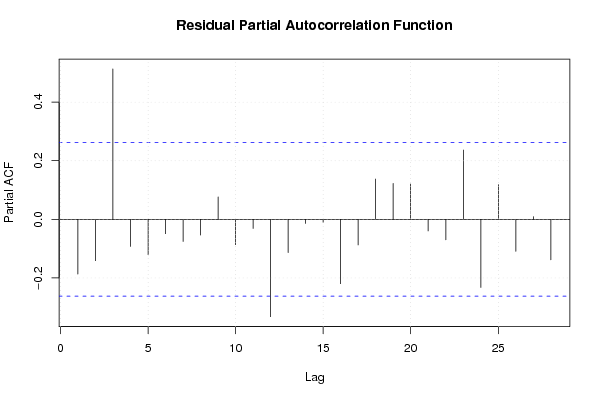
Het is geen perfect model. Dit is vooral te zien aan de histogram (die geen normaal verdeling weergeeft) en de residuals.
De adjusted R-squared is wel een zeer hoge waarde, wat betekent dat veel van de spreiding verklaard kan worden.
2008-12-01 20:06:09 [Marlies Polfliet] [reply
Ik blijf bij mijn versie, ik zou enkel nog willen toevoegen dat de aanvullingen/verbeteringen die ik in Q2) heb bijgevoegd ook op deze datareeks toepasbaar zijn.

Ik zou ook wel nog expliciet willen vermelden dat ik bij tabel drie de verkeerde interpretatie heb gegeven. De Adjusted R-squared (=0.73939…) kan 74% van de schommelingen verklaren. Het model geeft dus een vrij correct beeld.

Post a new message
Dataseries X:
71.7	0
77.5	0
89.8	0
80.3	0
78.7	0
93.8	0
57.6	0
60.6	0
91	0
85.3	0
77.4	0
77.3	0
68.3	0
69.9	0
81.7	0
75.1	0
69.9	0
84	0
54.3	0
60	0
89.9	0
77	0
85.3	0
77.6	0
69.2	0
75.5	0
85.7	0
72.2	0
79.9	0
85.3	0
52.2	0
61.2	0
82.4	0
85.4	0
78.2	0
70.2	1
70.2	1
69.3	1
77.5	1
66.1	1
69	1
79.2	1
56.2	1
63.3	1
77.8	1
92	1
78.1	1
65.1	1
71.1	1
70.9	1
72	1
81.9	1
70.6	1
72.5	1
65.1	1
61.1	1


Summary of computational transaction
Raw Inputview raw input (R code)
Raw Outputview raw output of R engine
Computing time3 seconds
R Server'Gwilym Jenkins' @ 72.249.127.135

\begin{tabular}{lllllllll}
\hline
Summary of computational transaction \tabularnewline
Raw Input & view raw input (R code)  \tabularnewline
Raw Output & view raw output of R engine  \tabularnewline
Computing time & 3 seconds \tabularnewline
R Server & 'Gwilym Jenkins' @ 72.249.127.135 \tabularnewline
\hline
\end{tabular}
%Source: https://freestatistics.org/blog/index.php?pk=25177&T=0

[TABLE]
[ROW][C]Summary of computational transaction[/C][/ROW]
[ROW][C]Raw Input[/C][C]view raw input (R code) [/C][/ROW]
[ROW][C]Raw Output[/C][C]view raw output of R engine [/C][/ROW]
[ROW][C]Computing time[/C][C]3 seconds[/C][/ROW]
[ROW][C]R Server[/C][C]'Gwilym Jenkins' @ 72.249.127.135[/C][/ROW]
[/TABLE]
Source: https://freestatistics.org/blog/index.php?pk=25177&T=0

Globally Unique Identifier (entire table): ba.freestatistics.org/blog/index.php?pk=25177&T=0

As an alternative you can also use a QR Code:  

The GUIDs for individual cells are displayed in the table below:

Summary of computational transaction
Raw Inputview raw input (R code)
Raw Outputview raw output of R engine
Computing time3 seconds
R Server'Gwilym Jenkins' @ 72.249.127.135


Multiple Linear Regression - Estimated Regression Equation
y[t] = + 75.7532769556026 -0.730373502466514x[t] -2.99605238430814M1[t] -0.381449377495884M2[t] + 8.43315362931643M3[t] + 2.30775663612874M4[t] + 0.902359642941036M5[t] + 10.3369626497533M6[t] -15.4484343434343M7[t] -11.1938313366220M8[t] + 12.2585976039464M9[t] + 12.0032006107588M10[t] + 6.92280361757106M11[t] -0.0946030068123101t + e[t]

\begin{tabular}{lllllllll}
\hline
Multiple Linear Regression - Estimated Regression Equation \tabularnewline
y[t] =  +  75.7532769556026 -0.730373502466514x[t] -2.99605238430814M1[t] -0.381449377495884M2[t] +  8.43315362931643M3[t] +  2.30775663612874M4[t] +  0.902359642941036M5[t] +  10.3369626497533M6[t] -15.4484343434343M7[t] -11.1938313366220M8[t] +  12.2585976039464M9[t] +  12.0032006107588M10[t] +  6.92280361757106M11[t] -0.0946030068123101t  + e[t] \tabularnewline
\hline
\end{tabular}
%Source: https://freestatistics.org/blog/index.php?pk=25177&T=1

[TABLE]
[ROW][C]Multiple Linear Regression - Estimated Regression Equation[/C][/ROW]
[ROW][C]y[t] =  +  75.7532769556026 -0.730373502466514x[t] -2.99605238430814M1[t] -0.381449377495884M2[t] +  8.43315362931643M3[t] +  2.30775663612874M4[t] +  0.902359642941036M5[t] +  10.3369626497533M6[t] -15.4484343434343M7[t] -11.1938313366220M8[t] +  12.2585976039464M9[t] +  12.0032006107588M10[t] +  6.92280361757106M11[t] -0.0946030068123101t  + e[t][/C][/ROW]
[/TABLE]
Source: https://freestatistics.org/blog/index.php?pk=25177&T=1

Globally Unique Identifier (entire table): ba.freestatistics.org/blog/index.php?pk=25177&T=1

As an alternative you can also use a QR Code:  

The GUIDs for individual cells are displayed in the table below:

Multiple Linear Regression - Estimated Regression Equation
y[t] = + 75.7532769556026 -0.730373502466514x[t] -2.99605238430814M1[t] -0.381449377495884M2[t] + 8.43315362931643M3[t] + 2.30775663612874M4[t] + 0.902359642941036M5[t] + 10.3369626497533M6[t] -15.4484343434343M7[t] -11.1938313366220M8[t] + 12.2585976039464M9[t] + 12.0032006107588M10[t] + 6.92280361757106M11[t] -0.0946030068123101t + e[t]


Multiple Linear Regression - Ordinary Least Squares
VariableParameterS.D.T-STATH0: parameter = 02-tail p-value1-tail p-value
(Intercept)75.75327695560262.91138926.019600
x-0.7303735024665142.682994-0.27220.7867840.393392
M1-2.996052384308143.397212-0.88190.3828420.191421
M2-0.3814493774958843.394088-0.11240.9110520.455526
M38.433153629316433.3928542.48560.0170.0085
M42.307756636128743.3935130.680.5002050.250102
M50.9023596429410363.3960640.26570.7917640.395882
M610.33696264975333.4005033.03980.0040640.002032
M7-15.44843434343433.406822-4.53464.8e-052.4e-05
M8-11.19383133662203.415011-3.27780.0021050.001052
M912.25859760394643.6057653.39970.0014890.000745
M1012.00320061075883.6139873.32130.0018620.000931
M116.922803617571063.6239631.91030.062940.03147
t-0.09460300681231010.080148-1.18040.2444990.122249

\begin{tabular}{lllllllll}
\hline
Multiple Linear Regression - Ordinary Least Squares \tabularnewline
Variable & Parameter & S.D. & T-STATH0: parameter = 0 & 2-tail p-value & 1-tail p-value \tabularnewline
(Intercept) & 75.7532769556026 & 2.911389 & 26.0196 & 0 & 0 \tabularnewline
x & -0.730373502466514 & 2.682994 & -0.2722 & 0.786784 & 0.393392 \tabularnewline
M1 & -2.99605238430814 & 3.397212 & -0.8819 & 0.382842 & 0.191421 \tabularnewline
M2 & -0.381449377495884 & 3.394088 & -0.1124 & 0.911052 & 0.455526 \tabularnewline
M3 & 8.43315362931643 & 3.392854 & 2.4856 & 0.017 & 0.0085 \tabularnewline
M4 & 2.30775663612874 & 3.393513 & 0.68 & 0.500205 & 0.250102 \tabularnewline
M5 & 0.902359642941036 & 3.396064 & 0.2657 & 0.791764 & 0.395882 \tabularnewline
M6 & 10.3369626497533 & 3.400503 & 3.0398 & 0.004064 & 0.002032 \tabularnewline
M7 & -15.4484343434343 & 3.406822 & -4.5346 & 4.8e-05 & 2.4e-05 \tabularnewline
M8 & -11.1938313366220 & 3.415011 & -3.2778 & 0.002105 & 0.001052 \tabularnewline
M9 & 12.2585976039464 & 3.605765 & 3.3997 & 0.001489 & 0.000745 \tabularnewline
M10 & 12.0032006107588 & 3.613987 & 3.3213 & 0.001862 & 0.000931 \tabularnewline
M11 & 6.92280361757106 & 3.623963 & 1.9103 & 0.06294 & 0.03147 \tabularnewline
t & -0.0946030068123101 & 0.080148 & -1.1804 & 0.244499 & 0.122249 \tabularnewline
\hline
\end{tabular}
%Source: https://freestatistics.org/blog/index.php?pk=25177&T=2

[TABLE]
[ROW][C]Multiple Linear Regression - Ordinary Least Squares[/C][/ROW]
[ROW][C]Variable[/C][C]Parameter[/C][C]S.D.[/C][C]T-STATH0: parameter = 0[/C][C]2-tail p-value[/C][C]1-tail p-value[/C][/ROW]
[ROW][C](Intercept)[/C][C]75.7532769556026[/C][C]2.911389[/C][C]26.0196[/C][C]0[/C][C]0[/C][/ROW]
[ROW][C]x[/C][C]-0.730373502466514[/C][C]2.682994[/C][C]-0.2722[/C][C]0.786784[/C][C]0.393392[/C][/ROW]
[ROW][C]M1[/C][C]-2.99605238430814[/C][C]3.397212[/C][C]-0.8819[/C][C]0.382842[/C][C]0.191421[/C][/ROW]
[ROW][C]M2[/C][C]-0.381449377495884[/C][C]3.394088[/C][C]-0.1124[/C][C]0.911052[/C][C]0.455526[/C][/ROW]
[ROW][C]M3[/C][C]8.43315362931643[/C][C]3.392854[/C][C]2.4856[/C][C]0.017[/C][C]0.0085[/C][/ROW]
[ROW][C]M4[/C][C]2.30775663612874[/C][C]3.393513[/C][C]0.68[/C][C]0.500205[/C][C]0.250102[/C][/ROW]
[ROW][C]M5[/C][C]0.902359642941036[/C][C]3.396064[/C][C]0.2657[/C][C]0.791764[/C][C]0.395882[/C][/ROW]
[ROW][C]M6[/C][C]10.3369626497533[/C][C]3.400503[/C][C]3.0398[/C][C]0.004064[/C][C]0.002032[/C][/ROW]
[ROW][C]M7[/C][C]-15.4484343434343[/C][C]3.406822[/C][C]-4.5346[/C][C]4.8e-05[/C][C]2.4e-05[/C][/ROW]
[ROW][C]M8[/C][C]-11.1938313366220[/C][C]3.415011[/C][C]-3.2778[/C][C]0.002105[/C][C]0.001052[/C][/ROW]
[ROW][C]M9[/C][C]12.2585976039464[/C][C]3.605765[/C][C]3.3997[/C][C]0.001489[/C][C]0.000745[/C][/ROW]
[ROW][C]M10[/C][C]12.0032006107588[/C][C]3.613987[/C][C]3.3213[/C][C]0.001862[/C][C]0.000931[/C][/ROW]
[ROW][C]M11[/C][C]6.92280361757106[/C][C]3.623963[/C][C]1.9103[/C][C]0.06294[/C][C]0.03147[/C][/ROW]
[ROW][C]t[/C][C]-0.0946030068123101[/C][C]0.080148[/C][C]-1.1804[/C][C]0.244499[/C][C]0.122249[/C][/ROW]
[/TABLE]
Source: https://freestatistics.org/blog/index.php?pk=25177&T=2

Globally Unique Identifier (entire table): ba.freestatistics.org/blog/index.php?pk=25177&T=2

As an alternative you can also use a QR Code:  

The GUIDs for individual cells are displayed in the table below:

Multiple Linear Regression - Ordinary Least Squares
VariableParameterS.D.T-STATH0: parameter = 02-tail p-value1-tail p-value
(Intercept)75.75327695560262.91138926.019600
x-0.7303735024665142.682994-0.27220.7867840.393392
M1-2.996052384308143.397212-0.88190.3828420.191421
M2-0.3814493774958843.394088-0.11240.9110520.455526
M38.433153629316433.3928542.48560.0170.0085
M42.307756636128743.3935130.680.5002050.250102
M50.9023596429410363.3960640.26570.7917640.395882
M610.33696264975333.4005033.03980.0040640.002032
M7-15.44843434343433.406822-4.53464.8e-052.4e-05
M8-11.19383133662203.415011-3.27780.0021050.001052
M912.25859760394643.6057653.39970.0014890.000745
M1012.00320061075883.6139873.32130.0018620.000931
M116.922803617571063.6239631.91030.062940.03147
t-0.09460300681231010.080148-1.18040.2444990.122249


Multiple Linear Regression - Regression Statistics
Multiple R0.894983517526208
R-squared0.800995496643584
Adjusted R-squared0.739398864652312
F-TEST (value)13.0038846402688
F-TEST (DF numerator)13
F-TEST (DF denominator)42
p-value8.41903213810724e-11
Multiple Linear Regression - Residual Statistics
Residual Standard Deviation5.05336804766105
Sum Squared Residuals1072.53420225511

\begin{tabular}{lllllllll}
\hline
Multiple Linear Regression - Regression Statistics \tabularnewline
Multiple R & 0.894983517526208 \tabularnewline
R-squared & 0.800995496643584 \tabularnewline
Adjusted R-squared & 0.739398864652312 \tabularnewline
F-TEST (value) & 13.0038846402688 \tabularnewline
F-TEST (DF numerator) & 13 \tabularnewline
F-TEST (DF denominator) & 42 \tabularnewline
p-value & 8.41903213810724e-11 \tabularnewline
Multiple Linear Regression - Residual Statistics \tabularnewline
Residual Standard Deviation & 5.05336804766105 \tabularnewline
Sum Squared Residuals & 1072.53420225511 \tabularnewline
\hline
\end{tabular}
%Source: https://freestatistics.org/blog/index.php?pk=25177&T=3

[TABLE]
[ROW][C]Multiple Linear Regression - Regression Statistics[/C][/ROW]
[ROW][C]Multiple R[/C][C]0.894983517526208[/C][/ROW]
[ROW][C]R-squared[/C][C]0.800995496643584[/C][/ROW]
[ROW][C]Adjusted R-squared[/C][C]0.739398864652312[/C][/ROW]
[ROW][C]F-TEST (value)[/C][C]13.0038846402688[/C][/ROW]
[ROW][C]F-TEST (DF numerator)[/C][C]13[/C][/ROW]
[ROW][C]F-TEST (DF denominator)[/C][C]42[/C][/ROW]
[ROW][C]p-value[/C][C]8.41903213810724e-11[/C][/ROW]
[ROW][C]Multiple Linear Regression - Residual Statistics[/C][/ROW]
[ROW][C]Residual Standard Deviation[/C][C]5.05336804766105[/C][/ROW]
[ROW][C]Sum Squared Residuals[/C][C]1072.53420225511[/C][/ROW]
[/TABLE]
Source: https://freestatistics.org/blog/index.php?pk=25177&T=3

Globally Unique Identifier (entire table): ba.freestatistics.org/blog/index.php?pk=25177&T=3

As an alternative you can also use a QR Code:  

The GUIDs for individual cells are displayed in the table below:

Multiple Linear Regression - Regression Statistics
Multiple R0.894983517526208
R-squared0.800995496643584
Adjusted R-squared0.739398864652312
F-TEST (value)13.0038846402688
F-TEST (DF numerator)13
F-TEST (DF denominator)42
p-value8.41903213810724e-11
Multiple Linear Regression - Residual Statistics
Residual Standard Deviation5.05336804766105
Sum Squared Residuals1072.53420225511


Multiple Linear Regression - Actuals, Interpolation, and Residuals
Time or IndexActualsInterpolationForecastResidualsPrediction Error
171.772.6626215644818-0.962621564481767
277.575.1826215644822.31737843551796
389.883.9026215644825.89737843551795
480.377.6826215644822.61737843551795
578.776.1826215644822.51737843551795
693.885.5226215644828.27737843551794
757.659.642621564482-2.04262156448204
860.663.802621564482-3.20262156448205
99187.16044749823823.83955250176179
1085.386.8104474982382-1.51044749823822
1177.481.6354474982382-4.23544749823821
1277.374.61804087385482.68195912614516
1368.371.5273854827344-3.22738548273439
1469.974.0473854827343-4.14738548273432
1581.782.7673854827343-1.06738548273432
1675.176.5473854827343-1.44738548273433
1769.975.0473854827343-5.14738548273432
188484.3873854827343-0.387385482734322
1954.358.5073854827343-4.20738548273433
206062.6673854827343-2.66738548273433
2189.986.02521141649053.87478858350952
227785.6752114164905-8.67521141649049
2385.380.50021141649054.79978858350951
2477.673.48280479210714.11719520789288
2569.270.3921494009867-1.19214940098667
2675.572.91214940098662.58785059901339
2785.781.63214940098664.0678505990134
2872.275.4121494009866-3.2121494009866
2979.973.91214940098665.9878505990134
3085.383.25214940098662.04785059901340
3152.257.3721494009866-5.1721494009866
3261.261.5321494009866-0.332149400986602
3382.484.8899753347428-2.48997533474276
3485.484.53997533474280.860024665257242
3578.279.3649753347428-1.16497533474276
3670.271.6171952078929-1.41719520789288
3770.268.52653981677241.67346018322757
3869.371.0465398167724-1.74653981677238
3977.579.7665398167724-2.26653981677237
4066.173.5465398167724-7.44653981677238
416972.0465398167724-3.04653981677237
4279.281.3865398167724-2.18653981677237
4356.255.50653981677240.693460183227629
4463.359.66653981677243.63346018322763
4577.883.0243657505285-5.22436575052854
469282.67436575052859.32563424947146
4778.177.49936575052850.600634249471457
4865.170.4819591261452-5.38195912614517
4971.167.39130373502473.70869626497528
5070.969.91130373502470.98869626497535
517278.6313037350247-6.63130373502465
5281.972.41130373502469.48869626497535
5370.670.9113037350246-0.311303735024657
5472.580.2513037350246-7.75130373502465
5565.154.371303735024710.7286962649753
5661.158.53130373502472.56869626497535

\begin{tabular}{lllllllll}
\hline
Multiple Linear Regression - Actuals, Interpolation, and Residuals \tabularnewline
Time or Index & Actuals & InterpolationForecast & ResidualsPrediction Error \tabularnewline
1 & 71.7 & 72.6626215644818 & -0.962621564481767 \tabularnewline
2 & 77.5 & 75.182621564482 & 2.31737843551796 \tabularnewline
3 & 89.8 & 83.902621564482 & 5.89737843551795 \tabularnewline
4 & 80.3 & 77.682621564482 & 2.61737843551795 \tabularnewline
5 & 78.7 & 76.182621564482 & 2.51737843551795 \tabularnewline
6 & 93.8 & 85.522621564482 & 8.27737843551794 \tabularnewline
7 & 57.6 & 59.642621564482 & -2.04262156448204 \tabularnewline
8 & 60.6 & 63.802621564482 & -3.20262156448205 \tabularnewline
9 & 91 & 87.1604474982382 & 3.83955250176179 \tabularnewline
10 & 85.3 & 86.8104474982382 & -1.51044749823822 \tabularnewline
11 & 77.4 & 81.6354474982382 & -4.23544749823821 \tabularnewline
12 & 77.3 & 74.6180408738548 & 2.68195912614516 \tabularnewline
13 & 68.3 & 71.5273854827344 & -3.22738548273439 \tabularnewline
14 & 69.9 & 74.0473854827343 & -4.14738548273432 \tabularnewline
15 & 81.7 & 82.7673854827343 & -1.06738548273432 \tabularnewline
16 & 75.1 & 76.5473854827343 & -1.44738548273433 \tabularnewline
17 & 69.9 & 75.0473854827343 & -5.14738548273432 \tabularnewline
18 & 84 & 84.3873854827343 & -0.387385482734322 \tabularnewline
19 & 54.3 & 58.5073854827343 & -4.20738548273433 \tabularnewline
20 & 60 & 62.6673854827343 & -2.66738548273433 \tabularnewline
21 & 89.9 & 86.0252114164905 & 3.87478858350952 \tabularnewline
22 & 77 & 85.6752114164905 & -8.67521141649049 \tabularnewline
23 & 85.3 & 80.5002114164905 & 4.79978858350951 \tabularnewline
24 & 77.6 & 73.4828047921071 & 4.11719520789288 \tabularnewline
25 & 69.2 & 70.3921494009867 & -1.19214940098667 \tabularnewline
26 & 75.5 & 72.9121494009866 & 2.58785059901339 \tabularnewline
27 & 85.7 & 81.6321494009866 & 4.0678505990134 \tabularnewline
28 & 72.2 & 75.4121494009866 & -3.2121494009866 \tabularnewline
29 & 79.9 & 73.9121494009866 & 5.9878505990134 \tabularnewline
30 & 85.3 & 83.2521494009866 & 2.04785059901340 \tabularnewline
31 & 52.2 & 57.3721494009866 & -5.1721494009866 \tabularnewline
32 & 61.2 & 61.5321494009866 & -0.332149400986602 \tabularnewline
33 & 82.4 & 84.8899753347428 & -2.48997533474276 \tabularnewline
34 & 85.4 & 84.5399753347428 & 0.860024665257242 \tabularnewline
35 & 78.2 & 79.3649753347428 & -1.16497533474276 \tabularnewline
36 & 70.2 & 71.6171952078929 & -1.41719520789288 \tabularnewline
37 & 70.2 & 68.5265398167724 & 1.67346018322757 \tabularnewline
38 & 69.3 & 71.0465398167724 & -1.74653981677238 \tabularnewline
39 & 77.5 & 79.7665398167724 & -2.26653981677237 \tabularnewline
40 & 66.1 & 73.5465398167724 & -7.44653981677238 \tabularnewline
41 & 69 & 72.0465398167724 & -3.04653981677237 \tabularnewline
42 & 79.2 & 81.3865398167724 & -2.18653981677237 \tabularnewline
43 & 56.2 & 55.5065398167724 & 0.693460183227629 \tabularnewline
44 & 63.3 & 59.6665398167724 & 3.63346018322763 \tabularnewline
45 & 77.8 & 83.0243657505285 & -5.22436575052854 \tabularnewline
46 & 92 & 82.6743657505285 & 9.32563424947146 \tabularnewline
47 & 78.1 & 77.4993657505285 & 0.600634249471457 \tabularnewline
48 & 65.1 & 70.4819591261452 & -5.38195912614517 \tabularnewline
49 & 71.1 & 67.3913037350247 & 3.70869626497528 \tabularnewline
50 & 70.9 & 69.9113037350247 & 0.98869626497535 \tabularnewline
51 & 72 & 78.6313037350247 & -6.63130373502465 \tabularnewline
52 & 81.9 & 72.4113037350246 & 9.48869626497535 \tabularnewline
53 & 70.6 & 70.9113037350246 & -0.311303735024657 \tabularnewline
54 & 72.5 & 80.2513037350246 & -7.75130373502465 \tabularnewline
55 & 65.1 & 54.3713037350247 & 10.7286962649753 \tabularnewline
56 & 61.1 & 58.5313037350247 & 2.56869626497535 \tabularnewline
\hline
\end{tabular}
%Source: https://freestatistics.org/blog/index.php?pk=25177&T=4

[TABLE]
[ROW][C]Multiple Linear Regression - Actuals, Interpolation, and Residuals[/C][/ROW]
[ROW][C]Time or Index[/C][C]Actuals[/C][C]InterpolationForecast[/C][C]ResidualsPrediction Error[/C][/ROW]
[ROW][C]1[/C][C]71.7[/C][C]72.6626215644818[/C][C]-0.962621564481767[/C][/ROW]
[ROW][C]2[/C][C]77.5[/C][C]75.182621564482[/C][C]2.31737843551796[/C][/ROW]
[ROW][C]3[/C][C]89.8[/C][C]83.902621564482[/C][C]5.89737843551795[/C][/ROW]
[ROW][C]4[/C][C]80.3[/C][C]77.682621564482[/C][C]2.61737843551795[/C][/ROW]
[ROW][C]5[/C][C]78.7[/C][C]76.182621564482[/C][C]2.51737843551795[/C][/ROW]
[ROW][C]6[/C][C]93.8[/C][C]85.522621564482[/C][C]8.27737843551794[/C][/ROW]
[ROW][C]7[/C][C]57.6[/C][C]59.642621564482[/C][C]-2.04262156448204[/C][/ROW]
[ROW][C]8[/C][C]60.6[/C][C]63.802621564482[/C][C]-3.20262156448205[/C][/ROW]
[ROW][C]9[/C][C]91[/C][C]87.1604474982382[/C][C]3.83955250176179[/C][/ROW]
[ROW][C]10[/C][C]85.3[/C][C]86.8104474982382[/C][C]-1.51044749823822[/C][/ROW]
[ROW][C]11[/C][C]77.4[/C][C]81.6354474982382[/C][C]-4.23544749823821[/C][/ROW]
[ROW][C]12[/C][C]77.3[/C][C]74.6180408738548[/C][C]2.68195912614516[/C][/ROW]
[ROW][C]13[/C][C]68.3[/C][C]71.5273854827344[/C][C]-3.22738548273439[/C][/ROW]
[ROW][C]14[/C][C]69.9[/C][C]74.0473854827343[/C][C]-4.14738548273432[/C][/ROW]
[ROW][C]15[/C][C]81.7[/C][C]82.7673854827343[/C][C]-1.06738548273432[/C][/ROW]
[ROW][C]16[/C][C]75.1[/C][C]76.5473854827343[/C][C]-1.44738548273433[/C][/ROW]
[ROW][C]17[/C][C]69.9[/C][C]75.0473854827343[/C][C]-5.14738548273432[/C][/ROW]
[ROW][C]18[/C][C]84[/C][C]84.3873854827343[/C][C]-0.387385482734322[/C][/ROW]
[ROW][C]19[/C][C]54.3[/C][C]58.5073854827343[/C][C]-4.20738548273433[/C][/ROW]
[ROW][C]20[/C][C]60[/C][C]62.6673854827343[/C][C]-2.66738548273433[/C][/ROW]
[ROW][C]21[/C][C]89.9[/C][C]86.0252114164905[/C][C]3.87478858350952[/C][/ROW]
[ROW][C]22[/C][C]77[/C][C]85.6752114164905[/C][C]-8.67521141649049[/C][/ROW]
[ROW][C]23[/C][C]85.3[/C][C]80.5002114164905[/C][C]4.79978858350951[/C][/ROW]
[ROW][C]24[/C][C]77.6[/C][C]73.4828047921071[/C][C]4.11719520789288[/C][/ROW]
[ROW][C]25[/C][C]69.2[/C][C]70.3921494009867[/C][C]-1.19214940098667[/C][/ROW]
[ROW][C]26[/C][C]75.5[/C][C]72.9121494009866[/C][C]2.58785059901339[/C][/ROW]
[ROW][C]27[/C][C]85.7[/C][C]81.6321494009866[/C][C]4.0678505990134[/C][/ROW]
[ROW][C]28[/C][C]72.2[/C][C]75.4121494009866[/C][C]-3.2121494009866[/C][/ROW]
[ROW][C]29[/C][C]79.9[/C][C]73.9121494009866[/C][C]5.9878505990134[/C][/ROW]
[ROW][C]30[/C][C]85.3[/C][C]83.2521494009866[/C][C]2.04785059901340[/C][/ROW]
[ROW][C]31[/C][C]52.2[/C][C]57.3721494009866[/C][C]-5.1721494009866[/C][/ROW]
[ROW][C]32[/C][C]61.2[/C][C]61.5321494009866[/C][C]-0.332149400986602[/C][/ROW]
[ROW][C]33[/C][C]82.4[/C][C]84.8899753347428[/C][C]-2.48997533474276[/C][/ROW]
[ROW][C]34[/C][C]85.4[/C][C]84.5399753347428[/C][C]0.860024665257242[/C][/ROW]
[ROW][C]35[/C][C]78.2[/C][C]79.3649753347428[/C][C]-1.16497533474276[/C][/ROW]
[ROW][C]36[/C][C]70.2[/C][C]71.6171952078929[/C][C]-1.41719520789288[/C][/ROW]
[ROW][C]37[/C][C]70.2[/C][C]68.5265398167724[/C][C]1.67346018322757[/C][/ROW]
[ROW][C]38[/C][C]69.3[/C][C]71.0465398167724[/C][C]-1.74653981677238[/C][/ROW]
[ROW][C]39[/C][C]77.5[/C][C]79.7665398167724[/C][C]-2.26653981677237[/C][/ROW]
[ROW][C]40[/C][C]66.1[/C][C]73.5465398167724[/C][C]-7.44653981677238[/C][/ROW]
[ROW][C]41[/C][C]69[/C][C]72.0465398167724[/C][C]-3.04653981677237[/C][/ROW]
[ROW][C]42[/C][C]79.2[/C][C]81.3865398167724[/C][C]-2.18653981677237[/C][/ROW]
[ROW][C]43[/C][C]56.2[/C][C]55.5065398167724[/C][C]0.693460183227629[/C][/ROW]
[ROW][C]44[/C][C]63.3[/C][C]59.6665398167724[/C][C]3.63346018322763[/C][/ROW]
[ROW][C]45[/C][C]77.8[/C][C]83.0243657505285[/C][C]-5.22436575052854[/C][/ROW]
[ROW][C]46[/C][C]92[/C][C]82.6743657505285[/C][C]9.32563424947146[/C][/ROW]
[ROW][C]47[/C][C]78.1[/C][C]77.4993657505285[/C][C]0.600634249471457[/C][/ROW]
[ROW][C]48[/C][C]65.1[/C][C]70.4819591261452[/C][C]-5.38195912614517[/C][/ROW]
[ROW][C]49[/C][C]71.1[/C][C]67.3913037350247[/C][C]3.70869626497528[/C][/ROW]
[ROW][C]50[/C][C]70.9[/C][C]69.9113037350247[/C][C]0.98869626497535[/C][/ROW]
[ROW][C]51[/C][C]72[/C][C]78.6313037350247[/C][C]-6.63130373502465[/C][/ROW]
[ROW][C]52[/C][C]81.9[/C][C]72.4113037350246[/C][C]9.48869626497535[/C][/ROW]
[ROW][C]53[/C][C]70.6[/C][C]70.9113037350246[/C][C]-0.311303735024657[/C][/ROW]
[ROW][C]54[/C][C]72.5[/C][C]80.2513037350246[/C][C]-7.75130373502465[/C][/ROW]
[ROW][C]55[/C][C]65.1[/C][C]54.3713037350247[/C][C]10.7286962649753[/C][/ROW]
[ROW][C]56[/C][C]61.1[/C][C]58.5313037350247[/C][C]2.56869626497535[/C][/ROW]
[/TABLE]
Source: https://freestatistics.org/blog/index.php?pk=25177&T=4

Globally Unique Identifier (entire table): ba.freestatistics.org/blog/index.php?pk=25177&T=4

As an alternative you can also use a QR Code:  

The GUIDs for individual cells are displayed in the table below:

Multiple Linear Regression - Actuals, Interpolation, and Residuals
Time or IndexActualsInterpolationForecastResidualsPrediction Error
171.772.6626215644818-0.962621564481767
277.575.1826215644822.31737843551796
389.883.9026215644825.89737843551795
480.377.6826215644822.61737843551795
578.776.1826215644822.51737843551795
693.885.5226215644828.27737843551794
757.659.642621564482-2.04262156448204
860.663.802621564482-3.20262156448205
99187.16044749823823.83955250176179
1085.386.8104474982382-1.51044749823822
1177.481.6354474982382-4.23544749823821
1277.374.61804087385482.68195912614516
1368.371.5273854827344-3.22738548273439
1469.974.0473854827343-4.14738548273432
1581.782.7673854827343-1.06738548273432
1675.176.5473854827343-1.44738548273433
1769.975.0473854827343-5.14738548273432
188484.3873854827343-0.387385482734322
1954.358.5073854827343-4.20738548273433
206062.6673854827343-2.66738548273433
2189.986.02521141649053.87478858350952
227785.6752114164905-8.67521141649049
2385.380.50021141649054.79978858350951
2477.673.48280479210714.11719520789288
2569.270.3921494009867-1.19214940098667
2675.572.91214940098662.58785059901339
2785.781.63214940098664.0678505990134
2872.275.4121494009866-3.2121494009866
2979.973.91214940098665.9878505990134
3085.383.25214940098662.04785059901340
3152.257.3721494009866-5.1721494009866
3261.261.5321494009866-0.332149400986602
3382.484.8899753347428-2.48997533474276
3485.484.53997533474280.860024665257242
3578.279.3649753347428-1.16497533474276
3670.271.6171952078929-1.41719520789288
3770.268.52653981677241.67346018322757
3869.371.0465398167724-1.74653981677238
3977.579.7665398167724-2.26653981677237
4066.173.5465398167724-7.44653981677238
416972.0465398167724-3.04653981677237
4279.281.3865398167724-2.18653981677237
4356.255.50653981677240.693460183227629
4463.359.66653981677243.63346018322763
4577.883.0243657505285-5.22436575052854
469282.67436575052859.32563424947146
4778.177.49936575052850.600634249471457
4865.170.4819591261452-5.38195912614517
4971.167.39130373502473.70869626497528
5070.969.91130373502470.98869626497535
517278.6313037350247-6.63130373502465
5281.972.41130373502469.48869626497535
5370.670.9113037350246-0.311303735024657
5472.580.2513037350246-7.75130373502465
5565.154.371303735024710.7286962649753
5661.158.53130373502472.56869626497535


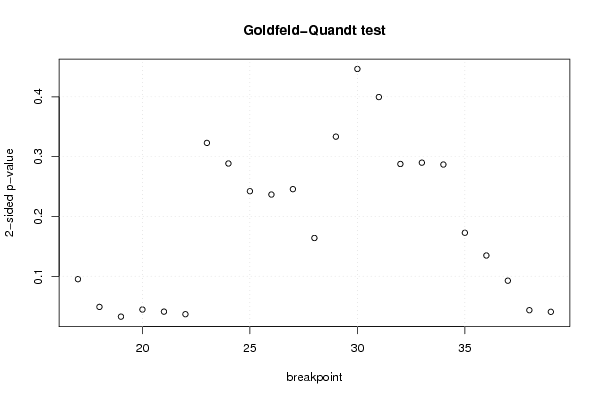
Goldfeld-Quandt test for Heteroskedasticity
p-valuesAlternative Hypothesis
breakpoint indexgreater2-sidedless
170.04758367601790940.09516735203581890.95241632398209
180.02438493509888380.04876987019776750.975615064901116
190.01623629783378450.03247259566756910.983763702166215
200.02218439812289450.04436879624578910.977815601877105
210.02042441322961920.04084882645923840.97957558677038
220.01827668417642700.03655336835285390.981723315823573
230.1615004444019260.3230008888038530.838499555598074
240.1442784293963630.2885568587927250.855721570603638
250.1211221224207030.2422442448414060.878877877579297
260.1183253987695860.2366507975391710.881674601230414
270.1228309000595730.2456618001191470.877169099940426
280.08199016215789630.1639803243157930.918009837842104
290.1667307964887180.3334615929774370.833269203511282
300.2233395531719870.4466791063439740.776660446828013
310.1998364465250870.3996728930501750.800163553474913
320.1438812162767840.2877624325535680.856118783723216
330.1449810438566150.289962087713230.855018956143385
340.1434124588422670.2868249176845340.856587541157733
350.08635988026840420.1727197605368080.913640119731596
360.06736254276465340.1347250855293070.932637457235347
370.04630477157239760.09260954314479520.953695228427602
380.02163740660116360.04327481320232710.978362593398836
390.02028400602103550.04056801204207090.979715993978965

\begin{tabular}{lllllllll}
\hline
Goldfeld-Quandt test for Heteroskedasticity \tabularnewline
p-values & Alternative Hypothesis \tabularnewline
breakpoint index & greater & 2-sided & less \tabularnewline
17 & 0.0475836760179094 & 0.0951673520358189 & 0.95241632398209 \tabularnewline
18 & 0.0243849350988838 & 0.0487698701977675 & 0.975615064901116 \tabularnewline
19 & 0.0162362978337845 & 0.0324725956675691 & 0.983763702166215 \tabularnewline
20 & 0.0221843981228945 & 0.0443687962457891 & 0.977815601877105 \tabularnewline
21 & 0.0204244132296192 & 0.0408488264592384 & 0.97957558677038 \tabularnewline
22 & 0.0182766841764270 & 0.0365533683528539 & 0.981723315823573 \tabularnewline
23 & 0.161500444401926 & 0.323000888803853 & 0.838499555598074 \tabularnewline
24 & 0.144278429396363 & 0.288556858792725 & 0.855721570603638 \tabularnewline
25 & 0.121122122420703 & 0.242244244841406 & 0.878877877579297 \tabularnewline
26 & 0.118325398769586 & 0.236650797539171 & 0.881674601230414 \tabularnewline
27 & 0.122830900059573 & 0.245661800119147 & 0.877169099940426 \tabularnewline
28 & 0.0819901621578963 & 0.163980324315793 & 0.918009837842104 \tabularnewline
29 & 0.166730796488718 & 0.333461592977437 & 0.833269203511282 \tabularnewline
30 & 0.223339553171987 & 0.446679106343974 & 0.776660446828013 \tabularnewline
31 & 0.199836446525087 & 0.399672893050175 & 0.800163553474913 \tabularnewline
32 & 0.143881216276784 & 0.287762432553568 & 0.856118783723216 \tabularnewline
33 & 0.144981043856615 & 0.28996208771323 & 0.855018956143385 \tabularnewline
34 & 0.143412458842267 & 0.286824917684534 & 0.856587541157733 \tabularnewline
35 & 0.0863598802684042 & 0.172719760536808 & 0.913640119731596 \tabularnewline
36 & 0.0673625427646534 & 0.134725085529307 & 0.932637457235347 \tabularnewline
37 & 0.0463047715723976 & 0.0926095431447952 & 0.953695228427602 \tabularnewline
38 & 0.0216374066011636 & 0.0432748132023271 & 0.978362593398836 \tabularnewline
39 & 0.0202840060210355 & 0.0405680120420709 & 0.979715993978965 \tabularnewline
\hline
\end{tabular}
%Source: https://freestatistics.org/blog/index.php?pk=25177&T=5

[TABLE]
[ROW][C]Goldfeld-Quandt test for Heteroskedasticity[/C][/ROW]
[ROW][C]p-values[/C][C]Alternative Hypothesis[/C][/ROW]
[ROW][C]breakpoint index[/C][C]greater[/C][C]2-sided[/C][C]less[/C][/ROW]
[ROW][C]17[/C][C]0.0475836760179094[/C][C]0.0951673520358189[/C][C]0.95241632398209[/C][/ROW]
[ROW][C]18[/C][C]0.0243849350988838[/C][C]0.0487698701977675[/C][C]0.975615064901116[/C][/ROW]
[ROW][C]19[/C][C]0.0162362978337845[/C][C]0.0324725956675691[/C][C]0.983763702166215[/C][/ROW]
[ROW][C]20[/C][C]0.0221843981228945[/C][C]0.0443687962457891[/C][C]0.977815601877105[/C][/ROW]
[ROW][C]21[/C][C]0.0204244132296192[/C][C]0.0408488264592384[/C][C]0.97957558677038[/C][/ROW]
[ROW][C]22[/C][C]0.0182766841764270[/C][C]0.0365533683528539[/C][C]0.981723315823573[/C][/ROW]
[ROW][C]23[/C][C]0.161500444401926[/C][C]0.323000888803853[/C][C]0.838499555598074[/C][/ROW]
[ROW][C]24[/C][C]0.144278429396363[/C][C]0.288556858792725[/C][C]0.855721570603638[/C][/ROW]
[ROW][C]25[/C][C]0.121122122420703[/C][C]0.242244244841406[/C][C]0.878877877579297[/C][/ROW]
[ROW][C]26[/C][C]0.118325398769586[/C][C]0.236650797539171[/C][C]0.881674601230414[/C][/ROW]
[ROW][C]27[/C][C]0.122830900059573[/C][C]0.245661800119147[/C][C]0.877169099940426[/C][/ROW]
[ROW][C]28[/C][C]0.0819901621578963[/C][C]0.163980324315793[/C][C]0.918009837842104[/C][/ROW]
[ROW][C]29[/C][C]0.166730796488718[/C][C]0.333461592977437[/C][C]0.833269203511282[/C][/ROW]
[ROW][C]30[/C][C]0.223339553171987[/C][C]0.446679106343974[/C][C]0.776660446828013[/C][/ROW]
[ROW][C]31[/C][C]0.199836446525087[/C][C]0.399672893050175[/C][C]0.800163553474913[/C][/ROW]
[ROW][C]32[/C][C]0.143881216276784[/C][C]0.287762432553568[/C][C]0.856118783723216[/C][/ROW]
[ROW][C]33[/C][C]0.144981043856615[/C][C]0.28996208771323[/C][C]0.855018956143385[/C][/ROW]
[ROW][C]34[/C][C]0.143412458842267[/C][C]0.286824917684534[/C][C]0.856587541157733[/C][/ROW]
[ROW][C]35[/C][C]0.0863598802684042[/C][C]0.172719760536808[/C][C]0.913640119731596[/C][/ROW]
[ROW][C]36[/C][C]0.0673625427646534[/C][C]0.134725085529307[/C][C]0.932637457235347[/C][/ROW]
[ROW][C]37[/C][C]0.0463047715723976[/C][C]0.0926095431447952[/C][C]0.953695228427602[/C][/ROW]
[ROW][C]38[/C][C]0.0216374066011636[/C][C]0.0432748132023271[/C][C]0.978362593398836[/C][/ROW]
[ROW][C]39[/C][C]0.0202840060210355[/C][C]0.0405680120420709[/C][C]0.979715993978965[/C][/ROW]
[/TABLE]
Source: https://freestatistics.org/blog/index.php?pk=25177&T=5

Globally Unique Identifier (entire table): ba.freestatistics.org/blog/index.php?pk=25177&T=5

As an alternative you can also use a QR Code:  

The GUIDs for individual cells are displayed in the table below:

Goldfeld-Quandt test for Heteroskedasticity
p-valuesAlternative Hypothesis
breakpoint indexgreater2-sidedless
170.04758367601790940.09516735203581890.95241632398209
180.02438493509888380.04876987019776750.975615064901116
190.01623629783378450.03247259566756910.983763702166215
200.02218439812289450.04436879624578910.977815601877105
210.02042441322961920.04084882645923840.97957558677038
220.01827668417642700.03655336835285390.981723315823573
230.1615004444019260.3230008888038530.838499555598074
240.1442784293963630.2885568587927250.855721570603638
250.1211221224207030.2422442448414060.878877877579297
260.1183253987695860.2366507975391710.881674601230414
270.1228309000595730.2456618001191470.877169099940426
280.08199016215789630.1639803243157930.918009837842104
290.1667307964887180.3334615929774370.833269203511282
300.2233395531719870.4466791063439740.776660446828013
310.1998364465250870.3996728930501750.800163553474913
320.1438812162767840.2877624325535680.856118783723216
330.1449810438566150.289962087713230.855018956143385
340.1434124588422670.2868249176845340.856587541157733
350.08635988026840420.1727197605368080.913640119731596
360.06736254276465340.1347250855293070.932637457235347
370.04630477157239760.09260954314479520.953695228427602
380.02163740660116360.04327481320232710.978362593398836
390.02028400602103550.04056801204207090.979715993978965


Meta Analysis of Goldfeld-Quandt test for Heteroskedasticity
Description# significant tests% significant testsOK/NOK
1% type I error level00OK
5% type I error level70.304347826086957NOK
10% type I error level90.391304347826087NOK

\begin{tabular}{lllllllll}
\hline
Meta Analysis of Goldfeld-Quandt test for Heteroskedasticity \tabularnewline
Description & # significant tests & % significant tests & OK/NOK \tabularnewline
1% type I error level & 0 & 0 & OK \tabularnewline
5% type I error level & 7 & 0.304347826086957 & NOK \tabularnewline
10% type I error level & 9 & 0.391304347826087 & NOK \tabularnewline
\hline
\end{tabular}
%Source: https://freestatistics.org/blog/index.php?pk=25177&T=6

[TABLE]
[ROW][C]Meta Analysis of Goldfeld-Quandt test for Heteroskedasticity[/C][/ROW]
[ROW][C]Description[/C][C]# significant tests[/C][C]% significant tests[/C][C]OK/NOK[/C][/ROW]
[ROW][C]1% type I error level[/C][C]0[/C][C]0[/C][C]OK[/C][/ROW]
[ROW][C]5% type I error level[/C][C]7[/C][C]0.304347826086957[/C][C]NOK[/C][/ROW]
[ROW][C]10% type I error level[/C][C]9[/C][C]0.391304347826087[/C][C]NOK[/C][/ROW]
[/TABLE]
Source: https://freestatistics.org/blog/index.php?pk=25177&T=6

Globally Unique Identifier (entire table): ba.freestatistics.org/blog/index.php?pk=25177&T=6

As an alternative you can also use a QR Code:  

The GUIDs for individual cells are displayed in the table below:

Meta Analysis of Goldfeld-Quandt test for Heteroskedasticity
Description# significant tests% significant testsOK/NOK
1% type I error level00OK
5% type I error level70.304347826086957NOK
10% type I error level90.391304347826087NOK


Parameters (Session):
par1 = 1 ; par2 = Include Monthly Dummies ; par3 = Linear Trend ;
Parameters (R input):
par1 = 1 ; par2 = Include Monthly Dummies ; par3 = Linear Trend ;
R code (references can be found in the software module):
library(lattice)
library(lmtest)
n25 <- 25 #minimum number of obs. for Goldfeld-Quandt test
par1 <- as.numeric(par1)
x <- t(y)
k <- length(x[1,])
n <- length(x[,1])
x1 <- cbind(x[,par1], x[,1:k!=par1])
mycolnames <- c(colnames(x)[par1], colnames(x)[1:k!=par1])
colnames(x1) <- mycolnames #colnames(x)[par1]
x <- x1
if (par3 == 'First Differences'){
x2 <- array(0, dim=c(n-1,k), dimnames=list(1:(n-1), paste('(1-B)',colnames(x),sep='')))
for (i in 1:n-1) {
for (j in 1:k) {
x2[i,j] <- x[i+1,j] - x[i,j]
}
}
x <- x2
}
if (par2 == 'Include Monthly Dummies'){
x2 <- array(0, dim=c(n,11), dimnames=list(1:n, paste('M', seq(1:11), sep ='')))
for (i in 1:11){
x2[seq(i,n,12),i] <- 1
}
x <- cbind(x, x2)
}
if (par2 == 'Include Quarterly Dummies'){
x2 <- array(0, dim=c(n,3), dimnames=list(1:n, paste('Q', seq(1:3), sep ='')))
for (i in 1:3){
x2[seq(i,n,4),i] <- 1
}
x <- cbind(x, x2)
}
k <- length(x[1,])
if (par3 == 'Linear Trend'){
x <- cbind(x, c(1:n))
colnames(x)[k+1] <- 't'
}
x
k <- length(x[1,])
df <- as.data.frame(x)
(mylm <- lm(df))
(mysum <- summary(mylm))
if (n > n25) {
kp3 <- k + 3
nmkm3 <- n - k - 3
gqarr <- array(NA, dim=c(nmkm3-kp3+1,3))
numgqtests <- 0
numsignificant1 <- 0
numsignificant5 <- 0
numsignificant10 <- 0
for (mypoint in kp3:nmkm3) {
j <- 0
numgqtests <- numgqtests + 1
for (myalt in c('greater', 'two.sided', 'less')) {
j <- j + 1
gqarr[mypoint-kp3+1,j] <- gqtest(mylm, point=mypoint, alternative=myalt)$p.value
}
if (gqarr[mypoint-kp3+1,2] < 0.01) numsignificant1 <- numsignificant1 + 1
if (gqarr[mypoint-kp3+1,2] < 0.05) numsignificant5 <- numsignificant5 + 1
if (gqarr[mypoint-kp3+1,2] < 0.10) numsignificant10 <- numsignificant10 + 1
}
gqarr
}
bitmap(file='test0.png')
plot(x[,1], type='l', main='Actuals and Interpolation', ylab='value of Actuals and Interpolation (dots)', xlab='time or index')
points(x[,1]-mysum$resid)
grid()
dev.off()
bitmap(file='test1.png')
plot(mysum$resid, type='b', pch=19, main='Residuals', ylab='value of Residuals', xlab='time or index')
grid()
dev.off()
bitmap(file='test2.png')
hist(mysum$resid, main='Residual Histogram', xlab='values of Residuals')
grid()
dev.off()
bitmap(file='test3.png')
densityplot(~mysum$resid,col='black',main='Residual Density Plot', xlab='values of Residuals')
dev.off()
bitmap(file='test4.png')
qqnorm(mysum$resid, main='Residual Normal Q-Q Plot')
qqline(mysum$resid)
grid()
dev.off()
(myerror <- as.ts(mysum$resid))
bitmap(file='test5.png')
dum <- cbind(lag(myerror,k=1),myerror)
dum
dum1 <- dum[2:length(myerror),]
dum1
z <- as.data.frame(dum1)
z
plot(z,main=paste('Residual Lag plot, lowess, and regression line'), ylab='values of Residuals', xlab='lagged values of Residuals')
lines(lowess(z))
abline(lm(z))
grid()
dev.off()
bitmap(file='test6.png')
acf(mysum$resid, lag.max=length(mysum$resid)/2, main='Residual Autocorrelation Function')
grid()
dev.off()
bitmap(file='test7.png')
pacf(mysum$resid, lag.max=length(mysum$resid)/2, main='Residual Partial Autocorrelation Function')
grid()
dev.off()
bitmap(file='test8.png')
opar <- par(mfrow = c(2,2), oma = c(0, 0, 1.1, 0))
plot(mylm, las = 1, sub='Residual Diagnostics')
par(opar)
dev.off()
if (n > n25) {
bitmap(file='test9.png')
plot(kp3:nmkm3,gqarr[,2], main='Goldfeld-Quandt test',ylab='2-sided p-value',xlab='breakpoint')
grid()
dev.off()
}
load(file='createtable')
a<-table.start()
a<-table.row.start(a)
a<-table.element(a, 'Multiple Linear Regression - Estimated Regression Equation', 1, TRUE)
a<-table.row.end(a)
myeq <- colnames(x)[1]
myeq <- paste(myeq, '[t] = ', sep='')
for (i in 1:k){
if (mysum$coefficients[i,1] > 0) myeq <- paste(myeq, '+', '')
myeq <- paste(myeq, mysum$coefficients[i,1], sep=' ')
if (rownames(mysum$coefficients)[i] != '(Intercept)') {
myeq <- paste(myeq, rownames(mysum$coefficients)[i], sep='')
if (rownames(mysum$coefficients)[i] != 't') myeq <- paste(myeq, '[t]', sep='')
}
}
myeq <- paste(myeq, ' + e[t]')
a<-table.row.start(a)
a<-table.element(a, myeq)
a<-table.row.end(a)
a<-table.end(a)
table.save(a,file='mytable1.tab')
a<-table.start()
a<-table.row.start(a)
a<-table.element(a,hyperlink('ols1.htm','Multiple Linear Regression - Ordinary Least Squares',''), 6, TRUE)
a<-table.row.end(a)
a<-table.row.start(a)
a<-table.element(a,'Variable',header=TRUE)
a<-table.element(a,'Parameter',header=TRUE)
a<-table.element(a,'S.D.',header=TRUE)
a<-table.element(a,'T-STAT
H0: parameter = 0',header=TRUE)
a<-table.element(a,'2-tail p-value',header=TRUE)
a<-table.element(a,'1-tail p-value',header=TRUE)
a<-table.row.end(a)
for (i in 1:k){
a<-table.row.start(a)
a<-table.element(a,rownames(mysum$coefficients)[i],header=TRUE)
a<-table.element(a,mysum$coefficients[i,1])
a<-table.element(a, round(mysum$coefficients[i,2],6))
a<-table.element(a, round(mysum$coefficients[i,3],4))
a<-table.element(a, round(mysum$coefficients[i,4],6))
a<-table.element(a, round(mysum$coefficients[i,4]/2,6))
a<-table.row.end(a)
}
a<-table.end(a)
table.save(a,file='mytable2.tab')
a<-table.start()
a<-table.row.start(a)
a<-table.element(a, 'Multiple Linear Regression - Regression Statistics', 2, TRUE)
a<-table.row.end(a)
a<-table.row.start(a)
a<-table.element(a, 'Multiple R',1,TRUE)
a<-table.element(a, sqrt(mysum$r.squared))
a<-table.row.end(a)
a<-table.row.start(a)
a<-table.element(a, 'R-squared',1,TRUE)
a<-table.element(a, mysum$r.squared)
a<-table.row.end(a)
a<-table.row.start(a)
a<-table.element(a, 'Adjusted R-squared',1,TRUE)
a<-table.element(a, mysum$adj.r.squared)
a<-table.row.end(a)
a<-table.row.start(a)
a<-table.element(a, 'F-TEST (value)',1,TRUE)
a<-table.element(a, mysum$fstatistic[1])
a<-table.row.end(a)
a<-table.row.start(a)
a<-table.element(a, 'F-TEST (DF numerator)',1,TRUE)
a<-table.element(a, mysum$fstatistic[2])
a<-table.row.end(a)
a<-table.row.start(a)
a<-table.element(a, 'F-TEST (DF denominator)',1,TRUE)
a<-table.element(a, mysum$fstatistic[3])
a<-table.row.end(a)
a<-table.row.start(a)
a<-table.element(a, 'p-value',1,TRUE)
a<-table.element(a, 1-pf(mysum$fstatistic[1],mysum$fstatistic[2],mysum$fstatistic[3]))
a<-table.row.end(a)
a<-table.row.start(a)
a<-table.element(a, 'Multiple Linear Regression - Residual Statistics', 2, TRUE)
a<-table.row.end(a)
a<-table.row.start(a)
a<-table.element(a, 'Residual Standard Deviation',1,TRUE)
a<-table.element(a, mysum$sigma)
a<-table.row.end(a)
a<-table.row.start(a)
a<-table.element(a, 'Sum Squared Residuals',1,TRUE)
a<-table.element(a, sum(myerror*myerror))
a<-table.row.end(a)
a<-table.end(a)
table.save(a,file='mytable3.tab')
a<-table.start()
a<-table.row.start(a)
a<-table.element(a, 'Multiple Linear Regression - Actuals, Interpolation, and Residuals', 4, TRUE)
a<-table.row.end(a)
a<-table.row.start(a)
a<-table.element(a, 'Time or Index', 1, TRUE)
a<-table.element(a, 'Actuals', 1, TRUE)
a<-table.element(a, 'Interpolation
Forecast', 1, TRUE)
a<-table.element(a, 'Residuals
Prediction Error', 1, TRUE)
a<-table.row.end(a)
for (i in 1:n) {
a<-table.row.start(a)
a<-table.element(a,i, 1, TRUE)
a<-table.element(a,x[i])
a<-table.element(a,x[i]-mysum$resid[i])
a<-table.element(a,mysum$resid[i])
a<-table.row.end(a)
}
a<-table.end(a)
table.save(a,file='mytable4.tab')
if (n > n25) {
a<-table.start()
a<-table.row.start(a)
a<-table.element(a,'Goldfeld-Quandt test for Heteroskedasticity',4,TRUE)
a<-table.row.end(a)
a<-table.row.start(a)
a<-table.element(a,'p-values',header=TRUE)
a<-table.element(a,'Alternative Hypothesis',3,header=TRUE)
a<-table.row.end(a)
a<-table.row.start(a)
a<-table.element(a,'breakpoint index',header=TRUE)
a<-table.element(a,'greater',header=TRUE)
a<-table.element(a,'2-sided',header=TRUE)
a<-table.element(a,'less',header=TRUE)
a<-table.row.end(a)
for (mypoint in kp3:nmkm3) {
a<-table.row.start(a)
a<-table.element(a,mypoint,header=TRUE)
a<-table.element(a,gqarr[mypoint-kp3+1,1])
a<-table.element(a,gqarr[mypoint-kp3+1,2])
a<-table.element(a,gqarr[mypoint-kp3+1,3])
a<-table.row.end(a)
}
a<-table.end(a)
table.save(a,file='mytable5.tab')
a<-table.start()
a<-table.row.start(a)
a<-table.element(a,'Meta Analysis of Goldfeld-Quandt test for Heteroskedasticity',4,TRUE)
a<-table.row.end(a)
a<-table.row.start(a)
a<-table.element(a,'Description',header=TRUE)
a<-table.element(a,'# significant tests',header=TRUE)
a<-table.element(a,'% significant tests',header=TRUE)
a<-table.element(a,'OK/NOK',header=TRUE)
a<-table.row.end(a)
a<-table.row.start(a)
a<-table.element(a,'1% type I error level',header=TRUE)
a<-table.element(a,numsignificant1)
a<-table.element(a,numsignificant1/numgqtests)
if (numsignificant1/numgqtests < 0.01) dum <- 'OK' else dum <- 'NOK'
a<-table.element(a,dum)
a<-table.row.end(a)
a<-table.row.start(a)
a<-table.element(a,'5% type I error level',header=TRUE)
a<-table.element(a,numsignificant5)
a<-table.element(a,numsignificant5/numgqtests)
if (numsignificant5/numgqtests < 0.05) dum <- 'OK' else dum <- 'NOK'
a<-table.element(a,dum)
a<-table.row.end(a)
a<-table.row.start(a)
a<-table.element(a,'10% type I error level',header=TRUE)
a<-table.element(a,numsignificant10)
a<-table.element(a,numsignificant10/numgqtests)
if (numsignificant10/numgqtests < 0.1) dum <- 'OK' else dum <- 'NOK'
a<-table.element(a,dum)
a<-table.row.end(a)
a<-table.end(a)
table.save(a,file='mytable6.tab')
}