Free Statistics

of Irreproducible Research!

Author's title

Author*The author of this computation has been verified*
R Software Modulerwasp_multipleregression.wasp
Title produced by softwareMultiple Regression
Date of computationWed, 19 Nov 2008 07:09:36 -0700
Cite this page as followsStatistical Computations at FreeStatistics.org, Office for Research Development and Education, URL https://freestatistics.org/blog/index.php?v=date/2008/Nov/19/t1227104073worzbcthhxcdg34.htm/, Retrieved Sat, 18 May 2024 00:09:43 +0000
Statistical Computations at FreeStatistics.org, Office for Research Development and Education, URL https://freestatistics.org/blog/index.php?pk=25036, Retrieved Sat, 18 May 2024 00:09:43 +0000
QR Codes:

Original text written by user:
IsPrivate?No (this computation is public)
User-defined keywords
Estimated Impact281
Family? (F = Feedback message, R = changed R code, M = changed R Module, P = changed Parameters, D = changed Data)
F     [Multiple Regression] [] [2007-11-19 19:55:31] [b731da8b544846036771bbf9bf2f34ce]
F    D    [Multiple Regression] [Regressiemodel we...] [2008-11-19 14:09:36] [e08fee3874f3333d6b7a377a061b860d] [Current]
-   P       [Multiple Regression] [Paper Hoofdstuk 5...] [2008-12-12 11:53:38] [6fea0e9a9b3b29a63badf2c274e82506]
-   PD        [Multiple Regression] [Paper Hoofdstuk 5...] [2008-12-12 12:04:19] [819b576fab25b35cfda70f80599828ec]
-    D        [Multiple Regression] [Paper Hoofdstuk 5...] [2008-12-12 12:09:09] [819b576fab25b35cfda70f80599828ec]
Feedback Forum
2008-11-29 14:08:57 [Kevin Neelen] [reply
Om onze tijdreeks te kunnen verklaren aan de hand van seasonal dummies en een lineaire trend, hebben we deze computation gemaakt.

Volgens de Adjusted R-square valt 86% van de schommelingen te verklaren volgens dit model. Dit is zeer hoog en tevens significant, aanegzien de P-waarde 0 bedraagt.

Als we de tabel bestuderen, zien we dat de meeste parameters positief zijn, wat wil zeggen dat er in deze maanden een hogere werkloosheid heerst dan in de referentiemaand. Enkele zijn negatief, wat duidt op een lagere werkloosheid.
Bij de nulhypothese is de parameter is 0, wat wil zeggen dat we ervan uitgaan dat de gebeurtenis niet van invloed is op de werkloosheid. We weten niet welke gebeurtenis heeft plaatsgevonden, dus het is beter om een two-sided test te nemen. 8 maanden hebben een p-waarde die hoger ligt dan 5%, wat betekent dat deze wijzigingen in het maandelijkse werkloosheidscijfer waarschijnlijk toe te schrijven zijn aan het toeval.

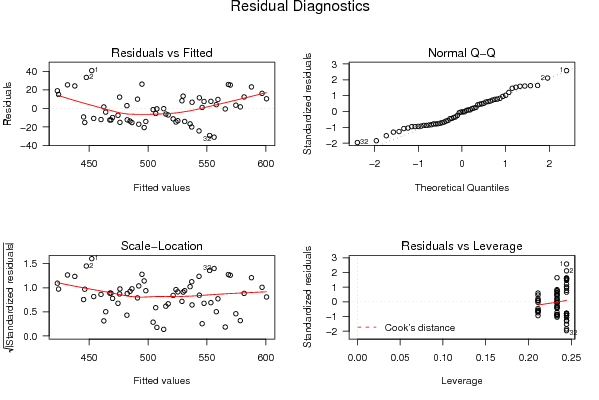
De bijgevoegde grafieken in de computation worden juist beoordeeld.
2008-11-29 14:32:20 [Michael Van Spaandonck] [reply
In dit model is rekening gehouden met seasonal dummies en een lineaire trend

Volgens de Adjusted R-square valt 86% van de schommelingen te verklaren door middel van dit model. Aangezien de p-waarde 0 bedraagt mag gesteld worden dat deze 86% significant verschilt van nulhypothese H0 = 0.

Wanneer we de tabel van de ordinary least squares bekijken zien we dat de meeste parameters (maandwaarden) positief zijn, wat wil zeggen dat er in deze maanden een hogere werkloosheid heerst dan in de referentiemaand. Enkele zijn negatief, wat duidt op een lagere werkloosheid.

Zoals gezegd is de parameter voor de nulhypothese 0, wat wil zeggen dat we ervan uit gaan dat de gebeurtenis vermeld bij vorige berekening (http://www.freestatistics.org/blog/index.php?v=date/2008/Nov/19/t1227103230ac1ejeqlhx03may.htm) niet van invloed is op de werkloosheid.
We weten niet welke gebeurtenis heeft plaatsgevonden, dus het is beter om een two-sided test te nemen. 8 maanden hebben daarbij een p-waarde die hoger ligt dan 5%, wat betekent dat deze wijzigingen in het maandelijkse werkloosheidscijfer waarschijnlijk toe te schrijven zijn aan het toeval.


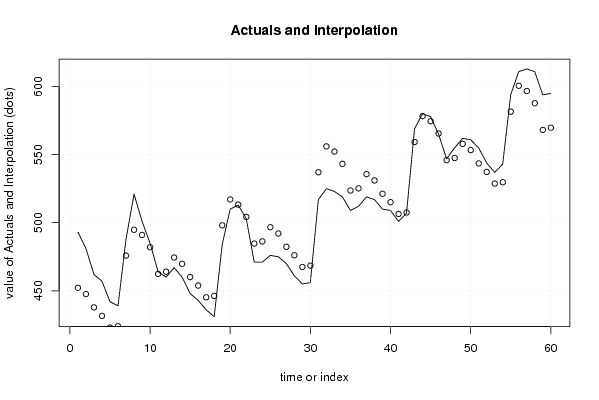
De grafiek van Actuals & Interpolation vertoont een oplopend verloop.
In principe benaderen de voorspellingen (interpolations, de stippen) de actuals (lijn) vrij goed. Alleen in het begin van de grafiek en na het plaatsvinden van de gebeurtenis liggen de interpolations er nogal vrij ver naast. Beide herstellen zich echter vrij snel.

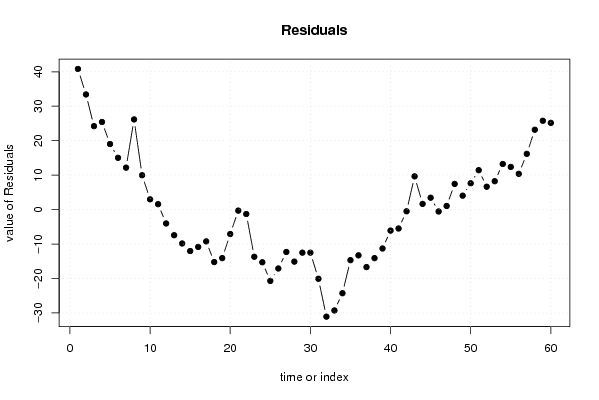
We zien dat het gemiddelde van de residuals niet direct 0 benaderd. Dit betekent in een verdergaande analyse in feite dat er geen fixed variation is.

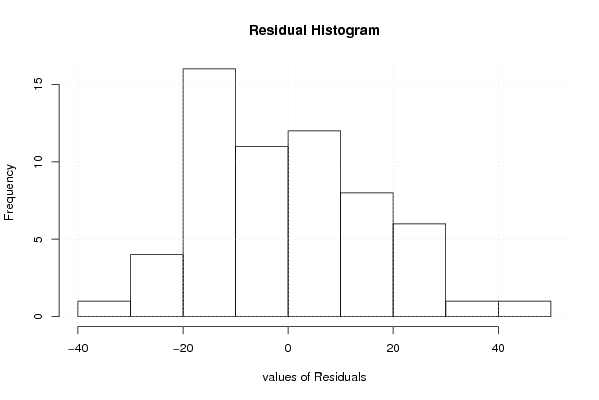
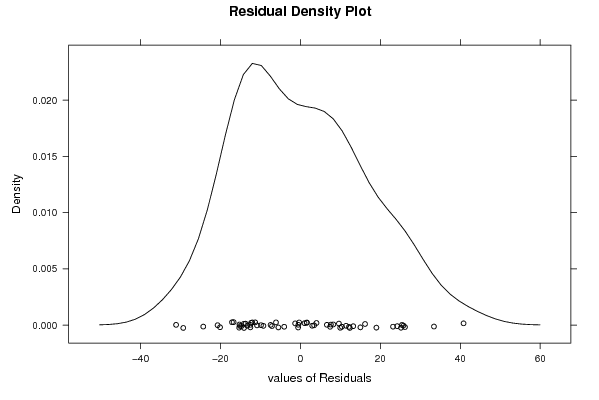
Histogram en density plot geven een helling naar links weer in de verdeling. Dit betekent in een verdergaande analyse in feite dat er geen fixed distribution is.
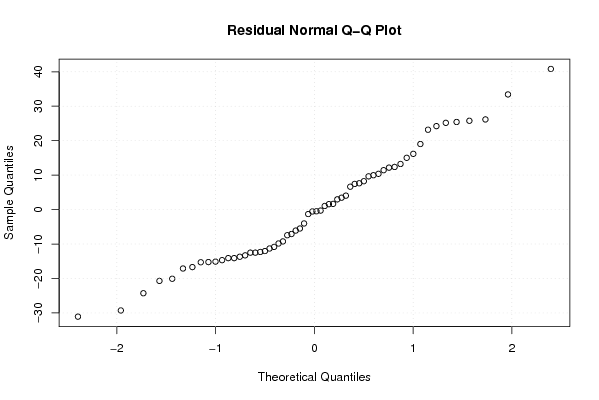
Op het Q-Q plot zien we dat de punten al iets verder van de rechte af liggen dan bij de normaalverdeling. Deze grafiek bevestigt dus de overige twee.

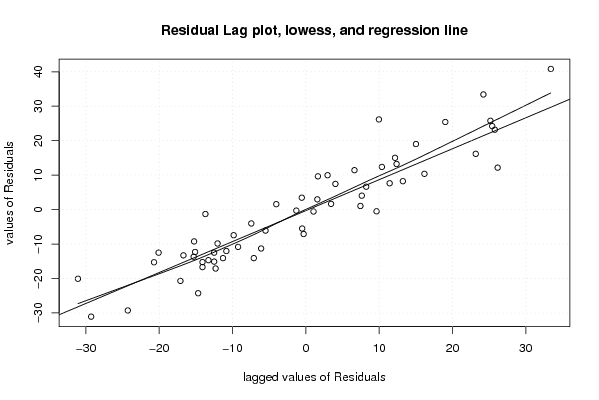
Het residuals lag plot geeft een hoge correlatie weer tussen de voorspellingsfout nu en de voorspellingsfout van de voorgaande maand.

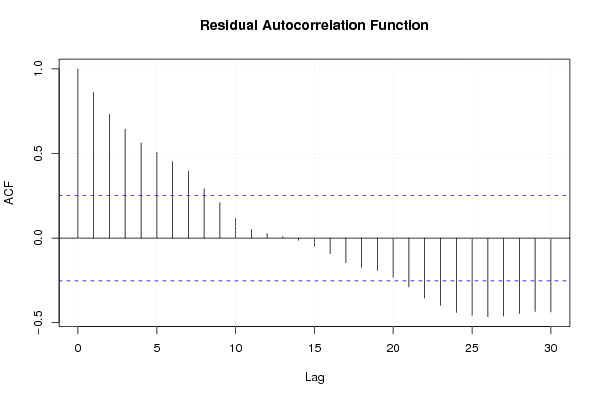
Tot slot de grafiek van de autocorrelatie.
Bij een lag van 12 zien we dat de autocorrelatie binnen het interval valt, en dat er dus van toeval geen sprake is.

In het document wordt tot alle bovenstaande conclusies gekomen.

Post a new message
Dataseries X:
493.000	0
481.000	0
462.000	0
457.000	0
442.000	0
439.000	0
488.000	0
521.000	0
501.000	0
485.000	0
464.000	0
460.000	0
467.000	0
460.000	0
448.000	0
443.000	0
436.000	0
431.000	0
484.000	0
510.000	0
513.000	0
503.000	0
471.000	0
471.000	0
476.000	0
475.000	0
470.000	0
461.000	0
455.000	0
456.000	0
517.000	1
525.000	1
523.000	1
519.000	1
509.000	1
512.000	1
519.000	1
517.000	1
510.000	1
509.000	1
501.000	1
507.000	1
569.000	1
580.000	1
578.000	1
565.000	1
547.000	1
555.000	1
562.000	1
561.000	1
555.000	1
544.000	1
537.000	1
543.000	1
594.000	1
611.000	1
613.000	1
611.000	1
594.000	1
595.000	1


Summary of computational transaction
Raw Inputview raw input (R code)
Raw Outputview raw output of R engine
Computing time3 seconds
R Server'George Udny Yule' @ 72.249.76.132

\begin{tabular}{lllllllll}
\hline
Summary of computational transaction \tabularnewline
Raw Input & view raw input (R code)  \tabularnewline
Raw Output & view raw output of R engine  \tabularnewline
Computing time & 3 seconds \tabularnewline
R Server & 'George Udny Yule' @ 72.249.76.132 \tabularnewline
\hline
\end{tabular}
%Source: https://freestatistics.org/blog/index.php?pk=25036&T=0

[TABLE]
[ROW][C]Summary of computational transaction[/C][/ROW]
[ROW][C]Raw Input[/C][C]view raw input (R code) [/C][/ROW]
[ROW][C]Raw Output[/C][C]view raw output of R engine [/C][/ROW]
[ROW][C]Computing time[/C][C]3 seconds[/C][/ROW]
[ROW][C]R Server[/C][C]'George Udny Yule' @ 72.249.76.132[/C][/ROW]
[/TABLE]
Source: https://freestatistics.org/blog/index.php?pk=25036&T=0

Globally Unique Identifier (entire table): ba.freestatistics.org/blog/index.php?pk=25036&T=0

As an alternative you can also use a QR Code:  

The GUIDs for individual cells are displayed in the table below:

Summary of computational transaction
Raw Inputview raw input (R code)
Raw Outputview raw output of R engine
Computing time3 seconds
R Server'George Udny Yule' @ 72.249.76.132


Multiple Linear Regression - Estimated Regression Equation
y[t] = + 441.766666666666 + 16.7222222222221x[t] + 8.55555555555529M1[t] + 2.10000000000004M2[t] -9.55555555555553M3[t] -17.6111111111111M4[t] -28.0666666666667M5[t] -28.9222222222222M6[t] + 21.0777777777778M7[t] + 38.2222222222223M8[t] + 32.5666666666667M9[t] + 21.7111111111111M10[t] + 0.255555555555560M11[t] + 1.85555555555556t + e[t]

\begin{tabular}{lllllllll}
\hline
Multiple Linear Regression - Estimated Regression Equation \tabularnewline
y[t] =  +  441.766666666666 +  16.7222222222221x[t] +  8.55555555555529M1[t] +  2.10000000000004M2[t] -9.55555555555553M3[t] -17.6111111111111M4[t] -28.0666666666667M5[t] -28.9222222222222M6[t] +  21.0777777777778M7[t] +  38.2222222222223M8[t] +  32.5666666666667M9[t] +  21.7111111111111M10[t] +  0.255555555555560M11[t] +  1.85555555555556t  + e[t] \tabularnewline
\hline
\end{tabular}
%Source: https://freestatistics.org/blog/index.php?pk=25036&T=1

[TABLE]
[ROW][C]Multiple Linear Regression - Estimated Regression Equation[/C][/ROW]
[ROW][C]y[t] =  +  441.766666666666 +  16.7222222222221x[t] +  8.55555555555529M1[t] +  2.10000000000004M2[t] -9.55555555555553M3[t] -17.6111111111111M4[t] -28.0666666666667M5[t] -28.9222222222222M6[t] +  21.0777777777778M7[t] +  38.2222222222223M8[t] +  32.5666666666667M9[t] +  21.7111111111111M10[t] +  0.255555555555560M11[t] +  1.85555555555556t  + e[t][/C][/ROW]
[/TABLE]
Source: https://freestatistics.org/blog/index.php?pk=25036&T=1

Globally Unique Identifier (entire table): ba.freestatistics.org/blog/index.php?pk=25036&T=1

As an alternative you can also use a QR Code:  

The GUIDs for individual cells are displayed in the table below:

Multiple Linear Regression - Estimated Regression Equation
y[t] = + 441.766666666666 + 16.7222222222221x[t] + 8.55555555555529M1[t] + 2.10000000000004M2[t] -9.55555555555553M3[t] -17.6111111111111M4[t] -28.0666666666667M5[t] -28.9222222222222M6[t] + 21.0777777777778M7[t] + 38.2222222222223M8[t] + 32.5666666666667M9[t] + 21.7111111111111M10[t] + 0.255555555555560M11[t] + 1.85555555555556t + e[t]


Multiple Linear Regression - Ordinary Least Squares
VariableParameterS.D.T-STATH0: parameter = 02-tail p-value1-tail p-value
(Intercept)441.7666666666669.98327644.250700
x16.72222222222219.6064121.74070.0884160.044208
M18.5555555555552911.6504560.73440.466460.23323
M22.1000000000000411.6207140.18070.8573880.428694
M3-9.5555555555555311.597529-0.82390.4142310.207115
M4-17.611111111111111.58094-1.52070.135180.06759
M5-28.066666666666711.570975-2.42560.0192640.009632
M6-28.922222222222211.567651-2.50030.0160370.008018
M721.077777777777811.6107841.81540.075990.037995
M838.222222222222311.580943.30040.001870.000935
M932.566666666666711.5576752.81780.0071050.003552
M1021.711111111111111.5410291.88120.0662810.033141
M110.25555555555556011.5310290.02220.9824140.491207
t1.855555555555560.2773136.691200

\begin{tabular}{lllllllll}
\hline
Multiple Linear Regression - Ordinary Least Squares \tabularnewline
Variable & Parameter & S.D. & T-STATH0: parameter = 0 & 2-tail p-value & 1-tail p-value \tabularnewline
(Intercept) & 441.766666666666 & 9.983276 & 44.2507 & 0 & 0 \tabularnewline
x & 16.7222222222221 & 9.606412 & 1.7407 & 0.088416 & 0.044208 \tabularnewline
M1 & 8.55555555555529 & 11.650456 & 0.7344 & 0.46646 & 0.23323 \tabularnewline
M2 & 2.10000000000004 & 11.620714 & 0.1807 & 0.857388 & 0.428694 \tabularnewline
M3 & -9.55555555555553 & 11.597529 & -0.8239 & 0.414231 & 0.207115 \tabularnewline
M4 & -17.6111111111111 & 11.58094 & -1.5207 & 0.13518 & 0.06759 \tabularnewline
M5 & -28.0666666666667 & 11.570975 & -2.4256 & 0.019264 & 0.009632 \tabularnewline
M6 & -28.9222222222222 & 11.567651 & -2.5003 & 0.016037 & 0.008018 \tabularnewline
M7 & 21.0777777777778 & 11.610784 & 1.8154 & 0.07599 & 0.037995 \tabularnewline
M8 & 38.2222222222223 & 11.58094 & 3.3004 & 0.00187 & 0.000935 \tabularnewline
M9 & 32.5666666666667 & 11.557675 & 2.8178 & 0.007105 & 0.003552 \tabularnewline
M10 & 21.7111111111111 & 11.541029 & 1.8812 & 0.066281 & 0.033141 \tabularnewline
M11 & 0.255555555555560 & 11.531029 & 0.0222 & 0.982414 & 0.491207 \tabularnewline
t & 1.85555555555556 & 0.277313 & 6.6912 & 0 & 0 \tabularnewline
\hline
\end{tabular}
%Source: https://freestatistics.org/blog/index.php?pk=25036&T=2

[TABLE]
[ROW][C]Multiple Linear Regression - Ordinary Least Squares[/C][/ROW]
[ROW][C]Variable[/C][C]Parameter[/C][C]S.D.[/C][C]T-STATH0: parameter = 0[/C][C]2-tail p-value[/C][C]1-tail p-value[/C][/ROW]
[ROW][C](Intercept)[/C][C]441.766666666666[/C][C]9.983276[/C][C]44.2507[/C][C]0[/C][C]0[/C][/ROW]
[ROW][C]x[/C][C]16.7222222222221[/C][C]9.606412[/C][C]1.7407[/C][C]0.088416[/C][C]0.044208[/C][/ROW]
[ROW][C]M1[/C][C]8.55555555555529[/C][C]11.650456[/C][C]0.7344[/C][C]0.46646[/C][C]0.23323[/C][/ROW]
[ROW][C]M2[/C][C]2.10000000000004[/C][C]11.620714[/C][C]0.1807[/C][C]0.857388[/C][C]0.428694[/C][/ROW]
[ROW][C]M3[/C][C]-9.55555555555553[/C][C]11.597529[/C][C]-0.8239[/C][C]0.414231[/C][C]0.207115[/C][/ROW]
[ROW][C]M4[/C][C]-17.6111111111111[/C][C]11.58094[/C][C]-1.5207[/C][C]0.13518[/C][C]0.06759[/C][/ROW]
[ROW][C]M5[/C][C]-28.0666666666667[/C][C]11.570975[/C][C]-2.4256[/C][C]0.019264[/C][C]0.009632[/C][/ROW]
[ROW][C]M6[/C][C]-28.9222222222222[/C][C]11.567651[/C][C]-2.5003[/C][C]0.016037[/C][C]0.008018[/C][/ROW]
[ROW][C]M7[/C][C]21.0777777777778[/C][C]11.610784[/C][C]1.8154[/C][C]0.07599[/C][C]0.037995[/C][/ROW]
[ROW][C]M8[/C][C]38.2222222222223[/C][C]11.58094[/C][C]3.3004[/C][C]0.00187[/C][C]0.000935[/C][/ROW]
[ROW][C]M9[/C][C]32.5666666666667[/C][C]11.557675[/C][C]2.8178[/C][C]0.007105[/C][C]0.003552[/C][/ROW]
[ROW][C]M10[/C][C]21.7111111111111[/C][C]11.541029[/C][C]1.8812[/C][C]0.066281[/C][C]0.033141[/C][/ROW]
[ROW][C]M11[/C][C]0.255555555555560[/C][C]11.531029[/C][C]0.0222[/C][C]0.982414[/C][C]0.491207[/C][/ROW]
[ROW][C]t[/C][C]1.85555555555556[/C][C]0.277313[/C][C]6.6912[/C][C]0[/C][C]0[/C][/ROW]
[/TABLE]
Source: https://freestatistics.org/blog/index.php?pk=25036&T=2

Globally Unique Identifier (entire table): ba.freestatistics.org/blog/index.php?pk=25036&T=2

As an alternative you can also use a QR Code:  

The GUIDs for individual cells are displayed in the table below:

Multiple Linear Regression - Ordinary Least Squares
VariableParameterS.D.T-STATH0: parameter = 02-tail p-value1-tail p-value
(Intercept)441.7666666666669.98327644.250700
x16.72222222222219.6064121.74070.0884160.044208
M18.5555555555552911.6504560.73440.466460.23323
M22.1000000000000411.6207140.18070.8573880.428694
M3-9.5555555555555311.597529-0.82390.4142310.207115
M4-17.611111111111111.58094-1.52070.135180.06759
M5-28.066666666666711.570975-2.42560.0192640.009632
M6-28.922222222222211.567651-2.50030.0160370.008018
M721.077777777777811.6107841.81540.075990.037995
M838.222222222222311.580943.30040.001870.000935
M932.566666666666711.5576752.81780.0071050.003552
M1021.711111111111111.5410291.88120.0662810.033141
M110.25555555555556011.5310290.02220.9824140.491207
t1.855555555555560.2773136.691200


Multiple Linear Regression - Regression Statistics
Multiple R0.94589715318519
R-squared0.894721424403847
Adjusted R-squared0.8649687834745
F-TEST (value)30.0720002143174
F-TEST (DF numerator)13
F-TEST (DF denominator)46
p-value0
Multiple Linear Regression - Residual Statistics
Residual Standard Deviation18.2268846397703
Sum Squared Residuals15282.0888888887

\begin{tabular}{lllllllll}
\hline
Multiple Linear Regression - Regression Statistics \tabularnewline
Multiple R & 0.94589715318519 \tabularnewline
R-squared & 0.894721424403847 \tabularnewline
Adjusted R-squared & 0.8649687834745 \tabularnewline
F-TEST (value) & 30.0720002143174 \tabularnewline
F-TEST (DF numerator) & 13 \tabularnewline
F-TEST (DF denominator) & 46 \tabularnewline
p-value & 0 \tabularnewline
Multiple Linear Regression - Residual Statistics \tabularnewline
Residual Standard Deviation & 18.2268846397703 \tabularnewline
Sum Squared Residuals & 15282.0888888887 \tabularnewline
\hline
\end{tabular}
%Source: https://freestatistics.org/blog/index.php?pk=25036&T=3

[TABLE]
[ROW][C]Multiple Linear Regression - Regression Statistics[/C][/ROW]
[ROW][C]Multiple R[/C][C]0.94589715318519[/C][/ROW]
[ROW][C]R-squared[/C][C]0.894721424403847[/C][/ROW]
[ROW][C]Adjusted R-squared[/C][C]0.8649687834745[/C][/ROW]
[ROW][C]F-TEST (value)[/C][C]30.0720002143174[/C][/ROW]
[ROW][C]F-TEST (DF numerator)[/C][C]13[/C][/ROW]
[ROW][C]F-TEST (DF denominator)[/C][C]46[/C][/ROW]
[ROW][C]p-value[/C][C]0[/C][/ROW]
[ROW][C]Multiple Linear Regression - Residual Statistics[/C][/ROW]
[ROW][C]Residual Standard Deviation[/C][C]18.2268846397703[/C][/ROW]
[ROW][C]Sum Squared Residuals[/C][C]15282.0888888887[/C][/ROW]
[/TABLE]
Source: https://freestatistics.org/blog/index.php?pk=25036&T=3

Globally Unique Identifier (entire table): ba.freestatistics.org/blog/index.php?pk=25036&T=3

As an alternative you can also use a QR Code:  

The GUIDs for individual cells are displayed in the table below:

Multiple Linear Regression - Regression Statistics
Multiple R0.94589715318519
R-squared0.894721424403847
Adjusted R-squared0.8649687834745
F-TEST (value)30.0720002143174
F-TEST (DF numerator)13
F-TEST (DF denominator)46
p-value0
Multiple Linear Regression - Residual Statistics
Residual Standard Deviation18.2268846397703
Sum Squared Residuals15282.0888888887


Multiple Linear Regression - Actuals, Interpolation, and Residuals
Time or IndexActualsInterpolationForecastResidualsPrediction Error
1493452.17777777777940.822222222221
2481447.57777777777833.4222222222223
3462437.77777777777824.2222222222223
4457431.57777777777825.4222222222223
5442422.97777777777819.0222222222223
6439423.97777777777815.0222222222222
7488475.83333333333312.1666666666668
8521494.83333333333326.1666666666667
9501491.0333333333339.96666666666676
10485482.0333333333332.96666666666668
11464462.4333333333331.56666666666674
12460464.033333333333-4.0333333333333
13467474.444444444444-7.4444444444441
14460469.844444444444-9.84444444444445
15448460.044444444444-12.0444444444444
16443453.844444444444-10.8444444444444
17436445.244444444444-9.24444444444442
18431446.244444444444-15.2444444444444
19484498.1-14.1
20510517.1-7.1
21513513.3-0.300000000000018
22503504.3-1.29999999999999
23471484.7-13.7
24471486.3-15.3
25476496.711111111111-20.7111111111108
26475492.111111111111-17.1111111111111
27470482.311111111111-12.3111111111111
28461476.111111111111-15.1111111111111
29455467.511111111111-12.5111111111111
30456468.511111111111-12.5111111111111
31517537.088888888889-20.0888888888889
32525556.088888888889-31.0888888888889
33523552.288888888889-29.2888888888889
34519543.288888888889-24.2888888888888
35509523.688888888889-14.6888888888889
36512525.288888888889-13.2888888888889
37519535.7-16.6999999999997
38517531.1-14.1
39510521.3-11.3
40509515.1-6.09999999999999
41501506.5-5.5
42507507.5-0.499999999999985
43569559.3555555555569.64444444444441
44580578.3555555555561.64444444444443
45578574.5555555555563.44444444444441
46565565.555555555556-0.555555555555569
47547545.9555555555561.04444444444442
48555547.5555555555567.44444444444441
49562557.9666666666664.0333333333336
50561553.3666666666677.63333333333327
51555543.56666666666711.4333333333333
52544537.3666666666676.63333333333328
53537528.7666666666678.23333333333327
54543529.76666666666713.2333333333333
55594581.62222222222212.3777777777777
56611600.62222222222210.3777777777777
57613596.82222222222216.1777777777777
58611587.82222222222223.1777777777777
59594568.22222222222225.7777777777777
60595569.82222222222225.1777777777777

\begin{tabular}{lllllllll}
\hline
Multiple Linear Regression - Actuals, Interpolation, and Residuals \tabularnewline
Time or Index & Actuals & InterpolationForecast & ResidualsPrediction Error \tabularnewline
1 & 493 & 452.177777777779 & 40.822222222221 \tabularnewline
2 & 481 & 447.577777777778 & 33.4222222222223 \tabularnewline
3 & 462 & 437.777777777778 & 24.2222222222223 \tabularnewline
4 & 457 & 431.577777777778 & 25.4222222222223 \tabularnewline
5 & 442 & 422.977777777778 & 19.0222222222223 \tabularnewline
6 & 439 & 423.977777777778 & 15.0222222222222 \tabularnewline
7 & 488 & 475.833333333333 & 12.1666666666668 \tabularnewline
8 & 521 & 494.833333333333 & 26.1666666666667 \tabularnewline
9 & 501 & 491.033333333333 & 9.96666666666676 \tabularnewline
10 & 485 & 482.033333333333 & 2.96666666666668 \tabularnewline
11 & 464 & 462.433333333333 & 1.56666666666674 \tabularnewline
12 & 460 & 464.033333333333 & -4.0333333333333 \tabularnewline
13 & 467 & 474.444444444444 & -7.4444444444441 \tabularnewline
14 & 460 & 469.844444444444 & -9.84444444444445 \tabularnewline
15 & 448 & 460.044444444444 & -12.0444444444444 \tabularnewline
16 & 443 & 453.844444444444 & -10.8444444444444 \tabularnewline
17 & 436 & 445.244444444444 & -9.24444444444442 \tabularnewline
18 & 431 & 446.244444444444 & -15.2444444444444 \tabularnewline
19 & 484 & 498.1 & -14.1 \tabularnewline
20 & 510 & 517.1 & -7.1 \tabularnewline
21 & 513 & 513.3 & -0.300000000000018 \tabularnewline
22 & 503 & 504.3 & -1.29999999999999 \tabularnewline
23 & 471 & 484.7 & -13.7 \tabularnewline
24 & 471 & 486.3 & -15.3 \tabularnewline
25 & 476 & 496.711111111111 & -20.7111111111108 \tabularnewline
26 & 475 & 492.111111111111 & -17.1111111111111 \tabularnewline
27 & 470 & 482.311111111111 & -12.3111111111111 \tabularnewline
28 & 461 & 476.111111111111 & -15.1111111111111 \tabularnewline
29 & 455 & 467.511111111111 & -12.5111111111111 \tabularnewline
30 & 456 & 468.511111111111 & -12.5111111111111 \tabularnewline
31 & 517 & 537.088888888889 & -20.0888888888889 \tabularnewline
32 & 525 & 556.088888888889 & -31.0888888888889 \tabularnewline
33 & 523 & 552.288888888889 & -29.2888888888889 \tabularnewline
34 & 519 & 543.288888888889 & -24.2888888888888 \tabularnewline
35 & 509 & 523.688888888889 & -14.6888888888889 \tabularnewline
36 & 512 & 525.288888888889 & -13.2888888888889 \tabularnewline
37 & 519 & 535.7 & -16.6999999999997 \tabularnewline
38 & 517 & 531.1 & -14.1 \tabularnewline
39 & 510 & 521.3 & -11.3 \tabularnewline
40 & 509 & 515.1 & -6.09999999999999 \tabularnewline
41 & 501 & 506.5 & -5.5 \tabularnewline
42 & 507 & 507.5 & -0.499999999999985 \tabularnewline
43 & 569 & 559.355555555556 & 9.64444444444441 \tabularnewline
44 & 580 & 578.355555555556 & 1.64444444444443 \tabularnewline
45 & 578 & 574.555555555556 & 3.44444444444441 \tabularnewline
46 & 565 & 565.555555555556 & -0.555555555555569 \tabularnewline
47 & 547 & 545.955555555556 & 1.04444444444442 \tabularnewline
48 & 555 & 547.555555555556 & 7.44444444444441 \tabularnewline
49 & 562 & 557.966666666666 & 4.0333333333336 \tabularnewline
50 & 561 & 553.366666666667 & 7.63333333333327 \tabularnewline
51 & 555 & 543.566666666667 & 11.4333333333333 \tabularnewline
52 & 544 & 537.366666666667 & 6.63333333333328 \tabularnewline
53 & 537 & 528.766666666667 & 8.23333333333327 \tabularnewline
54 & 543 & 529.766666666667 & 13.2333333333333 \tabularnewline
55 & 594 & 581.622222222222 & 12.3777777777777 \tabularnewline
56 & 611 & 600.622222222222 & 10.3777777777777 \tabularnewline
57 & 613 & 596.822222222222 & 16.1777777777777 \tabularnewline
58 & 611 & 587.822222222222 & 23.1777777777777 \tabularnewline
59 & 594 & 568.222222222222 & 25.7777777777777 \tabularnewline
60 & 595 & 569.822222222222 & 25.1777777777777 \tabularnewline
\hline
\end{tabular}
%Source: https://freestatistics.org/blog/index.php?pk=25036&T=4

[TABLE]
[ROW][C]Multiple Linear Regression - Actuals, Interpolation, and Residuals[/C][/ROW]
[ROW][C]Time or Index[/C][C]Actuals[/C][C]InterpolationForecast[/C][C]ResidualsPrediction Error[/C][/ROW]
[ROW][C]1[/C][C]493[/C][C]452.177777777779[/C][C]40.822222222221[/C][/ROW]
[ROW][C]2[/C][C]481[/C][C]447.577777777778[/C][C]33.4222222222223[/C][/ROW]
[ROW][C]3[/C][C]462[/C][C]437.777777777778[/C][C]24.2222222222223[/C][/ROW]
[ROW][C]4[/C][C]457[/C][C]431.577777777778[/C][C]25.4222222222223[/C][/ROW]
[ROW][C]5[/C][C]442[/C][C]422.977777777778[/C][C]19.0222222222223[/C][/ROW]
[ROW][C]6[/C][C]439[/C][C]423.977777777778[/C][C]15.0222222222222[/C][/ROW]
[ROW][C]7[/C][C]488[/C][C]475.833333333333[/C][C]12.1666666666668[/C][/ROW]
[ROW][C]8[/C][C]521[/C][C]494.833333333333[/C][C]26.1666666666667[/C][/ROW]
[ROW][C]9[/C][C]501[/C][C]491.033333333333[/C][C]9.96666666666676[/C][/ROW]
[ROW][C]10[/C][C]485[/C][C]482.033333333333[/C][C]2.96666666666668[/C][/ROW]
[ROW][C]11[/C][C]464[/C][C]462.433333333333[/C][C]1.56666666666674[/C][/ROW]
[ROW][C]12[/C][C]460[/C][C]464.033333333333[/C][C]-4.0333333333333[/C][/ROW]
[ROW][C]13[/C][C]467[/C][C]474.444444444444[/C][C]-7.4444444444441[/C][/ROW]
[ROW][C]14[/C][C]460[/C][C]469.844444444444[/C][C]-9.84444444444445[/C][/ROW]
[ROW][C]15[/C][C]448[/C][C]460.044444444444[/C][C]-12.0444444444444[/C][/ROW]
[ROW][C]16[/C][C]443[/C][C]453.844444444444[/C][C]-10.8444444444444[/C][/ROW]
[ROW][C]17[/C][C]436[/C][C]445.244444444444[/C][C]-9.24444444444442[/C][/ROW]
[ROW][C]18[/C][C]431[/C][C]446.244444444444[/C][C]-15.2444444444444[/C][/ROW]
[ROW][C]19[/C][C]484[/C][C]498.1[/C][C]-14.1[/C][/ROW]
[ROW][C]20[/C][C]510[/C][C]517.1[/C][C]-7.1[/C][/ROW]
[ROW][C]21[/C][C]513[/C][C]513.3[/C][C]-0.300000000000018[/C][/ROW]
[ROW][C]22[/C][C]503[/C][C]504.3[/C][C]-1.29999999999999[/C][/ROW]
[ROW][C]23[/C][C]471[/C][C]484.7[/C][C]-13.7[/C][/ROW]
[ROW][C]24[/C][C]471[/C][C]486.3[/C][C]-15.3[/C][/ROW]
[ROW][C]25[/C][C]476[/C][C]496.711111111111[/C][C]-20.7111111111108[/C][/ROW]
[ROW][C]26[/C][C]475[/C][C]492.111111111111[/C][C]-17.1111111111111[/C][/ROW]
[ROW][C]27[/C][C]470[/C][C]482.311111111111[/C][C]-12.3111111111111[/C][/ROW]
[ROW][C]28[/C][C]461[/C][C]476.111111111111[/C][C]-15.1111111111111[/C][/ROW]
[ROW][C]29[/C][C]455[/C][C]467.511111111111[/C][C]-12.5111111111111[/C][/ROW]
[ROW][C]30[/C][C]456[/C][C]468.511111111111[/C][C]-12.5111111111111[/C][/ROW]
[ROW][C]31[/C][C]517[/C][C]537.088888888889[/C][C]-20.0888888888889[/C][/ROW]
[ROW][C]32[/C][C]525[/C][C]556.088888888889[/C][C]-31.0888888888889[/C][/ROW]
[ROW][C]33[/C][C]523[/C][C]552.288888888889[/C][C]-29.2888888888889[/C][/ROW]
[ROW][C]34[/C][C]519[/C][C]543.288888888889[/C][C]-24.2888888888888[/C][/ROW]
[ROW][C]35[/C][C]509[/C][C]523.688888888889[/C][C]-14.6888888888889[/C][/ROW]
[ROW][C]36[/C][C]512[/C][C]525.288888888889[/C][C]-13.2888888888889[/C][/ROW]
[ROW][C]37[/C][C]519[/C][C]535.7[/C][C]-16.6999999999997[/C][/ROW]
[ROW][C]38[/C][C]517[/C][C]531.1[/C][C]-14.1[/C][/ROW]
[ROW][C]39[/C][C]510[/C][C]521.3[/C][C]-11.3[/C][/ROW]
[ROW][C]40[/C][C]509[/C][C]515.1[/C][C]-6.09999999999999[/C][/ROW]
[ROW][C]41[/C][C]501[/C][C]506.5[/C][C]-5.5[/C][/ROW]
[ROW][C]42[/C][C]507[/C][C]507.5[/C][C]-0.499999999999985[/C][/ROW]
[ROW][C]43[/C][C]569[/C][C]559.355555555556[/C][C]9.64444444444441[/C][/ROW]
[ROW][C]44[/C][C]580[/C][C]578.355555555556[/C][C]1.64444444444443[/C][/ROW]
[ROW][C]45[/C][C]578[/C][C]574.555555555556[/C][C]3.44444444444441[/C][/ROW]
[ROW][C]46[/C][C]565[/C][C]565.555555555556[/C][C]-0.555555555555569[/C][/ROW]
[ROW][C]47[/C][C]547[/C][C]545.955555555556[/C][C]1.04444444444442[/C][/ROW]
[ROW][C]48[/C][C]555[/C][C]547.555555555556[/C][C]7.44444444444441[/C][/ROW]
[ROW][C]49[/C][C]562[/C][C]557.966666666666[/C][C]4.0333333333336[/C][/ROW]
[ROW][C]50[/C][C]561[/C][C]553.366666666667[/C][C]7.63333333333327[/C][/ROW]
[ROW][C]51[/C][C]555[/C][C]543.566666666667[/C][C]11.4333333333333[/C][/ROW]
[ROW][C]52[/C][C]544[/C][C]537.366666666667[/C][C]6.63333333333328[/C][/ROW]
[ROW][C]53[/C][C]537[/C][C]528.766666666667[/C][C]8.23333333333327[/C][/ROW]
[ROW][C]54[/C][C]543[/C][C]529.766666666667[/C][C]13.2333333333333[/C][/ROW]
[ROW][C]55[/C][C]594[/C][C]581.622222222222[/C][C]12.3777777777777[/C][/ROW]
[ROW][C]56[/C][C]611[/C][C]600.622222222222[/C][C]10.3777777777777[/C][/ROW]
[ROW][C]57[/C][C]613[/C][C]596.822222222222[/C][C]16.1777777777777[/C][/ROW]
[ROW][C]58[/C][C]611[/C][C]587.822222222222[/C][C]23.1777777777777[/C][/ROW]
[ROW][C]59[/C][C]594[/C][C]568.222222222222[/C][C]25.7777777777777[/C][/ROW]
[ROW][C]60[/C][C]595[/C][C]569.822222222222[/C][C]25.1777777777777[/C][/ROW]
[/TABLE]
Source: https://freestatistics.org/blog/index.php?pk=25036&T=4

Globally Unique Identifier (entire table): ba.freestatistics.org/blog/index.php?pk=25036&T=4

As an alternative you can also use a QR Code:  

The GUIDs for individual cells are displayed in the table below:

Multiple Linear Regression - Actuals, Interpolation, and Residuals
Time or IndexActualsInterpolationForecastResidualsPrediction Error
1493452.17777777777940.822222222221
2481447.57777777777833.4222222222223
3462437.77777777777824.2222222222223
4457431.57777777777825.4222222222223
5442422.97777777777819.0222222222223
6439423.97777777777815.0222222222222
7488475.83333333333312.1666666666668
8521494.83333333333326.1666666666667
9501491.0333333333339.96666666666676
10485482.0333333333332.96666666666668
11464462.4333333333331.56666666666674
12460464.033333333333-4.0333333333333
13467474.444444444444-7.4444444444441
14460469.844444444444-9.84444444444445
15448460.044444444444-12.0444444444444
16443453.844444444444-10.8444444444444
17436445.244444444444-9.24444444444442
18431446.244444444444-15.2444444444444
19484498.1-14.1
20510517.1-7.1
21513513.3-0.300000000000018
22503504.3-1.29999999999999
23471484.7-13.7
24471486.3-15.3
25476496.711111111111-20.7111111111108
26475492.111111111111-17.1111111111111
27470482.311111111111-12.3111111111111
28461476.111111111111-15.1111111111111
29455467.511111111111-12.5111111111111
30456468.511111111111-12.5111111111111
31517537.088888888889-20.0888888888889
32525556.088888888889-31.0888888888889
33523552.288888888889-29.2888888888889
34519543.288888888889-24.2888888888888
35509523.688888888889-14.6888888888889
36512525.288888888889-13.2888888888889
37519535.7-16.6999999999997
38517531.1-14.1
39510521.3-11.3
40509515.1-6.09999999999999
41501506.5-5.5
42507507.5-0.499999999999985
43569559.3555555555569.64444444444441
44580578.3555555555561.64444444444443
45578574.5555555555563.44444444444441
46565565.555555555556-0.555555555555569
47547545.9555555555561.04444444444442
48555547.5555555555567.44444444444441
49562557.9666666666664.0333333333336
50561553.3666666666677.63333333333327
51555543.56666666666711.4333333333333
52544537.3666666666676.63333333333328
53537528.7666666666678.23333333333327
54543529.76666666666713.2333333333333
55594581.62222222222212.3777777777777
56611600.62222222222210.3777777777777
57613596.82222222222216.1777777777777
58611587.82222222222223.1777777777777
59594568.22222222222225.7777777777777
60595569.82222222222225.1777777777777


Parameters (Session):
par1 = 1 ; par2 = Do not include Seasonal Dummies ; par3 = No Linear Trend ;
Parameters (R input):
par1 = 1 ; par2 = Include Monthly Dummies ; par3 = Linear Trend ;
R code (references can be found in the software module):
library(lattice)
par1 <- as.numeric(par1)
x <- t(y)
k <- length(x[1,])
n <- length(x[,1])
x1 <- cbind(x[,par1], x[,1:k!=par1])
mycolnames <- c(colnames(x)[par1], colnames(x)[1:k!=par1])
colnames(x1) <- mycolnames #colnames(x)[par1]
x <- x1
if (par3 == 'First Differences'){
x2 <- array(0, dim=c(n-1,k), dimnames=list(1:(n-1), paste('(1-B)',colnames(x),sep='')))
for (i in 1:n-1) {
for (j in 1:k) {
x2[i,j] <- x[i+1,j] - x[i,j]
}
}
x <- x2
}
if (par2 == 'Include Monthly Dummies'){
x2 <- array(0, dim=c(n,11), dimnames=list(1:n, paste('M', seq(1:11), sep ='')))
for (i in 1:11){
x2[seq(i,n,12),i] <- 1
}
x <- cbind(x, x2)
}
if (par2 == 'Include Quarterly Dummies'){
x2 <- array(0, dim=c(n,3), dimnames=list(1:n, paste('Q', seq(1:3), sep ='')))
for (i in 1:3){
x2[seq(i,n,4),i] <- 1
}
x <- cbind(x, x2)
}
k <- length(x[1,])
if (par3 == 'Linear Trend'){
x <- cbind(x, c(1:n))
colnames(x)[k+1] <- 't'
}
x
k <- length(x[1,])
df <- as.data.frame(x)
(mylm <- lm(df))
(mysum <- summary(mylm))
bitmap(file='test0.png')
plot(x[,1], type='l', main='Actuals and Interpolation', ylab='value of Actuals and Interpolation (dots)', xlab='time or index')
points(x[,1]-mysum$resid)
grid()
dev.off()
bitmap(file='test1.png')
plot(mysum$resid, type='b', pch=19, main='Residuals', ylab='value of Residuals', xlab='time or index')
grid()
dev.off()
bitmap(file='test2.png')
hist(mysum$resid, main='Residual Histogram', xlab='values of Residuals')
grid()
dev.off()
bitmap(file='test3.png')
densityplot(~mysum$resid,col='black',main='Residual Density Plot', xlab='values of Residuals')
dev.off()
bitmap(file='test4.png')
qqnorm(mysum$resid, main='Residual Normal Q-Q Plot')
grid()
dev.off()
(myerror <- as.ts(mysum$resid))
bitmap(file='test5.png')
dum <- cbind(lag(myerror,k=1),myerror)
dum
dum1 <- dum[2:length(myerror),]
dum1
z <- as.data.frame(dum1)
z
plot(z,main=paste('Residual Lag plot, lowess, and regression line'), ylab='values of Residuals', xlab='lagged values of Residuals')
lines(lowess(z))
abline(lm(z))
grid()
dev.off()
bitmap(file='test6.png')
acf(mysum$resid, lag.max=length(mysum$resid)/2, main='Residual Autocorrelation Function')
grid()
dev.off()
bitmap(file='test7.png')
pacf(mysum$resid, lag.max=length(mysum$resid)/2, main='Residual Partial Autocorrelation Function')
grid()
dev.off()
bitmap(file='test8.png')
opar <- par(mfrow = c(2,2), oma = c(0, 0, 1.1, 0))
plot(mylm, las = 1, sub='Residual Diagnostics')
par(opar)
dev.off()
load(file='createtable')
a<-table.start()
a<-table.row.start(a)
a<-table.element(a, 'Multiple Linear Regression - Estimated Regression Equation', 1, TRUE)
a<-table.row.end(a)
myeq <- colnames(x)[1]
myeq <- paste(myeq, '[t] = ', sep='')
for (i in 1:k){
if (mysum$coefficients[i,1] > 0) myeq <- paste(myeq, '+', '')
myeq <- paste(myeq, mysum$coefficients[i,1], sep=' ')
if (rownames(mysum$coefficients)[i] != '(Intercept)') {
myeq <- paste(myeq, rownames(mysum$coefficients)[i], sep='')
if (rownames(mysum$coefficients)[i] != 't') myeq <- paste(myeq, '[t]', sep='')
}
}
myeq <- paste(myeq, ' + e[t]')
a<-table.row.start(a)
a<-table.element(a, myeq)
a<-table.row.end(a)
a<-table.end(a)
table.save(a,file='mytable1.tab')
a<-table.start()
a<-table.row.start(a)
a<-table.element(a,hyperlink('ols1.htm','Multiple Linear Regression - Ordinary Least Squares',''), 6, TRUE)
a<-table.row.end(a)
a<-table.row.start(a)
a<-table.element(a,'Variable',header=TRUE)
a<-table.element(a,'Parameter',header=TRUE)
a<-table.element(a,'S.D.',header=TRUE)
a<-table.element(a,'T-STAT
H0: parameter = 0',header=TRUE)
a<-table.element(a,'2-tail p-value',header=TRUE)
a<-table.element(a,'1-tail p-value',header=TRUE)
a<-table.row.end(a)
for (i in 1:k){
a<-table.row.start(a)
a<-table.element(a,rownames(mysum$coefficients)[i],header=TRUE)
a<-table.element(a,mysum$coefficients[i,1])
a<-table.element(a, round(mysum$coefficients[i,2],6))
a<-table.element(a, round(mysum$coefficients[i,3],4))
a<-table.element(a, round(mysum$coefficients[i,4],6))
a<-table.element(a, round(mysum$coefficients[i,4]/2,6))
a<-table.row.end(a)
}
a<-table.end(a)
table.save(a,file='mytable2.tab')
a<-table.start()
a<-table.row.start(a)
a<-table.element(a, 'Multiple Linear Regression - Regression Statistics', 2, TRUE)
a<-table.row.end(a)
a<-table.row.start(a)
a<-table.element(a, 'Multiple R',1,TRUE)
a<-table.element(a, sqrt(mysum$r.squared))
a<-table.row.end(a)
a<-table.row.start(a)
a<-table.element(a, 'R-squared',1,TRUE)
a<-table.element(a, mysum$r.squared)
a<-table.row.end(a)
a<-table.row.start(a)
a<-table.element(a, 'Adjusted R-squared',1,TRUE)
a<-table.element(a, mysum$adj.r.squared)
a<-table.row.end(a)
a<-table.row.start(a)
a<-table.element(a, 'F-TEST (value)',1,TRUE)
a<-table.element(a, mysum$fstatistic[1])
a<-table.row.end(a)
a<-table.row.start(a)
a<-table.element(a, 'F-TEST (DF numerator)',1,TRUE)
a<-table.element(a, mysum$fstatistic[2])
a<-table.row.end(a)
a<-table.row.start(a)
a<-table.element(a, 'F-TEST (DF denominator)',1,TRUE)
a<-table.element(a, mysum$fstatistic[3])
a<-table.row.end(a)
a<-table.row.start(a)
a<-table.element(a, 'p-value',1,TRUE)
a<-table.element(a, 1-pf(mysum$fstatistic[1],mysum$fstatistic[2],mysum$fstatistic[3]))
a<-table.row.end(a)
a<-table.row.start(a)
a<-table.element(a, 'Multiple Linear Regression - Residual Statistics', 2, TRUE)
a<-table.row.end(a)
a<-table.row.start(a)
a<-table.element(a, 'Residual Standard Deviation',1,TRUE)
a<-table.element(a, mysum$sigma)
a<-table.row.end(a)
a<-table.row.start(a)
a<-table.element(a, 'Sum Squared Residuals',1,TRUE)
a<-table.element(a, sum(myerror*myerror))
a<-table.row.end(a)
a<-table.end(a)
table.save(a,file='mytable3.tab')
a<-table.start()
a<-table.row.start(a)
a<-table.element(a, 'Multiple Linear Regression - Actuals, Interpolation, and Residuals', 4, TRUE)
a<-table.row.end(a)
a<-table.row.start(a)
a<-table.element(a, 'Time or Index', 1, TRUE)
a<-table.element(a, 'Actuals', 1, TRUE)
a<-table.element(a, 'Interpolation
Forecast', 1, TRUE)
a<-table.element(a, 'Residuals
Prediction Error', 1, TRUE)
a<-table.row.end(a)
for (i in 1:n) {
a<-table.row.start(a)
a<-table.element(a,i, 1, TRUE)
a<-table.element(a,x[i])
a<-table.element(a,x[i]-mysum$resid[i])
a<-table.element(a,mysum$resid[i])
a<-table.row.end(a)
}
a<-table.end(a)
table.save(a,file='mytable4.tab')