Free Statistics

of Irreproducible Research!

Author's title

Author*The author of this computation has been verified*
R Software Modulerwasp_hierarchicalclustering.wasp
Title produced by softwareHierarchical Clustering
Date of computationTue, 11 Nov 2008 11:50:02 -0700
Cite this page as followsStatistical Computations at FreeStatistics.org, Office for Research Development and Education, URL https://freestatistics.org/blog/index.php?v=date/2008/Nov/11/t1226429467pyiqd1uvp923s5h.htm/, Retrieved Sat, 18 May 2024 13:49:06 +0000
Statistical Computations at FreeStatistics.org, Office for Research Development and Education, URL https://freestatistics.org/blog/index.php?pk=23825, Retrieved Sat, 18 May 2024 13:49:06 +0000
QR Codes:

Original text written by user:
IsPrivate?No (this computation is public)
User-defined keywords
Estimated Impact178
Family? (F = Feedback message, R = changed R code, M = changed R Module, P = changed Parameters, D = changed Data)
F     [Pearson Partial Correlation] [Workshop 4] [2007-10-30 14:41:06] [c8ea599e5a03d5b991b7fa762eaf839d]
F RMPD    [Hierarchical Clustering] [Q2 Hierarchial Cl...] [2008-11-11 18:50:02] [35348cd8592af0baf5f138bd59921307] [Current]
Feedback Forum
2008-11-22 20:26:21 [Nilay Erdogdu] [reply
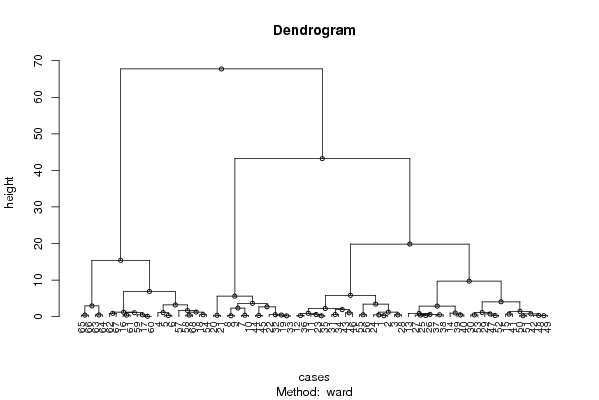
Hierarchical clustering is een methode die gelijkaardig is aan de starplot.De gegevens die grote gelijkenissen vertonen worden op lage hoogte al bij elkaar genomen. Gegevens die (bijna) geen verschillen vertonen worden op grotere hoogte bij elkaar genomen. Daarna worden deze segmenten met elkaar verbonden op hoogte naargelang deze gelijkaardig verschilt. De gegevens onderaan staan voor de maanden. Deze gegevens worden opgedeeld in 4 verschillende groepen. In de raw input kan je afstand hoogte aflezen.
2008-11-24 09:00:18 [Stéphanie Claes] [reply
Dendrogram is de clustering van de observaties. We gaan na welke observaties als gelijkaardig kunnen gezien worden => groepjes zijn hierarchisch.
We hebben een linkertak (te groeperen in 1 categorie) en een rechtertak (groeperen in een andere categorie).
De calculator is niet echt bruikbaar omdat het dient voor niet-tijdreeksen om een algemene trend of clusters te vinden.

Post a new message
Dataseries X:
7.8	9.0	21.1	7.0
7.6	9.1	21.0	6.9
7.5	8.7	20.4	6.7
7.6	8.2	19.5	6.6
7.5	7.9	18.6	6.5
7.3	7.9	18.8	6.4
7.6	9.1	23.7	6.5
7.5	9.4	24.8	6.5
7.6	9.5	25.0	6.6
7.9	9.1	23.6	6.7
7.9	9.0	22.3	6.8
8.1	9.3	21.8	7.2
8.2	9.9	20.8	7.6
8.0	9.8	19.7	7.6
7.5	9.4	18.3	7.3
6.8	8.3	17.4	6.4
6.5	8.0	17.0	6.1
6.6	8.5	18.1	6.3
7.6	10.4	23.9	7.1
8.0	11.1	25.6	7.5
8.0	10.9	25.3	7.4
7.7	9.9	23.6	7.1
7.5	9.2	21.9	6.8
7.6	9.2	21.4	6.9
7.7	9.5	20.6	7.2
7.9	9.6	20.5	7.4
7.8	9.5	20.2	7.3
7.5	9.1	20.6	6.9
7.5	8.9	19.7	6.9
7.1	9.0	19.3	6.8
7.5	10.1	22.8	7.1
7.5	10.3	23.5	7.2
7.6	10.2	23.8	7.1
7.7	9.6	22.6	7.0
7.7	9.2	22.0	6.9
7.9	9.3	21.7	7.0
8.1	9.4	20.7	7.4
8.2	9.4	20.2	7.5
8.2	9.2	19.1	7.5
8.1	9.0	19.5	7.4
7.9	9.0	18.7	7.3
7.3	9.0	18.6	7.0
6.9	9.8	22.2	6.7
6.6	10.0	23.2	6.5
6.7	9.9	23.5	6.5
6.9	9.3	21.3	6.5
7.0	9.0	20.0	6.6
7.1	9.0	18.7	6.8
7.2	9.1	18.9	6.9
7.1	9.1	18.3	6.9
6.9	9.1	18.4	6.8
7.0	9.2	19.9	6.8
6.8	8.8	19.2	6.5
6.4	8.3	18.5	6.1
6.7	8.4	20.9	6.0
6.7	8.1	20.5	5.9
6.4	7.8	19.4	5.8
6.3	7.9	18.1	5.9
6.2	7.9	17.0	5.9
6.5	8.0	17.0	6.2
6.8	7.9	17.3	6.3
6.8	7.5	16.7	6.2
6.5	7.2	15.5	6.0
6.3	6.9	15.3	5.8
5.9	6.6	13.7	5.5
5.9	6.7	14.1	5.5
6.4	7.3	17.3	5.7
6.4	7.5	18.1	5.8


Summary of computational transaction
Raw Inputview raw input (R code)
Raw Outputview raw output of R engine
Computing time3 seconds
R Server'Herman Ole Andreas Wold' @ 193.190.124.10:1001

\begin{tabular}{lllllllll}
\hline
Summary of computational transaction \tabularnewline
Raw Input & view raw input (R code)  \tabularnewline
Raw Output & view raw output of R engine  \tabularnewline
Computing time & 3 seconds \tabularnewline
R Server & 'Herman Ole Andreas Wold' @ 193.190.124.10:1001 \tabularnewline
\hline
\end{tabular}
%Source: https://freestatistics.org/blog/index.php?pk=23825&T=0

[TABLE]
[ROW][C]Summary of computational transaction[/C][/ROW]
[ROW][C]Raw Input[/C][C]view raw input (R code) [/C][/ROW]
[ROW][C]Raw Output[/C][C]view raw output of R engine [/C][/ROW]
[ROW][C]Computing time[/C][C]3 seconds[/C][/ROW]
[ROW][C]R Server[/C][C]'Herman Ole Andreas Wold' @ 193.190.124.10:1001[/C][/ROW]
[/TABLE]
Source: https://freestatistics.org/blog/index.php?pk=23825&T=0

Globally Unique Identifier (entire table): ba.freestatistics.org/blog/index.php?pk=23825&T=0

As an alternative you can also use a QR Code:  

The GUIDs for individual cells are displayed in the table below:

Summary of computational transaction
Raw Inputview raw input (R code)
Raw Outputview raw output of R engine
Computing time3 seconds
R Server'Herman Ole Andreas Wold' @ 193.190.124.10:1001


Summary of Dendrogram
LabelHeight
10.100000000000001
20.223606797749979
30.244948974278317
40.244948974278319
50.264575131106458
60.264575131106459
70.264575131106459
80.299999999999999
90.3
100.3
110.316227766016838
120.331662479035541
130.342748397307029
140.374165738677394
150.374165738677394
160.408373564811525
170.412310562561767
180.424264068711928
190.424264068711929
200.446997771328569
210.458257569495584
220.469041575982341
230.469524710480307
240.479583152331272
250.489897948556637
260.506703755354307
270.509901951359278
280.519615242270663
290.529150262212917
300.549756504215212
310.58309518948453
320.601193054381847
330.625364443177159
340.69282032302755
350.75854983860728
360.764346153407554
370.874894852719657
380.9
390.92342908365426
400.998250683519863
411.04880884817015
421.08050887433043
431.10118752132012
441.14873825261602
451.24027801901337
461.24908251837519
471.25753333603068
481.44195190309986
491.67367366872872
501.92568014123052
512.22930774150466
522.33744535025621
532.70715961587731
542.88724394997001
552.93938958178743
563.19509090513467
573.44534555205390
583.64355900783353
594.06698295696511
605.59463894145225
615.8267746830853
626.88175250110305
639.70862102092983
6415.4039068180576
6519.8531275410825
6643.2281617282275
6767.7424480270375

\begin{tabular}{lllllllll}
\hline
Summary of Dendrogram \tabularnewline
Label & Height \tabularnewline
1 & 0.100000000000001 \tabularnewline
2 & 0.223606797749979 \tabularnewline
3 & 0.244948974278317 \tabularnewline
4 & 0.244948974278319 \tabularnewline
5 & 0.264575131106458 \tabularnewline
6 & 0.264575131106459 \tabularnewline
7 & 0.264575131106459 \tabularnewline
8 & 0.299999999999999 \tabularnewline
9 & 0.3 \tabularnewline
10 & 0.3 \tabularnewline
11 & 0.316227766016838 \tabularnewline
12 & 0.331662479035541 \tabularnewline
13 & 0.342748397307029 \tabularnewline
14 & 0.374165738677394 \tabularnewline
15 & 0.374165738677394 \tabularnewline
16 & 0.408373564811525 \tabularnewline
17 & 0.412310562561767 \tabularnewline
18 & 0.424264068711928 \tabularnewline
19 & 0.424264068711929 \tabularnewline
20 & 0.446997771328569 \tabularnewline
21 & 0.458257569495584 \tabularnewline
22 & 0.469041575982341 \tabularnewline
23 & 0.469524710480307 \tabularnewline
24 & 0.479583152331272 \tabularnewline
25 & 0.489897948556637 \tabularnewline
26 & 0.506703755354307 \tabularnewline
27 & 0.509901951359278 \tabularnewline
28 & 0.519615242270663 \tabularnewline
29 & 0.529150262212917 \tabularnewline
30 & 0.549756504215212 \tabularnewline
31 & 0.58309518948453 \tabularnewline
32 & 0.601193054381847 \tabularnewline
33 & 0.625364443177159 \tabularnewline
34 & 0.69282032302755 \tabularnewline
35 & 0.75854983860728 \tabularnewline
36 & 0.764346153407554 \tabularnewline
37 & 0.874894852719657 \tabularnewline
38 & 0.9 \tabularnewline
39 & 0.92342908365426 \tabularnewline
40 & 0.998250683519863 \tabularnewline
41 & 1.04880884817015 \tabularnewline
42 & 1.08050887433043 \tabularnewline
43 & 1.10118752132012 \tabularnewline
44 & 1.14873825261602 \tabularnewline
45 & 1.24027801901337 \tabularnewline
46 & 1.24908251837519 \tabularnewline
47 & 1.25753333603068 \tabularnewline
48 & 1.44195190309986 \tabularnewline
49 & 1.67367366872872 \tabularnewline
50 & 1.92568014123052 \tabularnewline
51 & 2.22930774150466 \tabularnewline
52 & 2.33744535025621 \tabularnewline
53 & 2.70715961587731 \tabularnewline
54 & 2.88724394997001 \tabularnewline
55 & 2.93938958178743 \tabularnewline
56 & 3.19509090513467 \tabularnewline
57 & 3.44534555205390 \tabularnewline
58 & 3.64355900783353 \tabularnewline
59 & 4.06698295696511 \tabularnewline
60 & 5.59463894145225 \tabularnewline
61 & 5.8267746830853 \tabularnewline
62 & 6.88175250110305 \tabularnewline
63 & 9.70862102092983 \tabularnewline
64 & 15.4039068180576 \tabularnewline
65 & 19.8531275410825 \tabularnewline
66 & 43.2281617282275 \tabularnewline
67 & 67.7424480270375 \tabularnewline
\hline
\end{tabular}
%Source: https://freestatistics.org/blog/index.php?pk=23825&T=1

[TABLE]
[ROW][C]Summary of Dendrogram[/C][/ROW]
[ROW][C]Label[/C][C]Height[/C][/ROW]
[ROW][C]1[/C][C]0.100000000000001[/C][/ROW]
[ROW][C]2[/C][C]0.223606797749979[/C][/ROW]
[ROW][C]3[/C][C]0.244948974278317[/C][/ROW]
[ROW][C]4[/C][C]0.244948974278319[/C][/ROW]
[ROW][C]5[/C][C]0.264575131106458[/C][/ROW]
[ROW][C]6[/C][C]0.264575131106459[/C][/ROW]
[ROW][C]7[/C][C]0.264575131106459[/C][/ROW]
[ROW][C]8[/C][C]0.299999999999999[/C][/ROW]
[ROW][C]9[/C][C]0.3[/C][/ROW]
[ROW][C]10[/C][C]0.3[/C][/ROW]
[ROW][C]11[/C][C]0.316227766016838[/C][/ROW]
[ROW][C]12[/C][C]0.331662479035541[/C][/ROW]
[ROW][C]13[/C][C]0.342748397307029[/C][/ROW]
[ROW][C]14[/C][C]0.374165738677394[/C][/ROW]
[ROW][C]15[/C][C]0.374165738677394[/C][/ROW]
[ROW][C]16[/C][C]0.408373564811525[/C][/ROW]
[ROW][C]17[/C][C]0.412310562561767[/C][/ROW]
[ROW][C]18[/C][C]0.424264068711928[/C][/ROW]
[ROW][C]19[/C][C]0.424264068711929[/C][/ROW]
[ROW][C]20[/C][C]0.446997771328569[/C][/ROW]
[ROW][C]21[/C][C]0.458257569495584[/C][/ROW]
[ROW][C]22[/C][C]0.469041575982341[/C][/ROW]
[ROW][C]23[/C][C]0.469524710480307[/C][/ROW]
[ROW][C]24[/C][C]0.479583152331272[/C][/ROW]
[ROW][C]25[/C][C]0.489897948556637[/C][/ROW]
[ROW][C]26[/C][C]0.506703755354307[/C][/ROW]
[ROW][C]27[/C][C]0.509901951359278[/C][/ROW]
[ROW][C]28[/C][C]0.519615242270663[/C][/ROW]
[ROW][C]29[/C][C]0.529150262212917[/C][/ROW]
[ROW][C]30[/C][C]0.549756504215212[/C][/ROW]
[ROW][C]31[/C][C]0.58309518948453[/C][/ROW]
[ROW][C]32[/C][C]0.601193054381847[/C][/ROW]
[ROW][C]33[/C][C]0.625364443177159[/C][/ROW]
[ROW][C]34[/C][C]0.69282032302755[/C][/ROW]
[ROW][C]35[/C][C]0.75854983860728[/C][/ROW]
[ROW][C]36[/C][C]0.764346153407554[/C][/ROW]
[ROW][C]37[/C][C]0.874894852719657[/C][/ROW]
[ROW][C]38[/C][C]0.9[/C][/ROW]
[ROW][C]39[/C][C]0.92342908365426[/C][/ROW]
[ROW][C]40[/C][C]0.998250683519863[/C][/ROW]
[ROW][C]41[/C][C]1.04880884817015[/C][/ROW]
[ROW][C]42[/C][C]1.08050887433043[/C][/ROW]
[ROW][C]43[/C][C]1.10118752132012[/C][/ROW]
[ROW][C]44[/C][C]1.14873825261602[/C][/ROW]
[ROW][C]45[/C][C]1.24027801901337[/C][/ROW]
[ROW][C]46[/C][C]1.24908251837519[/C][/ROW]
[ROW][C]47[/C][C]1.25753333603068[/C][/ROW]
[ROW][C]48[/C][C]1.44195190309986[/C][/ROW]
[ROW][C]49[/C][C]1.67367366872872[/C][/ROW]
[ROW][C]50[/C][C]1.92568014123052[/C][/ROW]
[ROW][C]51[/C][C]2.22930774150466[/C][/ROW]
[ROW][C]52[/C][C]2.33744535025621[/C][/ROW]
[ROW][C]53[/C][C]2.70715961587731[/C][/ROW]
[ROW][C]54[/C][C]2.88724394997001[/C][/ROW]
[ROW][C]55[/C][C]2.93938958178743[/C][/ROW]
[ROW][C]56[/C][C]3.19509090513467[/C][/ROW]
[ROW][C]57[/C][C]3.44534555205390[/C][/ROW]
[ROW][C]58[/C][C]3.64355900783353[/C][/ROW]
[ROW][C]59[/C][C]4.06698295696511[/C][/ROW]
[ROW][C]60[/C][C]5.59463894145225[/C][/ROW]
[ROW][C]61[/C][C]5.8267746830853[/C][/ROW]
[ROW][C]62[/C][C]6.88175250110305[/C][/ROW]
[ROW][C]63[/C][C]9.70862102092983[/C][/ROW]
[ROW][C]64[/C][C]15.4039068180576[/C][/ROW]
[ROW][C]65[/C][C]19.8531275410825[/C][/ROW]
[ROW][C]66[/C][C]43.2281617282275[/C][/ROW]
[ROW][C]67[/C][C]67.7424480270375[/C][/ROW]
[/TABLE]
Source: https://freestatistics.org/blog/index.php?pk=23825&T=1

Globally Unique Identifier (entire table): ba.freestatistics.org/blog/index.php?pk=23825&T=1

As an alternative you can also use a QR Code:  

The GUIDs for individual cells are displayed in the table below:

Summary of Dendrogram
LabelHeight
10.100000000000001
20.223606797749979
30.244948974278317
40.244948974278319
50.264575131106458
60.264575131106459
70.264575131106459
80.299999999999999
90.3
100.3
110.316227766016838
120.331662479035541
130.342748397307029
140.374165738677394
150.374165738677394
160.408373564811525
170.412310562561767
180.424264068711928
190.424264068711929
200.446997771328569
210.458257569495584
220.469041575982341
230.469524710480307
240.479583152331272
250.489897948556637
260.506703755354307
270.509901951359278
280.519615242270663
290.529150262212917
300.549756504215212
310.58309518948453
320.601193054381847
330.625364443177159
340.69282032302755
350.75854983860728
360.764346153407554
370.874894852719657
380.9
390.92342908365426
400.998250683519863
411.04880884817015
421.08050887433043
431.10118752132012
441.14873825261602
451.24027801901337
461.24908251837519
471.25753333603068
481.44195190309986
491.67367366872872
501.92568014123052
512.22930774150466
522.33744535025621
532.70715961587731
542.88724394997001
552.93938958178743
563.19509090513467
573.44534555205390
583.64355900783353
594.06698295696511
605.59463894145225
615.8267746830853
626.88175250110305
639.70862102092983
6415.4039068180576
6519.8531275410825
6643.2281617282275
6767.7424480270375


Parameters (Session):
par1 = ward ; par2 = ALL ; par3 = FALSE ; par4 = FALSE ;
Parameters (R input):
par1 = ward ; par2 = ALL ; par3 = FALSE ; par4 = FALSE ;
R code (references can be found in the software module):
par3 <- as.logical(par3)
par4 <- as.logical(par4)
if (par3 == 'TRUE'){
dum = xlab
xlab = ylab
ylab = dum
}
x <- t(y)
hc <- hclust(dist(x),method=par1)
d <- as.dendrogram(hc)
str(d)
mysub <- paste('Method: ',par1)
bitmap(file='test1.png')
if (par4 == 'TRUE'){
plot(d,main=main,ylab=ylab,xlab=xlab,horiz=par3, nodePar=list(pch = c(1,NA), cex=0.8, lab.cex = 0.8),type='t',center=T, sub=mysub)
} else {
plot(d,main=main,ylab=ylab,xlab=xlab,horiz=par3, nodePar=list(pch = c(1,NA), cex=0.8, lab.cex = 0.8), sub=mysub)
}
dev.off()
if (par2 != 'ALL'){
if (par3 == 'TRUE'){
ylab = 'cluster'
} else {
xlab = 'cluster'
}
par2 <- as.numeric(par2)
memb <- cutree(hc, k = par2)
cent <- NULL
for(k in 1:par2){
cent <- rbind(cent, colMeans(x[memb == k, , drop = FALSE]))
}
hc1 <- hclust(dist(cent),method=par1, members = table(memb))
de <- as.dendrogram(hc1)
bitmap(file='test2.png')
if (par4 == 'TRUE'){
plot(de,main=main,ylab=ylab,xlab=xlab,horiz=par3, nodePar=list(pch = c(1,NA), cex=0.8, lab.cex = 0.8),type='t',center=T, sub=mysub)
} else {
plot(de,main=main,ylab=ylab,xlab=xlab,horiz=par3, nodePar=list(pch = c(1,NA), cex=0.8, lab.cex = 0.8), sub=mysub)
}
dev.off()
str(de)
}
load(file='createtable')
a<-table.start()
a<-table.row.start(a)
a<-table.element(a,'Summary of Dendrogram',2,TRUE)
a<-table.row.end(a)
a<-table.row.start(a)
a<-table.element(a,'Label',header=TRUE)
a<-table.element(a,'Height',header=TRUE)
a<-table.row.end(a)
num <- length(x[,1])-1
for (i in 1:num)
{
a<-table.row.start(a)
a<-table.element(a,hc$labels[i])
a<-table.element(a,hc$height[i])
a<-table.row.end(a)
}
a<-table.end(a)
table.save(a,file='mytable1.tab')
if (par2 != 'ALL'){
a<-table.start()
a<-table.row.start(a)
a<-table.element(a,'Summary of Cut Dendrogram',2,TRUE)
a<-table.row.end(a)
a<-table.row.start(a)
a<-table.element(a,'Label',header=TRUE)
a<-table.element(a,'Height',header=TRUE)
a<-table.row.end(a)
num <- par2-1
for (i in 1:num)
{
a<-table.row.start(a)
a<-table.element(a,i)
a<-table.element(a,hc1$height[i])
a<-table.row.end(a)
}
a<-table.end(a)
table.save(a,file='mytable2.tab')
}