Free Statistics

of Irreproducible Research!

Author's title

Author*The author of this computation has been verified*
R Software Modulerwasp_hierarchicalclustering.wasp
Title produced by softwareHierarchical Clustering
Date of computationTue, 11 Nov 2008 10:38:58 -0700
Cite this page as followsStatistical Computations at FreeStatistics.org, Office for Research Development and Education, URL https://freestatistics.org/blog/index.php?v=date/2008/Nov/11/t12264251961w5yn33pr8a0fm7.htm/, Retrieved Mon, 20 May 2024 01:53:14 +0000
Statistical Computations at FreeStatistics.org, Office for Research Development and Education, URL https://freestatistics.org/blog/index.php?pk=23770, Retrieved Mon, 20 May 2024 01:53:14 +0000
QR Codes:

Original text written by user:
IsPrivate?No (this computation is public)
User-defined keywords
Estimated Impact161
Family? (F = Feedback message, R = changed R code, M = changed R Module, P = changed Parameters, D = changed Data)
-     [Maximum-likelihood Fitting - Normal Distribution] [Workshop 2 Questi...] [2007-10-19 09:11:23] [5babdb52c730cb807dd08aeebb84155b]
F RMPD    [Hierarchical Clustering] [Various EDA topic...] [2008-11-11 17:38:58] [a9e6d7cd6e144e8b311d9f96a24c5a25] [Current]
Feedback Forum
2008-11-15 15:47:53 [Laura Reussens] [reply
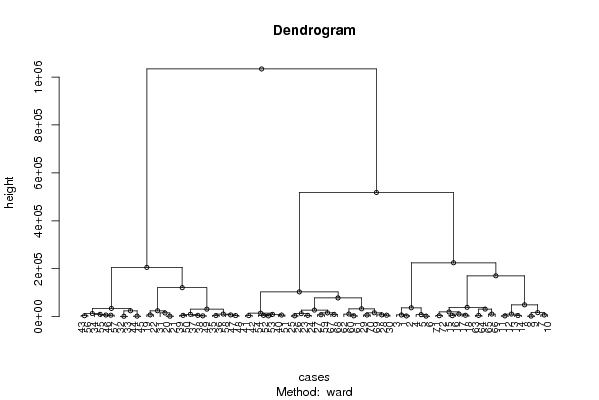
Een dendrogram is een diagram met een boomstructuur, het geeft verbanden tussen verschillende gegevens weer. De datareeks wordt opgesplist in 2 delen en verder opgedeeld, de gegevens die zich onder eenzelde tak bevinden vertonen sterke gelijkenissen.
Doordat het dendrogram sterk vertakt is kunnen we besluiten dat er verschillende verbanden weergegeven kunnen worden.
Op het dendrogram kunnen aflezen dat in de 2 clusters ongeveer dezelde gegevens zitten, hierdoor is het moeilijk om op het zicht specifieke verbanden vast te stellen.

2008-11-19 14:23:47 [Sam De Cuyper] [reply
Ook hier weer enkel de berekening zonder interpretatie. Bij hierarchical clustering begint men bovenaan vanuit het knooppunt. Van daaruit ontspringen 2 aparte takken die perioden bevatten die gelijkaardig zijn. Je zou kunnen zeggen dat de gegevens links anders zijn dan de gegevens rechts, die daarop volgen. Bij de clustering worden de gegevens telkens naar beneden toe opgesplitst tot ze helemaal onderaan de periodes allemaal apart weergeeft. We gebruiken deze methode louter als exploratief instrument.
2008-11-24 14:26:41 [Jessica Alves Pires] [reply
Juiste berekening, geen uitleg. Voor de uitleg verwijs ik naar Laura en Sam, ik heb er niets aan toe te voegen.
2008-11-24 14:54:58 [Birgit Van Dyck] [reply
De student heeft een juiste berekening gemaakt. Bij een dendrogram worden de gegevens opgesplitst in 2 delen en daarna staads verder opgesplits. De gegevens onder eenzelfde tak zijn gelijkaardig. Een dendrogram wordt louter exploratief gebruikt, het is moeilijk om specifieke verbanden vast te stellen.

Post a new message
Dataseries X:
220206	255843	113012
220115	254490	110452
218444	251995	107005
214912	246339	102841
210705	244019	98173
209673	245953	98181
237041	279806	137277
242081	283111	147579
241878	281097	146571
242621	275964	138920
238545	270694	130340
240337	271901	128140
244752	274412	127059
244576	272433	122860
241572	268361	117702
240541	268586	113537
236089	264768	108366
236997	269974	111078
264579	304744	150739
270349	309365	159129
269645	308347	157928
267037	298427	147768
258113	289231	137507
262813	291975	136919
267413	294912	136151
267366	293488	133001
264777	290555	125554
258863	284736	119647
254844	281818	114158
254868	287854	116193
277267	316263	152803
285351	325412	161761
286602	326011	160942
283042	328282	149470
276687	317480	139208
277915	317539	134588
277128	313737	130322
277103	312276	126611
275037	309391	122401
270150	302950	117352
267140	300316	112135
264993	304035	112879
287259	333476	148729
291186	337698	157230
292300	335932	157221
288186	323931	146681
281477	313927	136524
282656	314485	132111
280190	313218	125326
280408	309664	122716
276836	302963	116615
275216	298989	113719
274352	298423	110737
271311	301631	112093
289802	329765	143565
290726	335083	149946
292300	327616	149147
278506	309119	134339
269826	295916	122683
265861	291413	115614
269034	291542	116566
264176	284678	111272
255198	276475	104609
253353	272566	101802
246057	264981	94542
235372	263290	93051
258556	296806	124129
260993	303598	130374
254663	286994	123946
250643	276427	114971
243422	266424	105531
247105	267153	104919


Summary of computational transaction
Raw Inputview raw input (R code)
Raw Outputview raw output of R engine
Computing time1 seconds
R Server'Gwilym Jenkins' @ 72.249.127.135

\begin{tabular}{lllllllll}
\hline
Summary of computational transaction \tabularnewline
Raw Input & view raw input (R code)  \tabularnewline
Raw Output & view raw output of R engine  \tabularnewline
Computing time & 1 seconds \tabularnewline
R Server & 'Gwilym Jenkins' @ 72.249.127.135 \tabularnewline
\hline
\end{tabular}
%Source: https://freestatistics.org/blog/index.php?pk=23770&T=0

[TABLE]
[ROW][C]Summary of computational transaction[/C][/ROW]
[ROW][C]Raw Input[/C][C]view raw input (R code) [/C][/ROW]
[ROW][C]Raw Output[/C][C]view raw output of R engine [/C][/ROW]
[ROW][C]Computing time[/C][C]1 seconds[/C][/ROW]
[ROW][C]R Server[/C][C]'Gwilym Jenkins' @ 72.249.127.135[/C][/ROW]
[/TABLE]
Source: https://freestatistics.org/blog/index.php?pk=23770&T=0

Globally Unique Identifier (entire table): ba.freestatistics.org/blog/index.php?pk=23770&T=0

As an alternative you can also use a QR Code:  

The GUIDs for individual cells are displayed in the table below:

Summary of computational transaction
Raw Inputview raw input (R code)
Raw Outputview raw output of R engine
Computing time1 seconds
R Server'Gwilym Jenkins' @ 72.249.127.135


Summary of Dendrogram
LabelHeight
11610.76472521595
21724.62778592947
32088.02131215177
42192.13229527782
52261.29807853808
62896.97946143910
73083.52282300618
83155.81621771611
93315.24870861901
103457.23661325053
113473.92544537156
123804.00762354651
134010.43975144871
144296.60458967311
154358.22280293241
164601.73597678094
174645.32216320892
184780.78079397079
195153.98438103959
205355.3217830011
215387.15091676482
225422.64922550437
235474.05516961603
245939.85218671307
256048.5847104922
266132.86760007095
276726.50979334751
286844.20850000814
296882.7502497185
306971.14144168658
316980.82941756527
327265.81533003702
337400.88467684776
347438.05929075072
357904.13581614081
368416.52086601994
379460.71378501118
389543.0738234596
399615.26551881955
409695.42475176635
4110849.9767991826
4210865.9287517023
4310920.2466547235
4410978.5232829877
4510982.5461823908
4612446.9427696769
4712931.9815605633
4814575.5578765118
4915267.8109159870
5015650.4380164257
5116087.5767486918
5216871.7064102396
5319543.1406420316
5424579.793639112
5524629.5996854071
5627378.0906619471
5731415.0051399714
5831513.6585901281
5932713.0421068379
6034291.5377105109
6137065.8324316431
6238833.8512148495
6349369.5995801385
6478252.6391339217
65103392.023912917
66121107.672542493
67170505.372734214
68205568.975910331
69224878.397422794
70518327.122981787
711033866.02738436

\begin{tabular}{lllllllll}
\hline
Summary of Dendrogram \tabularnewline
Label & Height \tabularnewline
1 & 1610.76472521595 \tabularnewline
2 & 1724.62778592947 \tabularnewline
3 & 2088.02131215177 \tabularnewline
4 & 2192.13229527782 \tabularnewline
5 & 2261.29807853808 \tabularnewline
6 & 2896.97946143910 \tabularnewline
7 & 3083.52282300618 \tabularnewline
8 & 3155.81621771611 \tabularnewline
9 & 3315.24870861901 \tabularnewline
10 & 3457.23661325053 \tabularnewline
11 & 3473.92544537156 \tabularnewline
12 & 3804.00762354651 \tabularnewline
13 & 4010.43975144871 \tabularnewline
14 & 4296.60458967311 \tabularnewline
15 & 4358.22280293241 \tabularnewline
16 & 4601.73597678094 \tabularnewline
17 & 4645.32216320892 \tabularnewline
18 & 4780.78079397079 \tabularnewline
19 & 5153.98438103959 \tabularnewline
20 & 5355.3217830011 \tabularnewline
21 & 5387.15091676482 \tabularnewline
22 & 5422.64922550437 \tabularnewline
23 & 5474.05516961603 \tabularnewline
24 & 5939.85218671307 \tabularnewline
25 & 6048.5847104922 \tabularnewline
26 & 6132.86760007095 \tabularnewline
27 & 6726.50979334751 \tabularnewline
28 & 6844.20850000814 \tabularnewline
29 & 6882.7502497185 \tabularnewline
30 & 6971.14144168658 \tabularnewline
31 & 6980.82941756527 \tabularnewline
32 & 7265.81533003702 \tabularnewline
33 & 7400.88467684776 \tabularnewline
34 & 7438.05929075072 \tabularnewline
35 & 7904.13581614081 \tabularnewline
36 & 8416.52086601994 \tabularnewline
37 & 9460.71378501118 \tabularnewline
38 & 9543.0738234596 \tabularnewline
39 & 9615.26551881955 \tabularnewline
40 & 9695.42475176635 \tabularnewline
41 & 10849.9767991826 \tabularnewline
42 & 10865.9287517023 \tabularnewline
43 & 10920.2466547235 \tabularnewline
44 & 10978.5232829877 \tabularnewline
45 & 10982.5461823908 \tabularnewline
46 & 12446.9427696769 \tabularnewline
47 & 12931.9815605633 \tabularnewline
48 & 14575.5578765118 \tabularnewline
49 & 15267.8109159870 \tabularnewline
50 & 15650.4380164257 \tabularnewline
51 & 16087.5767486918 \tabularnewline
52 & 16871.7064102396 \tabularnewline
53 & 19543.1406420316 \tabularnewline
54 & 24579.793639112 \tabularnewline
55 & 24629.5996854071 \tabularnewline
56 & 27378.0906619471 \tabularnewline
57 & 31415.0051399714 \tabularnewline
58 & 31513.6585901281 \tabularnewline
59 & 32713.0421068379 \tabularnewline
60 & 34291.5377105109 \tabularnewline
61 & 37065.8324316431 \tabularnewline
62 & 38833.8512148495 \tabularnewline
63 & 49369.5995801385 \tabularnewline
64 & 78252.6391339217 \tabularnewline
65 & 103392.023912917 \tabularnewline
66 & 121107.672542493 \tabularnewline
67 & 170505.372734214 \tabularnewline
68 & 205568.975910331 \tabularnewline
69 & 224878.397422794 \tabularnewline
70 & 518327.122981787 \tabularnewline
71 & 1033866.02738436 \tabularnewline
\hline
\end{tabular}
%Source: https://freestatistics.org/blog/index.php?pk=23770&T=1

[TABLE]
[ROW][C]Summary of Dendrogram[/C][/ROW]
[ROW][C]Label[/C][C]Height[/C][/ROW]
[ROW][C]1[/C][C]1610.76472521595[/C][/ROW]
[ROW][C]2[/C][C]1724.62778592947[/C][/ROW]
[ROW][C]3[/C][C]2088.02131215177[/C][/ROW]
[ROW][C]4[/C][C]2192.13229527782[/C][/ROW]
[ROW][C]5[/C][C]2261.29807853808[/C][/ROW]
[ROW][C]6[/C][C]2896.97946143910[/C][/ROW]
[ROW][C]7[/C][C]3083.52282300618[/C][/ROW]
[ROW][C]8[/C][C]3155.81621771611[/C][/ROW]
[ROW][C]9[/C][C]3315.24870861901[/C][/ROW]
[ROW][C]10[/C][C]3457.23661325053[/C][/ROW]
[ROW][C]11[/C][C]3473.92544537156[/C][/ROW]
[ROW][C]12[/C][C]3804.00762354651[/C][/ROW]
[ROW][C]13[/C][C]4010.43975144871[/C][/ROW]
[ROW][C]14[/C][C]4296.60458967311[/C][/ROW]
[ROW][C]15[/C][C]4358.22280293241[/C][/ROW]
[ROW][C]16[/C][C]4601.73597678094[/C][/ROW]
[ROW][C]17[/C][C]4645.32216320892[/C][/ROW]
[ROW][C]18[/C][C]4780.78079397079[/C][/ROW]
[ROW][C]19[/C][C]5153.98438103959[/C][/ROW]
[ROW][C]20[/C][C]5355.3217830011[/C][/ROW]
[ROW][C]21[/C][C]5387.15091676482[/C][/ROW]
[ROW][C]22[/C][C]5422.64922550437[/C][/ROW]
[ROW][C]23[/C][C]5474.05516961603[/C][/ROW]
[ROW][C]24[/C][C]5939.85218671307[/C][/ROW]
[ROW][C]25[/C][C]6048.5847104922[/C][/ROW]
[ROW][C]26[/C][C]6132.86760007095[/C][/ROW]
[ROW][C]27[/C][C]6726.50979334751[/C][/ROW]
[ROW][C]28[/C][C]6844.20850000814[/C][/ROW]
[ROW][C]29[/C][C]6882.7502497185[/C][/ROW]
[ROW][C]30[/C][C]6971.14144168658[/C][/ROW]
[ROW][C]31[/C][C]6980.82941756527[/C][/ROW]
[ROW][C]32[/C][C]7265.81533003702[/C][/ROW]
[ROW][C]33[/C][C]7400.88467684776[/C][/ROW]
[ROW][C]34[/C][C]7438.05929075072[/C][/ROW]
[ROW][C]35[/C][C]7904.13581614081[/C][/ROW]
[ROW][C]36[/C][C]8416.52086601994[/C][/ROW]
[ROW][C]37[/C][C]9460.71378501118[/C][/ROW]
[ROW][C]38[/C][C]9543.0738234596[/C][/ROW]
[ROW][C]39[/C][C]9615.26551881955[/C][/ROW]
[ROW][C]40[/C][C]9695.42475176635[/C][/ROW]
[ROW][C]41[/C][C]10849.9767991826[/C][/ROW]
[ROW][C]42[/C][C]10865.9287517023[/C][/ROW]
[ROW][C]43[/C][C]10920.2466547235[/C][/ROW]
[ROW][C]44[/C][C]10978.5232829877[/C][/ROW]
[ROW][C]45[/C][C]10982.5461823908[/C][/ROW]
[ROW][C]46[/C][C]12446.9427696769[/C][/ROW]
[ROW][C]47[/C][C]12931.9815605633[/C][/ROW]
[ROW][C]48[/C][C]14575.5578765118[/C][/ROW]
[ROW][C]49[/C][C]15267.8109159870[/C][/ROW]
[ROW][C]50[/C][C]15650.4380164257[/C][/ROW]
[ROW][C]51[/C][C]16087.5767486918[/C][/ROW]
[ROW][C]52[/C][C]16871.7064102396[/C][/ROW]
[ROW][C]53[/C][C]19543.1406420316[/C][/ROW]
[ROW][C]54[/C][C]24579.793639112[/C][/ROW]
[ROW][C]55[/C][C]24629.5996854071[/C][/ROW]
[ROW][C]56[/C][C]27378.0906619471[/C][/ROW]
[ROW][C]57[/C][C]31415.0051399714[/C][/ROW]
[ROW][C]58[/C][C]31513.6585901281[/C][/ROW]
[ROW][C]59[/C][C]32713.0421068379[/C][/ROW]
[ROW][C]60[/C][C]34291.5377105109[/C][/ROW]
[ROW][C]61[/C][C]37065.8324316431[/C][/ROW]
[ROW][C]62[/C][C]38833.8512148495[/C][/ROW]
[ROW][C]63[/C][C]49369.5995801385[/C][/ROW]
[ROW][C]64[/C][C]78252.6391339217[/C][/ROW]
[ROW][C]65[/C][C]103392.023912917[/C][/ROW]
[ROW][C]66[/C][C]121107.672542493[/C][/ROW]
[ROW][C]67[/C][C]170505.372734214[/C][/ROW]
[ROW][C]68[/C][C]205568.975910331[/C][/ROW]
[ROW][C]69[/C][C]224878.397422794[/C][/ROW]
[ROW][C]70[/C][C]518327.122981787[/C][/ROW]
[ROW][C]71[/C][C]1033866.02738436[/C][/ROW]
[/TABLE]
Source: https://freestatistics.org/blog/index.php?pk=23770&T=1

Globally Unique Identifier (entire table): ba.freestatistics.org/blog/index.php?pk=23770&T=1

As an alternative you can also use a QR Code:  

The GUIDs for individual cells are displayed in the table below:

Summary of Dendrogram
LabelHeight
11610.76472521595
21724.62778592947
32088.02131215177
42192.13229527782
52261.29807853808
62896.97946143910
73083.52282300618
83155.81621771611
93315.24870861901
103457.23661325053
113473.92544537156
123804.00762354651
134010.43975144871
144296.60458967311
154358.22280293241
164601.73597678094
174645.32216320892
184780.78079397079
195153.98438103959
205355.3217830011
215387.15091676482
225422.64922550437
235474.05516961603
245939.85218671307
256048.5847104922
266132.86760007095
276726.50979334751
286844.20850000814
296882.7502497185
306971.14144168658
316980.82941756527
327265.81533003702
337400.88467684776
347438.05929075072
357904.13581614081
368416.52086601994
379460.71378501118
389543.0738234596
399615.26551881955
409695.42475176635
4110849.9767991826
4210865.9287517023
4310920.2466547235
4410978.5232829877
4510982.5461823908
4612446.9427696769
4712931.9815605633
4814575.5578765118
4915267.8109159870
5015650.4380164257
5116087.5767486918
5216871.7064102396
5319543.1406420316
5424579.793639112
5524629.5996854071
5627378.0906619471
5731415.0051399714
5831513.6585901281
5932713.0421068379
6034291.5377105109
6137065.8324316431
6238833.8512148495
6349369.5995801385
6478252.6391339217
65103392.023912917
66121107.672542493
67170505.372734214
68205568.975910331
69224878.397422794
70518327.122981787
711033866.02738436


Parameters (Session):
par1 = ward ; par2 = ALL ; par3 = FALSE ; par4 = FALSE ;
Parameters (R input):
par1 = ward ; par2 = ALL ; par3 = FALSE ; par4 = FALSE ;
R code (references can be found in the software module):
par3 <- as.logical(par3)
par4 <- as.logical(par4)
if (par3 == 'TRUE'){
dum = xlab
xlab = ylab
ylab = dum
}
x <- t(y)
hc <- hclust(dist(x),method=par1)
d <- as.dendrogram(hc)
str(d)
mysub <- paste('Method: ',par1)
bitmap(file='test1.png')
if (par4 == 'TRUE'){
plot(d,main=main,ylab=ylab,xlab=xlab,horiz=par3, nodePar=list(pch = c(1,NA), cex=0.8, lab.cex = 0.8),type='t',center=T, sub=mysub)
} else {
plot(d,main=main,ylab=ylab,xlab=xlab,horiz=par3, nodePar=list(pch = c(1,NA), cex=0.8, lab.cex = 0.8), sub=mysub)
}
dev.off()
if (par2 != 'ALL'){
if (par3 == 'TRUE'){
ylab = 'cluster'
} else {
xlab = 'cluster'
}
par2 <- as.numeric(par2)
memb <- cutree(hc, k = par2)
cent <- NULL
for(k in 1:par2){
cent <- rbind(cent, colMeans(x[memb == k, , drop = FALSE]))
}
hc1 <- hclust(dist(cent),method=par1, members = table(memb))
de <- as.dendrogram(hc1)
bitmap(file='test2.png')
if (par4 == 'TRUE'){
plot(de,main=main,ylab=ylab,xlab=xlab,horiz=par3, nodePar=list(pch = c(1,NA), cex=0.8, lab.cex = 0.8),type='t',center=T, sub=mysub)
} else {
plot(de,main=main,ylab=ylab,xlab=xlab,horiz=par3, nodePar=list(pch = c(1,NA), cex=0.8, lab.cex = 0.8), sub=mysub)
}
dev.off()
str(de)
}
load(file='createtable')
a<-table.start()
a<-table.row.start(a)
a<-table.element(a,'Summary of Dendrogram',2,TRUE)
a<-table.row.end(a)
a<-table.row.start(a)
a<-table.element(a,'Label',header=TRUE)
a<-table.element(a,'Height',header=TRUE)
a<-table.row.end(a)
num <- length(x[,1])-1
for (i in 1:num)
{
a<-table.row.start(a)
a<-table.element(a,hc$labels[i])
a<-table.element(a,hc$height[i])
a<-table.row.end(a)
}
a<-table.end(a)
table.save(a,file='mytable1.tab')
if (par2 != 'ALL'){
a<-table.start()
a<-table.row.start(a)
a<-table.element(a,'Summary of Cut Dendrogram',2,TRUE)
a<-table.row.end(a)
a<-table.row.start(a)
a<-table.element(a,'Label',header=TRUE)
a<-table.element(a,'Height',header=TRUE)
a<-table.row.end(a)
num <- par2-1
for (i in 1:num)
{
a<-table.row.start(a)
a<-table.element(a,i)
a<-table.element(a,hc1$height[i])
a<-table.row.end(a)
}
a<-table.end(a)
table.save(a,file='mytable2.tab')
}