Free Statistics

of Irreproducible Research!

Author's title

Author*The author of this computation has been verified*
R Software Modulerwasp_boxcoxnorm.wasp
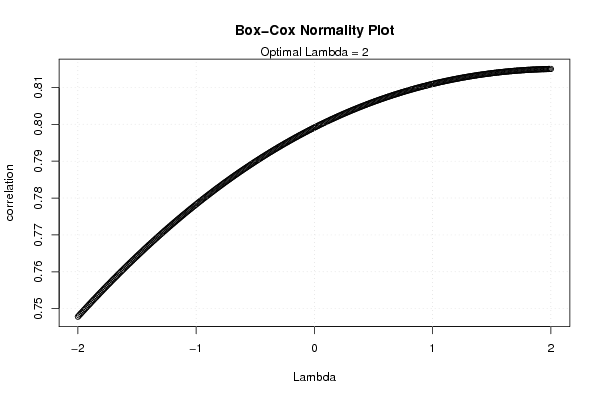
Title produced by softwareBox-Cox Normality Plot
Date of computationSun, 09 Nov 2008 12:02:40 -0700
Cite this page as followsStatistical Computations at FreeStatistics.org, Office for Research Development and Education, URL https://freestatistics.org/blog/index.php?v=date/2008/Nov/09/t1226257412fwqyz9ip0jskh1z.htm/, Retrieved Wed, 15 May 2024 05:26:57 +0000
Statistical Computations at FreeStatistics.org, Office for Research Development and Education, URL https://freestatistics.org/blog/index.php?pk=22821, Retrieved Wed, 15 May 2024 05:26:57 +0000
QR Codes:

Original text written by user:
IsPrivate?No (this computation is public)
User-defined keywords
Estimated Impact161
Family? (F = Feedback message, R = changed R code, M = changed R Module, P = changed Parameters, D = changed Data)
-     [Box-Cox Normality Plot] [Box cox normality...] [2007-11-05 10:07:15] [76acd2a07599dda8f6e62381bea67e8b]
F    D    [Box-Cox Normality Plot] [Various EDA Topic...] [2008-11-09 19:02:40] [0831954c833179c36e9320daee0825b5] [Current]
Feedback Forum
2008-11-14 12:38:38 [Ken Van den Heuvel] [reply
We zien we geen extremum op de grafiek, de resultaten zijn dus niet vatbaar voor conclusie.
2008-11-19 12:32:58 [Bob Leysen] [reply
Er wordt geen extremum bereikt op de grafiek, bijgevolg zijn de resultaten niet vatbaar voor conclusie.
Je zou kunnen discussiëren of er op het einde geen maximum bereikt word, maar aangezien de grafiek daar stopt kan je dit niet met zekerheid zeggen.

Door toepassing van de Box Cox normality plot zien we dat onze grafiek nog steeds geen rechte vertoont.
2008-11-21 15:38:36 [Stijn Van de Velde] [reply
Er is twijfel of we al dan niet een maximum zien. Het zou kunnen dat de grafiek na lambda 2 inderdaad terug begint te dalen, en we in 2 dus een maximum hebben, maar dat kan je niet met zekerheid zeggen.

We kunnen dus best besluiten dat we geen conclusie kunnen trekken.

Post a new message
Dataseries X:
12055
12113
9617
12646
13581
12162
10970
11880
11888
12927
12300
12093
12381
12197
9455
13168
13428
11981
11885
11692
12234
14341
13131
12421
14286
12865
11160
14316
14389
14014
13419
12770
13316
15333
14243
13824
14963
13203
12199
15509
14200
15170
14058
13786
14148
16542
13588
15582
15803
14131
12923
15612
16034
16037
14038
15331
15038
17402
14993
16044
16930
15921
14417
15961
17852
16484
14216
17430
17840
17629


Summary of computational transaction
Raw Inputview raw input (R code)
Raw Outputview raw output of R engine
Computing time2 seconds
R Server'Gwilym Jenkins' @ 72.249.127.135

\begin{tabular}{lllllllll}
\hline
Summary of computational transaction \tabularnewline
Raw Input & view raw input (R code)  \tabularnewline
Raw Output & view raw output of R engine  \tabularnewline
Computing time & 2 seconds \tabularnewline
R Server & 'Gwilym Jenkins' @ 72.249.127.135 \tabularnewline
\hline
\end{tabular}
%Source: https://freestatistics.org/blog/index.php?pk=22821&T=0

[TABLE]
[ROW][C]Summary of computational transaction[/C][/ROW]
[ROW][C]Raw Input[/C][C]view raw input (R code) [/C][/ROW]
[ROW][C]Raw Output[/C][C]view raw output of R engine [/C][/ROW]
[ROW][C]Computing time[/C][C]2 seconds[/C][/ROW]
[ROW][C]R Server[/C][C]'Gwilym Jenkins' @ 72.249.127.135[/C][/ROW]
[/TABLE]
Source: https://freestatistics.org/blog/index.php?pk=22821&T=0

Globally Unique Identifier (entire table): ba.freestatistics.org/blog/index.php?pk=22821&T=0

As an alternative you can also use a QR Code:  

The GUIDs for individual cells are displayed in the table below:

Summary of computational transaction
Raw Inputview raw input (R code)
Raw Outputview raw output of R engine
Computing time2 seconds
R Server'Gwilym Jenkins' @ 72.249.127.135


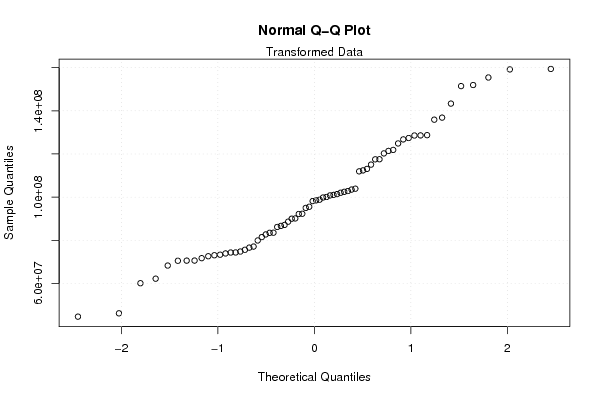
Box-Cox Normality Plot
# observations x70
maximum correlation0.815012029577073
optimal lambda2

\begin{tabular}{lllllllll}
\hline
Box-Cox Normality Plot \tabularnewline
# observations x & 70 \tabularnewline
maximum correlation & 0.815012029577073 \tabularnewline
optimal lambda & 2 \tabularnewline
\hline
\end{tabular}
%Source: https://freestatistics.org/blog/index.php?pk=22821&T=1

[TABLE]
[ROW][C]Box-Cox Normality Plot[/C][/ROW]
[ROW][C]# observations x[/C][C]70[/C][/ROW]
[ROW][C]maximum correlation[/C][C]0.815012029577073[/C][/ROW]
[ROW][C]optimal lambda[/C][C]2[/C][/ROW]
[/TABLE]
Source: https://freestatistics.org/blog/index.php?pk=22821&T=1

Globally Unique Identifier (entire table): ba.freestatistics.org/blog/index.php?pk=22821&T=1

As an alternative you can also use a QR Code:  

The GUIDs for individual cells are displayed in the table below:

Box-Cox Normality Plot
# observations x70
maximum correlation0.815012029577073
optimal lambda2


Parameters (Session):
Parameters (R input):
R code (references can be found in the software module):
n <- length(x)
c <- array(NA,dim=c(401))
l <- array(NA,dim=c(401))
mx <- 0
mxli <- -999
for (i in 1:401)
{
l[i] <- (i-201)/100
if (l[i] != 0)
{
x1 <- (x^l[i] - 1) / l[i]
} else {
x1 <- log(x)
}
c[i] <- cor(qnorm(ppoints(x), mean=0, sd=1),x1)
if (mx < c[i])
{
mx <- c[i]
mxli <- l[i]
}
}
c
mx
mxli
if (mxli != 0)
{
x1 <- (x^mxli - 1) / mxli
} else {
x1 <- log(x)
}
bitmap(file='test1.png')
plot(l,c,main='Box-Cox Normality Plot',xlab='Lambda',ylab='correlation')
mtext(paste('Optimal Lambda =',mxli))
grid()
dev.off()
bitmap(file='test2.png')
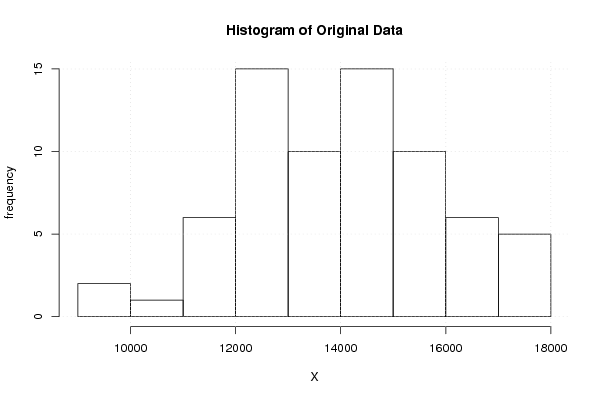
hist(x,main='Histogram of Original Data',xlab='X',ylab='frequency')
grid()
dev.off()
bitmap(file='test3.png')
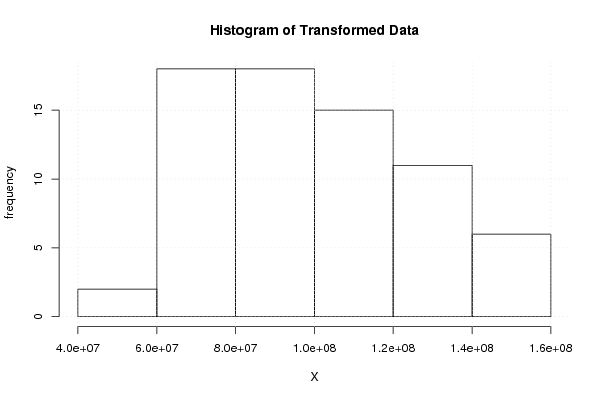
hist(x1,main='Histogram of Transformed Data',xlab='X',ylab='frequency')
grid()
dev.off()
bitmap(file='test4.png')
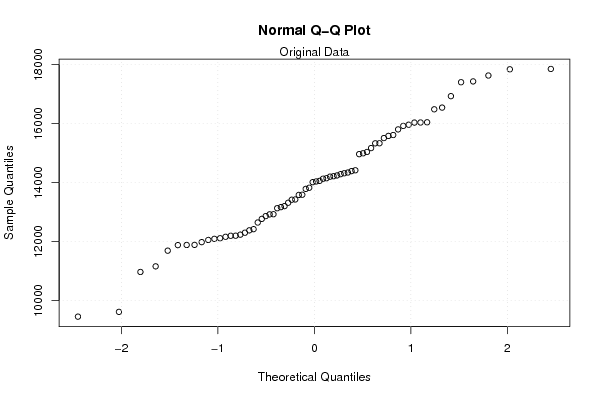
qqnorm(x)
grid()
mtext('Original Data')
dev.off()
bitmap(file='test5.png')
qqnorm(x1)
grid()
mtext('Transformed Data')
dev.off()
load(file='createtable')
a<-table.start()
a<-table.row.start(a)
a<-table.element(a,'Box-Cox Normality Plot',2,TRUE)
a<-table.row.end(a)
a<-table.row.start(a)
a<-table.element(a,'# observations x',header=TRUE)
a<-table.element(a,n)
a<-table.row.end(a)
a<-table.row.start(a)
a<-table.element(a,'maximum correlation',header=TRUE)
a<-table.element(a,mx)
a<-table.row.end(a)
a<-table.row.start(a)
a<-table.element(a,'optimal lambda',header=TRUE)
a<-table.element(a,mxli)
a<-table.row.end(a)
a<-table.end(a)
table.save(a,file='mytable.tab')