Free Statistics

of Irreproducible Research!

Author's title

Author*The author of this computation has been verified*
R Software Modulerwasp_hierarchicalclustering.wasp
Title produced by softwareHierarchical Clustering
Date of computationSun, 09 Nov 2008 11:17:28 -0700
Cite this page as followsStatistical Computations at FreeStatistics.org, Office for Research Development and Education, URL https://freestatistics.org/blog/index.php?v=date/2008/Nov/09/t1226254682zusjzw0okcdddzm.htm/, Retrieved Wed, 15 May 2024 07:20:05 +0000
Statistical Computations at FreeStatistics.org, Office for Research Development and Education, URL https://freestatistics.org/blog/index.php?pk=22807, Retrieved Wed, 15 May 2024 07:20:05 +0000
QR Codes:

Original text written by user:
IsPrivate?No (this computation is public)
User-defined keywords
Estimated Impact186
Family? (F = Feedback message, R = changed R code, M = changed R Module, P = changed Parameters, D = changed Data)
-     [Bivariate Kernel Density Estimation] [Q1 Bivariate Dens...] [2007-11-03 14:50:57] [e2ec4dc832988c648c062d4cdc574d44]
- RMPD  [Hierarchical Clustering] [WS4 Q2 dendrogram] [2007-11-05 10:02:49] [74be16979710d4c4e7c6647856088456]
F R  D    [Hierarchical Clustering] [eda various topic...] [2008-11-04 19:43:54] [077ffec662d24c06be4c491541a44245]
F    D        [Hierarchical Clustering] [] [2008-11-09 18:17:28] [6d40a467de0f28bd2350f82ac9522c51] [Current]
F RMPD          [Star Plot] [] [2008-11-09 18:25:13] [4c8dfb519edec2da3492d7e6be9a5685]
Feedback Forum
2008-11-19 14:30:21 [2df1bcd103d52957f4a39bd4617794c8] [reply
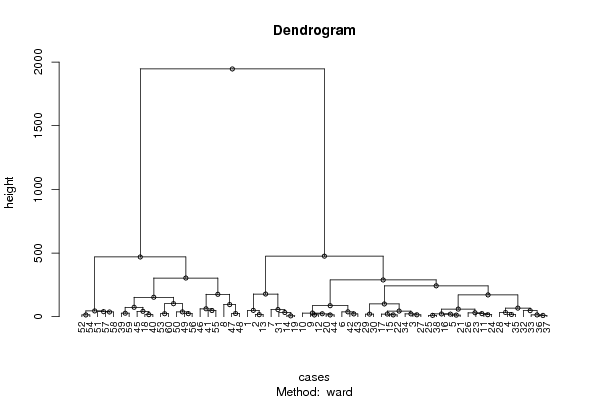
Student gebruikt correct de Hierarchical Clustering methode.

We noteren dat de gegevens sterk zijn verdeeld in 2 grote groepen. Vervolgens kan je blijven opdelen tot je bij een observatie uitkomt.

Deze methode is exploratief om gegevens te verkennen maar niet optimaal om toe te passen op tijdsreeksen.
2008-11-22 12:49:52 [Jeroen Michel] [reply
De student heeft een correcte methode toegepast en heeft deze uitgewerkt. Hij beschrijft deze methode en conclusie correct in zijn analyse.

Het is wel degelijk de bedoeling van deze werkwijze om opsplitsingen te maken om uiteindelijk overeenkomsten te vinden binnen de clusters (data).

Post a new message
Dataseries X:
299.63	154.783	301.606
305.945	187.646	268.225
382.252	237.863	362.082
348.846	215.54	310.984
335.367	231.745	350.907
373.617	199.548	365.759
312.612	164.147	357.504
312.232	159.388	432.236
337.161	203.514	394.335
331.476	224.901	404.182
350.103	211.539	371.721
345.127	211.16	387.012
297.256	181.712	280.042
295.979	203.908	357.111
361.007	240.774	359.451
321.803	232.819	341.206
354.937	255.221	349.156
349.432	246.7	430.298
290.979	206.263	354.447
349.576	211.679	400.785
327.625	236.601	358.974
349.377	237.43	352.853
336.777	233.767	374.229
339.134	219.52	364.568
323.321	222.625	352.411
318.86	216.238	376.47
373.583	248.587	357.475
333.03	221.376	299.497
408.556	242.453	361.805
414.646	246.539	343.188
291.514	189.351	335.597
348.857	185.956	330.985
349.368	213.175	336.723
375.765	228.732	348.076
364.136	212.93	317.518
349.53	218.254	345.737
348.167	227.103	342.568
332.856	219.026	352.951
360.551	264.529	400.269
346.969	262.057	428.121
392.815	258.779	475.804
372.02	231.928	392.732
371.027	211.167	388.22
342.672	205.439	410.643
367.343	224.883	428.044
390.786	228.624	530.799
343.785	209.435	463.074
362.6	215.607	477.686
349.468	287.356	440.586
340.624	306.015	424.757
369.536	338.546	511.061
407.782	344.16	511.421
392.239	328.412	454.39
404.824	342.006	498.403
373.669	277.668	516.143
344.902	290.477	463.642
396.7	314.967	498.391
398.911	324.627	533.752
366.009	290.646	404.341
392.484	315.033	435.645


Summary of computational transaction
Raw Inputview raw input (R code)
Raw Outputview raw output of R engine
Computing time3 seconds
R Server'Sir Ronald Aylmer Fisher' @ 193.190.124.24

\begin{tabular}{lllllllll}
\hline
Summary of computational transaction \tabularnewline
Raw Input & view raw input (R code)  \tabularnewline
Raw Output & view raw output of R engine  \tabularnewline
Computing time & 3 seconds \tabularnewline
R Server & 'Sir Ronald Aylmer Fisher' @ 193.190.124.24 \tabularnewline
\hline
\end{tabular}
%Source: https://freestatistics.org/blog/index.php?pk=22807&T=0

[TABLE]
[ROW][C]Summary of computational transaction[/C][/ROW]
[ROW][C]Raw Input[/C][C]view raw input (R code) [/C][/ROW]
[ROW][C]Raw Output[/C][C]view raw output of R engine [/C][/ROW]
[ROW][C]Computing time[/C][C]3 seconds[/C][/ROW]
[ROW][C]R Server[/C][C]'Sir Ronald Aylmer Fisher' @ 193.190.124.24[/C][/ROW]
[/TABLE]
Source: https://freestatistics.org/blog/index.php?pk=22807&T=0

Globally Unique Identifier (entire table): ba.freestatistics.org/blog/index.php?pk=22807&T=0

As an alternative you can also use a QR Code:  

The GUIDs for individual cells are displayed in the table below:

Summary of computational transaction
Raw Inputview raw input (R code)
Raw Outputview raw output of R engine
Computing time3 seconds
R Server'Sir Ronald Aylmer Fisher' @ 193.190.124.24


Summary of Dendrogram
LabelHeight
16.13538271014939
29.49763818009512
310.2059113262853
412.1899872436357
513.2493320963737
613.5224925217210
713.5566581427725
813.7830635201322
913.8341888230977
1014.5389196985195
1115.3356033790653
1215.7048765356497
1315.8225334886673
1416.8312018584533
1519.7945474122082
1620.0094024148649
1720.5738230351642
1821.1161553490542
1921.2688343357129
2021.8265535851869
2122.8172347788697
2223.0311243972152
2323.7100850483502
2423.8294158557917
2524.6091111785858
2626.9901581507038
2728.5314065573492
2830.6348964743424
2932.4131180464229
3032.6081760088272
3136.7233500922777
3237.5035446468541
3337.9727391312871
3439.6113045048694
3541.9039855162957
3644.02234581854
3745.0215999649748
3847.2108516035918
3948.4829718354806
4049.2906856724376
4155.3867144888491
4259.3655155419334
4361.6562059012807
4467.1946427137136
4573.5525397561103
4686.0707097948023
4795.014954801683
4899.6750063544576
49102.252346037352
50152.391031084426
51170.763059043902
52175.577924908569
53177.886939374026
54242.135920550559
55288.3507607762
56303.31704722137
57468.822506812583
58475.523454997101
591946.06757909307

\begin{tabular}{lllllllll}
\hline
Summary of Dendrogram \tabularnewline
Label & Height \tabularnewline
1 & 6.13538271014939 \tabularnewline
2 & 9.49763818009512 \tabularnewline
3 & 10.2059113262853 \tabularnewline
4 & 12.1899872436357 \tabularnewline
5 & 13.2493320963737 \tabularnewline
6 & 13.5224925217210 \tabularnewline
7 & 13.5566581427725 \tabularnewline
8 & 13.7830635201322 \tabularnewline
9 & 13.8341888230977 \tabularnewline
10 & 14.5389196985195 \tabularnewline
11 & 15.3356033790653 \tabularnewline
12 & 15.7048765356497 \tabularnewline
13 & 15.8225334886673 \tabularnewline
14 & 16.8312018584533 \tabularnewline
15 & 19.7945474122082 \tabularnewline
16 & 20.0094024148649 \tabularnewline
17 & 20.5738230351642 \tabularnewline
18 & 21.1161553490542 \tabularnewline
19 & 21.2688343357129 \tabularnewline
20 & 21.8265535851869 \tabularnewline
21 & 22.8172347788697 \tabularnewline
22 & 23.0311243972152 \tabularnewline
23 & 23.7100850483502 \tabularnewline
24 & 23.8294158557917 \tabularnewline
25 & 24.6091111785858 \tabularnewline
26 & 26.9901581507038 \tabularnewline
27 & 28.5314065573492 \tabularnewline
28 & 30.6348964743424 \tabularnewline
29 & 32.4131180464229 \tabularnewline
30 & 32.6081760088272 \tabularnewline
31 & 36.7233500922777 \tabularnewline
32 & 37.5035446468541 \tabularnewline
33 & 37.9727391312871 \tabularnewline
34 & 39.6113045048694 \tabularnewline
35 & 41.9039855162957 \tabularnewline
36 & 44.02234581854 \tabularnewline
37 & 45.0215999649748 \tabularnewline
38 & 47.2108516035918 \tabularnewline
39 & 48.4829718354806 \tabularnewline
40 & 49.2906856724376 \tabularnewline
41 & 55.3867144888491 \tabularnewline
42 & 59.3655155419334 \tabularnewline
43 & 61.6562059012807 \tabularnewline
44 & 67.1946427137136 \tabularnewline
45 & 73.5525397561103 \tabularnewline
46 & 86.0707097948023 \tabularnewline
47 & 95.014954801683 \tabularnewline
48 & 99.6750063544576 \tabularnewline
49 & 102.252346037352 \tabularnewline
50 & 152.391031084426 \tabularnewline
51 & 170.763059043902 \tabularnewline
52 & 175.577924908569 \tabularnewline
53 & 177.886939374026 \tabularnewline
54 & 242.135920550559 \tabularnewline
55 & 288.3507607762 \tabularnewline
56 & 303.31704722137 \tabularnewline
57 & 468.822506812583 \tabularnewline
58 & 475.523454997101 \tabularnewline
59 & 1946.06757909307 \tabularnewline
\hline
\end{tabular}
%Source: https://freestatistics.org/blog/index.php?pk=22807&T=1

[TABLE]
[ROW][C]Summary of Dendrogram[/C][/ROW]
[ROW][C]Label[/C][C]Height[/C][/ROW]
[ROW][C]1[/C][C]6.13538271014939[/C][/ROW]
[ROW][C]2[/C][C]9.49763818009512[/C][/ROW]
[ROW][C]3[/C][C]10.2059113262853[/C][/ROW]
[ROW][C]4[/C][C]12.1899872436357[/C][/ROW]
[ROW][C]5[/C][C]13.2493320963737[/C][/ROW]
[ROW][C]6[/C][C]13.5224925217210[/C][/ROW]
[ROW][C]7[/C][C]13.5566581427725[/C][/ROW]
[ROW][C]8[/C][C]13.7830635201322[/C][/ROW]
[ROW][C]9[/C][C]13.8341888230977[/C][/ROW]
[ROW][C]10[/C][C]14.5389196985195[/C][/ROW]
[ROW][C]11[/C][C]15.3356033790653[/C][/ROW]
[ROW][C]12[/C][C]15.7048765356497[/C][/ROW]
[ROW][C]13[/C][C]15.8225334886673[/C][/ROW]
[ROW][C]14[/C][C]16.8312018584533[/C][/ROW]
[ROW][C]15[/C][C]19.7945474122082[/C][/ROW]
[ROW][C]16[/C][C]20.0094024148649[/C][/ROW]
[ROW][C]17[/C][C]20.5738230351642[/C][/ROW]
[ROW][C]18[/C][C]21.1161553490542[/C][/ROW]
[ROW][C]19[/C][C]21.2688343357129[/C][/ROW]
[ROW][C]20[/C][C]21.8265535851869[/C][/ROW]
[ROW][C]21[/C][C]22.8172347788697[/C][/ROW]
[ROW][C]22[/C][C]23.0311243972152[/C][/ROW]
[ROW][C]23[/C][C]23.7100850483502[/C][/ROW]
[ROW][C]24[/C][C]23.8294158557917[/C][/ROW]
[ROW][C]25[/C][C]24.6091111785858[/C][/ROW]
[ROW][C]26[/C][C]26.9901581507038[/C][/ROW]
[ROW][C]27[/C][C]28.5314065573492[/C][/ROW]
[ROW][C]28[/C][C]30.6348964743424[/C][/ROW]
[ROW][C]29[/C][C]32.4131180464229[/C][/ROW]
[ROW][C]30[/C][C]32.6081760088272[/C][/ROW]
[ROW][C]31[/C][C]36.7233500922777[/C][/ROW]
[ROW][C]32[/C][C]37.5035446468541[/C][/ROW]
[ROW][C]33[/C][C]37.9727391312871[/C][/ROW]
[ROW][C]34[/C][C]39.6113045048694[/C][/ROW]
[ROW][C]35[/C][C]41.9039855162957[/C][/ROW]
[ROW][C]36[/C][C]44.02234581854[/C][/ROW]
[ROW][C]37[/C][C]45.0215999649748[/C][/ROW]
[ROW][C]38[/C][C]47.2108516035918[/C][/ROW]
[ROW][C]39[/C][C]48.4829718354806[/C][/ROW]
[ROW][C]40[/C][C]49.2906856724376[/C][/ROW]
[ROW][C]41[/C][C]55.3867144888491[/C][/ROW]
[ROW][C]42[/C][C]59.3655155419334[/C][/ROW]
[ROW][C]43[/C][C]61.6562059012807[/C][/ROW]
[ROW][C]44[/C][C]67.1946427137136[/C][/ROW]
[ROW][C]45[/C][C]73.5525397561103[/C][/ROW]
[ROW][C]46[/C][C]86.0707097948023[/C][/ROW]
[ROW][C]47[/C][C]95.014954801683[/C][/ROW]
[ROW][C]48[/C][C]99.6750063544576[/C][/ROW]
[ROW][C]49[/C][C]102.252346037352[/C][/ROW]
[ROW][C]50[/C][C]152.391031084426[/C][/ROW]
[ROW][C]51[/C][C]170.763059043902[/C][/ROW]
[ROW][C]52[/C][C]175.577924908569[/C][/ROW]
[ROW][C]53[/C][C]177.886939374026[/C][/ROW]
[ROW][C]54[/C][C]242.135920550559[/C][/ROW]
[ROW][C]55[/C][C]288.3507607762[/C][/ROW]
[ROW][C]56[/C][C]303.31704722137[/C][/ROW]
[ROW][C]57[/C][C]468.822506812583[/C][/ROW]
[ROW][C]58[/C][C]475.523454997101[/C][/ROW]
[ROW][C]59[/C][C]1946.06757909307[/C][/ROW]
[/TABLE]
Source: https://freestatistics.org/blog/index.php?pk=22807&T=1

Globally Unique Identifier (entire table): ba.freestatistics.org/blog/index.php?pk=22807&T=1

As an alternative you can also use a QR Code:  

The GUIDs for individual cells are displayed in the table below:

Summary of Dendrogram
LabelHeight
16.13538271014939
29.49763818009512
310.2059113262853
412.1899872436357
513.2493320963737
613.5224925217210
713.5566581427725
813.7830635201322
913.8341888230977
1014.5389196985195
1115.3356033790653
1215.7048765356497
1315.8225334886673
1416.8312018584533
1519.7945474122082
1620.0094024148649
1720.5738230351642
1821.1161553490542
1921.2688343357129
2021.8265535851869
2122.8172347788697
2223.0311243972152
2323.7100850483502
2423.8294158557917
2524.6091111785858
2626.9901581507038
2728.5314065573492
2830.6348964743424
2932.4131180464229
3032.6081760088272
3136.7233500922777
3237.5035446468541
3337.9727391312871
3439.6113045048694
3541.9039855162957
3644.02234581854
3745.0215999649748
3847.2108516035918
3948.4829718354806
4049.2906856724376
4155.3867144888491
4259.3655155419334
4361.6562059012807
4467.1946427137136
4573.5525397561103
4686.0707097948023
4795.014954801683
4899.6750063544576
49102.252346037352
50152.391031084426
51170.763059043902
52175.577924908569
53177.886939374026
54242.135920550559
55288.3507607762
56303.31704722137
57468.822506812583
58475.523454997101
591946.06757909307


Parameters (Session):
par1 = ward ; par2 = ALL ; par3 = FALSE ; par4 = FALSE ;
Parameters (R input):
par1 = ward ; par2 = ALL ; par3 = FALSE ; par4 = FALSE ;
R code (references can be found in the software module):
par3 <- as.logical(par3)
par4 <- as.logical(par4)
if (par3 == 'TRUE'){
dum = xlab
xlab = ylab
ylab = dum
}
x <- t(y)
hc <- hclust(dist(x),method=par1)
d <- as.dendrogram(hc)
str(d)
mysub <- paste('Method: ',par1)
bitmap(file='test1.png')
if (par4 == 'TRUE'){
plot(d,main=main,ylab=ylab,xlab=xlab,horiz=par3, nodePar=list(pch = c(1,NA), cex=0.8, lab.cex = 0.8),type='t',center=T, sub=mysub)
} else {
plot(d,main=main,ylab=ylab,xlab=xlab,horiz=par3, nodePar=list(pch = c(1,NA), cex=0.8, lab.cex = 0.8), sub=mysub)
}
dev.off()
if (par2 != 'ALL'){
if (par3 == 'TRUE'){
ylab = 'cluster'
} else {
xlab = 'cluster'
}
par2 <- as.numeric(par2)
memb <- cutree(hc, k = par2)
cent <- NULL
for(k in 1:par2){
cent <- rbind(cent, colMeans(x[memb == k, , drop = FALSE]))
}
hc1 <- hclust(dist(cent),method=par1, members = table(memb))
de <- as.dendrogram(hc1)
bitmap(file='test2.png')
if (par4 == 'TRUE'){
plot(de,main=main,ylab=ylab,xlab=xlab,horiz=par3, nodePar=list(pch = c(1,NA), cex=0.8, lab.cex = 0.8),type='t',center=T, sub=mysub)
} else {
plot(de,main=main,ylab=ylab,xlab=xlab,horiz=par3, nodePar=list(pch = c(1,NA), cex=0.8, lab.cex = 0.8), sub=mysub)
}
dev.off()
str(de)
}
load(file='createtable')
a<-table.start()
a<-table.row.start(a)
a<-table.element(a,'Summary of Dendrogram',2,TRUE)
a<-table.row.end(a)
a<-table.row.start(a)
a<-table.element(a,'Label',header=TRUE)
a<-table.element(a,'Height',header=TRUE)
a<-table.row.end(a)
num <- length(x[,1])-1
for (i in 1:num)
{
a<-table.row.start(a)
a<-table.element(a,hc$labels[i])
a<-table.element(a,hc$height[i])
a<-table.row.end(a)
}
a<-table.end(a)
table.save(a,file='mytable1.tab')
if (par2 != 'ALL'){
a<-table.start()
a<-table.row.start(a)
a<-table.element(a,'Summary of Cut Dendrogram',2,TRUE)
a<-table.row.end(a)
a<-table.row.start(a)
a<-table.element(a,'Label',header=TRUE)
a<-table.element(a,'Height',header=TRUE)
a<-table.row.end(a)
num <- par2-1
for (i in 1:num)
{
a<-table.row.start(a)
a<-table.element(a,i)
a<-table.element(a,hc1$height[i])
a<-table.row.end(a)
}
a<-table.end(a)
table.save(a,file='mytable2.tab')
}