Free Statistics

of Irreproducible Research!

Author's title

Author*The author of this computation has been verified*
R Software Modulerwasp_pairs.wasp
Title produced by softwareKendall tau Correlation Matrix
Date of computationSun, 02 Nov 2008 12:24:26 -0700
Cite this page as followsStatistical Computations at FreeStatistics.org, Office for Research Development and Education, URL https://freestatistics.org/blog/index.php?v=date/2008/Nov/02/t1225653921qlyucryybkq4tg6.htm/, Retrieved Wed, 15 May 2024 01:48:05 +0000
Statistical Computations at FreeStatistics.org, Office for Research Development and Education, URL https://freestatistics.org/blog/index.php?pk=20710, Retrieved Wed, 15 May 2024 01:48:05 +0000
QR Codes:

Original text written by user:
IsPrivate?No (this computation is public)
User-defined keywords
Estimated Impact198
Family? (F = Feedback message, R = changed R code, M = changed R Module, P = changed Parameters, D = changed Data)
-     [Kendall tau Correlation Matrix] [Workshop 3b] [2007-10-26 12:12:15] [af4777324016f4282fa8f83a7492213a]
F    D    [Kendall tau Correlation Matrix] [Part2_Deel 1] [2008-11-02 19:24:26] [14a75ec03b2c0d8ddd8b141a7b1594fd] [Current]
-           [Kendall tau Correlation Matrix] [] [2008-11-03 20:35:48] [43d870b30ac8a7afeb5de9ee11dcfc1a]
F             [Kendall tau Correlation Matrix] [] [2008-11-03 20:40:40] [43d870b30ac8a7afeb5de9ee11dcfc1a]
- R PD      [Kendall tau Correlation Matrix] [Q1] [2008-11-03 20:39:23] [7458e879e85b911182071700fff19fbd]
F   PD      [Kendall tau Correlation Matrix] [Part 2.1] [2008-11-03 20:42:31] [cf9c64468d04c2c4dd548cc66b4e3677]
Feedback Forum
2008-11-08 10:49:13 [Kenny Simons] [reply
Deze oefening heb ik goed opgelost, eerst en vooral moesten we de tabel transponeren, zodat we de gegevens in een bruikbare vorm hadden. Deze gegevens moesten we invoeren in een Kendall Tau Correlation Plot.

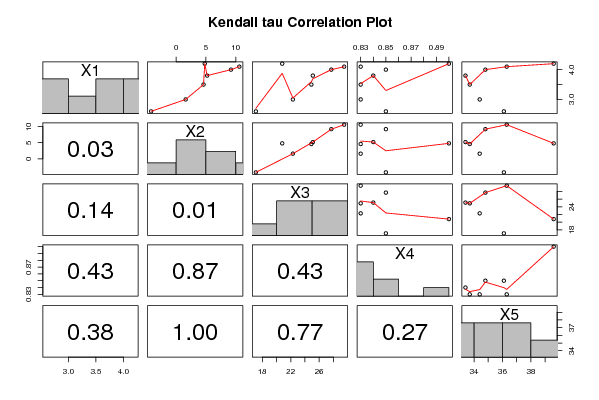
De Kendall Tau Correlation berekent de rangorde correlatie. We zien hier dat we meestal speciale figuren krijgen. De getallen links zijn de betrouwbaarheidscoëfficiënten, deze moeten zo klein mogelijk blijven, liefst onder de 0.05, anders is er geen correlatie mogelijk.

Als we de figuurtjes bestuderen zien we dat er 2 plots zijn met correlatie. Een correlatie tussen X1(RNVM) en X2(RNR) en tussen X2(RNR) en X3(RCF)
2008-11-10 15:50:47 [Glenn De Maeyer] [reply
Het antwoord is inderdaad correct. De beste schatter voor RNR is RCF. Er is een kans van ongeveer 1% is dat deze positieve correlatie (van 81%) tussen RNR en RCF gebaseerd is op toeval. Bovendien ligt de p-value onder 0,05, wat het dus zeer betrouwbaar maakt. Dit alles maakt RCF tot een goede schatter. De value
Een kleine opmerking is wel dat de student zijn assen moet benoemen. Dit maakt het makkelijker om de gegevens af te lezen.
2008-11-11 16:00:49 [Bernard Femont] [reply
correcte gegevensinvoering en implementatie; bijkomend;
Deze calculator geeft ons alle scatterplots en mogelijke correlaties (verbanden) van alle variabelen.
Welke variabele is nu de beste predictor voor RNR? M.a.w. welke variabele kent in correlatie met de RNR de kleinste p-waarde en dus de kleinste kans dat de correlatie toeval is?
In de tabel is duidelijk dat de RCF de beste predictor is. Er is slechts1% kans dat het verband toeval is en als je naar de correlatielijn kijkt is deze praktisch een rechte die door alle punten gaat.

Post a new message
Dataseries X:
4.2	4.8	20.8	0.9	39.6
2.6	-4.2	17.1	0.85	36.1
3	1.6	22.3	0.83	34.4
3.8	5.2	25.1	0.84	33.4
4	9.2	27.7	0.85	34.8
3.5	4.6	24.9	0.83	33.7
4.1	10.6	29.5	0.83	36.3


Summary of computational transaction
Raw Inputview raw input (R code)
Raw Outputview raw output of R engine
Computing time1 seconds
R Server'Gwilym Jenkins' @ 72.249.127.135

\begin{tabular}{lllllllll}
\hline
Summary of computational transaction \tabularnewline
Raw Input & view raw input (R code)  \tabularnewline
Raw Output & view raw output of R engine  \tabularnewline
Computing time & 1 seconds \tabularnewline
R Server & 'Gwilym Jenkins' @ 72.249.127.135 \tabularnewline
\hline
\end{tabular}
%Source: https://freestatistics.org/blog/index.php?pk=20710&T=0

[TABLE]
[ROW][C]Summary of computational transaction[/C][/ROW]
[ROW][C]Raw Input[/C][C]view raw input (R code) [/C][/ROW]
[ROW][C]Raw Output[/C][C]view raw output of R engine [/C][/ROW]
[ROW][C]Computing time[/C][C]1 seconds[/C][/ROW]
[ROW][C]R Server[/C][C]'Gwilym Jenkins' @ 72.249.127.135[/C][/ROW]
[/TABLE]
Source: https://freestatistics.org/blog/index.php?pk=20710&T=0

Globally Unique Identifier (entire table): ba.freestatistics.org/blog/index.php?pk=20710&T=0

As an alternative you can also use a QR Code:  

The GUIDs for individual cells are displayed in the table below:

Summary of computational transaction
Raw Inputview raw input (R code)
Raw Outputview raw output of R engine
Computing time1 seconds
R Server'Gwilym Jenkins' @ 72.249.127.135


Kendall tau rank correlations for all pairs of data series
pairtaup-value
tau( X1 , X2 )0.7142857142857140.0301587301587301
tau( X1 , X3 )0.5238095238095240.136111111111111
tau( X1 , X4 )0.2646280620124820.427262856745706
tau( X1 , X5 )0.3333333333333330.381349206349206
tau( X2 , X3 )0.809523809523810.0107142857142857
tau( X2 , X4 )-0.05292561240249630.873844698517373
tau( X2 , X5 )0.04761904761904761
tau( X3 , X4 )-0.2646280620124820.427262856745706
tau( X3 , X5 )-0.1428571428571430.772619047619048
tau( X4 , X5 )0.3704792868174740.266379923342483

\begin{tabular}{lllllllll}
\hline
Kendall tau rank correlations for all pairs of data series \tabularnewline
pair & tau & p-value \tabularnewline
tau( X1 , X2 ) & 0.714285714285714 & 0.0301587301587301 \tabularnewline
tau( X1 , X3 ) & 0.523809523809524 & 0.136111111111111 \tabularnewline
tau( X1 , X4 ) & 0.264628062012482 & 0.427262856745706 \tabularnewline
tau( X1 , X5 ) & 0.333333333333333 & 0.381349206349206 \tabularnewline
tau( X2 , X3 ) & 0.80952380952381 & 0.0107142857142857 \tabularnewline
tau( X2 , X4 ) & -0.0529256124024963 & 0.873844698517373 \tabularnewline
tau( X2 , X5 ) & 0.0476190476190476 & 1 \tabularnewline
tau( X3 , X4 ) & -0.264628062012482 & 0.427262856745706 \tabularnewline
tau( X3 , X5 ) & -0.142857142857143 & 0.772619047619048 \tabularnewline
tau( X4 , X5 ) & 0.370479286817474 & 0.266379923342483 \tabularnewline
\hline
\end{tabular}
%Source: https://freestatistics.org/blog/index.php?pk=20710&T=1

[TABLE]
[ROW][C]Kendall tau rank correlations for all pairs of data series[/C][/ROW]
[ROW][C]pair[/C][C]tau[/C][C]p-value[/C][/ROW]
[ROW][C]tau( X1 , X2 )[/C][C]0.714285714285714[/C][C]0.0301587301587301[/C][/ROW]
[ROW][C]tau( X1 , X3 )[/C][C]0.523809523809524[/C][C]0.136111111111111[/C][/ROW]
[ROW][C]tau( X1 , X4 )[/C][C]0.264628062012482[/C][C]0.427262856745706[/C][/ROW]
[ROW][C]tau( X1 , X5 )[/C][C]0.333333333333333[/C][C]0.381349206349206[/C][/ROW]
[ROW][C]tau( X2 , X3 )[/C][C]0.80952380952381[/C][C]0.0107142857142857[/C][/ROW]
[ROW][C]tau( X2 , X4 )[/C][C]-0.0529256124024963[/C][C]0.873844698517373[/C][/ROW]
[ROW][C]tau( X2 , X5 )[/C][C]0.0476190476190476[/C][C]1[/C][/ROW]
[ROW][C]tau( X3 , X4 )[/C][C]-0.264628062012482[/C][C]0.427262856745706[/C][/ROW]
[ROW][C]tau( X3 , X5 )[/C][C]-0.142857142857143[/C][C]0.772619047619048[/C][/ROW]
[ROW][C]tau( X4 , X5 )[/C][C]0.370479286817474[/C][C]0.266379923342483[/C][/ROW]
[/TABLE]
Source: https://freestatistics.org/blog/index.php?pk=20710&T=1

Globally Unique Identifier (entire table): ba.freestatistics.org/blog/index.php?pk=20710&T=1

As an alternative you can also use a QR Code:  

The GUIDs for individual cells are displayed in the table below:

Kendall tau rank correlations for all pairs of data series
pairtaup-value
tau( X1 , X2 )0.7142857142857140.0301587301587301
tau( X1 , X3 )0.5238095238095240.136111111111111
tau( X1 , X4 )0.2646280620124820.427262856745706
tau( X1 , X5 )0.3333333333333330.381349206349206
tau( X2 , X3 )0.809523809523810.0107142857142857
tau( X2 , X4 )-0.05292561240249630.873844698517373
tau( X2 , X5 )0.04761904761904761
tau( X3 , X4 )-0.2646280620124820.427262856745706
tau( X3 , X5 )-0.1428571428571430.772619047619048
tau( X4 , X5 )0.3704792868174740.266379923342483


Parameters (Session):
Parameters (R input):
R code (references can be found in the software module):
panel.tau <- function(x, y, digits=2, prefix='', cex.cor)
{
usr <- par('usr'); on.exit(par(usr))
par(usr = c(0, 1, 0, 1))
rr <- cor.test(x, y, method='kendall')
r <- round(rr$p.value,2)
txt <- format(c(r, 0.123456789), digits=digits)[1]
txt <- paste(prefix, txt, sep='')
if(missing(cex.cor)) cex <- 0.5/strwidth(txt)
text(0.5, 0.5, txt, cex = cex)
}
panel.hist <- function(x, ...)
{
usr <- par('usr'); on.exit(par(usr))
par(usr = c(usr[1:2], 0, 1.5) )
h <- hist(x, plot = FALSE)
breaks <- h$breaks; nB <- length(breaks)
y <- h$counts; y <- y/max(y)
rect(breaks[-nB], 0, breaks[-1], y, col='grey', ...)
}
bitmap(file='test1.png')
pairs(t(y),diag.panel=panel.hist, upper.panel=panel.smooth, lower.panel=panel.tau, main=main)
dev.off()
load(file='createtable')
a<-table.start()
a<-table.row.start(a)
a<-table.element(a,'Kendall tau rank correlations for all pairs of data series',3,TRUE)
a<-table.row.end(a)
a<-table.row.start(a)
a<-table.element(a,'pair',1,TRUE)
a<-table.element(a,'tau',1,TRUE)
a<-table.element(a,'p-value',1,TRUE)
a<-table.row.end(a)
n <- length(y[,1])
n
cor.test(y[1,],y[2,],method='kendall')
for (i in 1:(n-1))
{
for (j in (i+1):n)
{
a<-table.row.start(a)
dum <- paste('tau(',dimnames(t(x))[[2]][i])
dum <- paste(dum,',')
dum <- paste(dum,dimnames(t(x))[[2]][j])
dum <- paste(dum,')')
a<-table.element(a,dum,header=TRUE)
r <- cor.test(y[i,],y[j,],method='kendall')
a<-table.element(a,r$estimate)
a<-table.element(a,r$p.value)
a<-table.row.end(a)
}
}
a<-table.end(a)
table.save(a,file='mytable.tab')