Free Statistics

of Irreproducible Research!

Author's title

Author*Unverified author*
R Software Modulerwasp_pairs.wasp
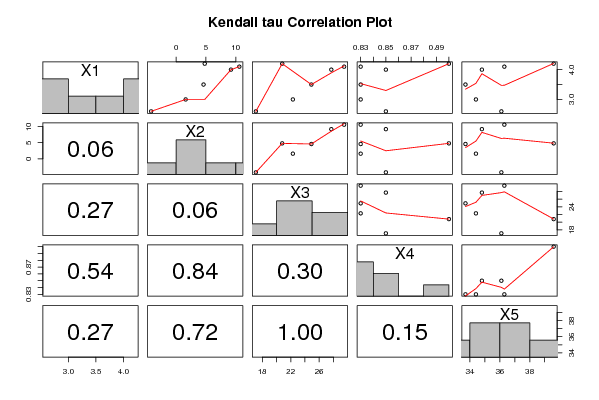
Title produced by softwareKendall tau Correlation Matrix
Date of computationSun, 02 Nov 2008 11:13:31 -0700
Cite this page as followsStatistical Computations at FreeStatistics.org, Office for Research Development and Education, URL https://freestatistics.org/blog/index.php?v=date/2008/Nov/02/t12256497944u86djd6qxq5vdo.htm/, Retrieved Wed, 15 May 2024 04:59:08 +0000
Statistical Computations at FreeStatistics.org, Office for Research Development and Education, URL https://freestatistics.org/blog/index.php?pk=20686, Retrieved Wed, 15 May 2024 04:59:08 +0000
QR Codes:

Original text written by user:
IsPrivate?No (this computation is public)
User-defined keywords
Estimated Impact204
Family? (F = Feedback message, R = changed R code, M = changed R Module, P = changed Parameters, D = changed Data)
-     [Kendall tau Correlation Matrix] [] [2007-10-26 11:11:14] [d63889a2cb43a84e31f95f02a72561da]
F R  D    [Kendall tau Correlation Matrix] [Kendal Tau correl...] [2008-11-02 18:13:31] [8a2d94dac8ebd598299eaec920908ca6] [Current]
Feedback Forum
2008-11-05 17:44:31 [Kevin Truyts] [reply
Eerst en vooral moest van de gegeven data set de assen worden verwisseld vooralleer de student de gegevens kon gebruiken voor deze computation.
De student velt een duidelijk oordeel.
Tijdens het college werd gezegt dat we een diagonaal kunnen trekken van linksboven naar rechtsonder. Dan kunnen we boven de diagonaal de correlatie aflezen en onder de diagonaal (de P-value) de betrouwbaarheid van de correlatiecoëfficiënt. Hoe kleiner de P-value, hoe beter.
2008-11-05 19:29:34 [Gert De la Haye] [reply
volgens mij heb je ook gebruik gemaakt van de foutieve gegevens, ik krijg andere getallen!

http://www.freestatistics.org/blog/index.php?v=date/2008/Nov/02/t1225641949ki4pjiqn8ft046v.htm/
2008-11-10 13:02:11 [Zeno Thoelen] [reply
2008-11-10 13:05:18 [a7e076854c32462fd499d2de3f6d4e86] [reply
Van de gegeven data set moesten de assen worden verwisseld!

Als we de diagonaal trekken (zoals hierboven verleld)dan kunnen we boven de diagonaal de correlatie aflezen en onder de diagonaal (de P-value) de betrouwbaarheid van de correlatiecoëfficiënt. Hoe kleiner de P-value, hoe beter.
2008-11-11 12:03:12 [Stijn Loomans] [reply
Van de gegeven data set moeten eerst de assen worden omgewisseld

ZOals er is vermeld tijdens het college moeten we een diagonaal trekken van linksboven naar rechtsonder. En dan kunnen we boven de diagonaal de correlatie aflezen en eronder de P value (namelijk de betrouwebaarheid dat het niet op toeval berust) Hoe kleiner hoe beter.

Dus de correlatie tussen RNR en RCF is dus het beste. Dus de kleinste P waarde i te vinden bij
tau 0.80952380952381 namelijk0.0107142857142857
2008-11-11 17:19:45 [Evelien Blockx] [reply
-De student heeft de juiste methode gebruikt (Kendall Tau), want hiermee kan je onmiddellijk alle correlaties berekenen.
-De student heeft er niet voor gezorgd dat de data in het excelbestand verticaal kwamen te staan en de boekhoudkundige variabelen horizontaal.
-De juiste oplossing kon dus niet afgelezen worden.

Voor de juiste cijfers, zie link die de student hierboven geeft.

Om de correlaties te bekijken moet je kijken in de tabel bij tau. De p-value is geen correlatiecoëfficiënt, het zegt iets over de betrouwbaarheid. Hoe kleiner, hoe meer betrouwbaar (in principe zou het onder de 0,05 moeten liggen).

Als je dan naar de correlaties gaat kijken, vind je de hoogste correlatie bij tau( RNR , RCF ). Het is een positieve correlatie van 0.80952380952381. Bovendien is de betrouwbaarheid 0,01 en dat is zeer goed.

RCF is dus de beste predictor voor RNR.
2008-11-11 23:52:49 [Joris Deboel] [reply
De juiste methode wordt gebruikt maar de assen van de data set moeten omgewisseld worden om zo met de juiste gegevens te kunnen werken. Dan kunnen we concluderen dat de correlatie tussen RNR en RCF het beste is.
2008-11-12 11:44:59 [Nilay Erdogdu] [reply
Eerst de assen omwisselen

0,01 geeft dan de kans aan dat het toeval is. vermits deze heel klein is, kunnen we besluiten dat rcf een goede predictor is

Post a new message
Dataseries X:
4.2	4.8	20.8	0.9	39.6
2.6	-4.2	17.1	0.85	36.1
3	1.6	22.3	0.83	34.4
4	9.2	27.7	0.85	34.8
3.5	4.6	24.9	0.83	33.7
4.1	10.6	29.5	0.83	36.3


Summary of computational transaction
Raw Inputview raw input (R code)
Raw Outputview raw output of R engine
Computing time1 seconds
R Server'Gwilym Jenkins' @ 72.249.127.135

\begin{tabular}{lllllllll}
\hline
Summary of computational transaction \tabularnewline
Raw Input & view raw input (R code)  \tabularnewline
Raw Output & view raw output of R engine  \tabularnewline
Computing time & 1 seconds \tabularnewline
R Server & 'Gwilym Jenkins' @ 72.249.127.135 \tabularnewline
\hline
\end{tabular}
%Source: https://freestatistics.org/blog/index.php?pk=20686&T=0

[TABLE]
[ROW][C]Summary of computational transaction[/C][/ROW]
[ROW][C]Raw Input[/C][C]view raw input (R code) [/C][/ROW]
[ROW][C]Raw Output[/C][C]view raw output of R engine [/C][/ROW]
[ROW][C]Computing time[/C][C]1 seconds[/C][/ROW]
[ROW][C]R Server[/C][C]'Gwilym Jenkins' @ 72.249.127.135[/C][/ROW]
[/TABLE]
Source: https://freestatistics.org/blog/index.php?pk=20686&T=0

Globally Unique Identifier (entire table): ba.freestatistics.org/blog/index.php?pk=20686&T=0

As an alternative you can also use a QR Code:  

The GUIDs for individual cells are displayed in the table below:

Summary of computational transaction
Raw Inputview raw input (R code)
Raw Outputview raw output of R engine
Computing time1 seconds
R Server'Gwilym Jenkins' @ 72.249.127.135


Kendall tau rank correlations for all pairs of data series
pairtaup-value
tau( X1 , X2 )0.7333333333333330.0555555555555556
tau( X1 , X3 )0.4666666666666670.272222222222222
tau( X1 , X4 )0.2335496832484570.537452519113628
tau( X1 , X5 )0.4666666666666670.272222222222222
tau( X2 , X3 )0.7333333333333330.0555555555555556
tau( X2 , X4 )-0.07784989441615230.837137271541353
tau( X2 , X5 )0.20.719444444444445
tau( X3 , X4 )-0.3892494720807610.304051884244243
tau( X3 , X5 )-0.06666666666666671
tau( X4 , X5 )0.5449492609130660.150179908657660

\begin{tabular}{lllllllll}
\hline
Kendall tau rank correlations for all pairs of data series \tabularnewline
pair & tau & p-value \tabularnewline
tau( X1 , X2 ) & 0.733333333333333 & 0.0555555555555556 \tabularnewline
tau( X1 , X3 ) & 0.466666666666667 & 0.272222222222222 \tabularnewline
tau( X1 , X4 ) & 0.233549683248457 & 0.537452519113628 \tabularnewline
tau( X1 , X5 ) & 0.466666666666667 & 0.272222222222222 \tabularnewline
tau( X2 , X3 ) & 0.733333333333333 & 0.0555555555555556 \tabularnewline
tau( X2 , X4 ) & -0.0778498944161523 & 0.837137271541353 \tabularnewline
tau( X2 , X5 ) & 0.2 & 0.719444444444445 \tabularnewline
tau( X3 , X4 ) & -0.389249472080761 & 0.304051884244243 \tabularnewline
tau( X3 , X5 ) & -0.0666666666666667 & 1 \tabularnewline
tau( X4 , X5 ) & 0.544949260913066 & 0.150179908657660 \tabularnewline
\hline
\end{tabular}
%Source: https://freestatistics.org/blog/index.php?pk=20686&T=1

[TABLE]
[ROW][C]Kendall tau rank correlations for all pairs of data series[/C][/ROW]
[ROW][C]pair[/C][C]tau[/C][C]p-value[/C][/ROW]
[ROW][C]tau( X1 , X2 )[/C][C]0.733333333333333[/C][C]0.0555555555555556[/C][/ROW]
[ROW][C]tau( X1 , X3 )[/C][C]0.466666666666667[/C][C]0.272222222222222[/C][/ROW]
[ROW][C]tau( X1 , X4 )[/C][C]0.233549683248457[/C][C]0.537452519113628[/C][/ROW]
[ROW][C]tau( X1 , X5 )[/C][C]0.466666666666667[/C][C]0.272222222222222[/C][/ROW]
[ROW][C]tau( X2 , X3 )[/C][C]0.733333333333333[/C][C]0.0555555555555556[/C][/ROW]
[ROW][C]tau( X2 , X4 )[/C][C]-0.0778498944161523[/C][C]0.837137271541353[/C][/ROW]
[ROW][C]tau( X2 , X5 )[/C][C]0.2[/C][C]0.719444444444445[/C][/ROW]
[ROW][C]tau( X3 , X4 )[/C][C]-0.389249472080761[/C][C]0.304051884244243[/C][/ROW]
[ROW][C]tau( X3 , X5 )[/C][C]-0.0666666666666667[/C][C]1[/C][/ROW]
[ROW][C]tau( X4 , X5 )[/C][C]0.544949260913066[/C][C]0.150179908657660[/C][/ROW]
[/TABLE]
Source: https://freestatistics.org/blog/index.php?pk=20686&T=1

Globally Unique Identifier (entire table): ba.freestatistics.org/blog/index.php?pk=20686&T=1

As an alternative you can also use a QR Code:  

The GUIDs for individual cells are displayed in the table below:

Kendall tau rank correlations for all pairs of data series
pairtaup-value
tau( X1 , X2 )0.7333333333333330.0555555555555556
tau( X1 , X3 )0.4666666666666670.272222222222222
tau( X1 , X4 )0.2335496832484570.537452519113628
tau( X1 , X5 )0.4666666666666670.272222222222222
tau( X2 , X3 )0.7333333333333330.0555555555555556
tau( X2 , X4 )-0.07784989441615230.837137271541353
tau( X2 , X5 )0.20.719444444444445
tau( X3 , X4 )-0.3892494720807610.304051884244243
tau( X3 , X5 )-0.06666666666666671
tau( X4 , X5 )0.5449492609130660.150179908657660


Parameters (Session):
Parameters (R input):
R code (references can be found in the software module):
panel.tau <- function(x, y, digits=2, prefix='', cex.cor)
{
usr <- par('usr'); on.exit(par(usr))
par(usr = c(0, 1, 0, 1))
rr <- cor.test(x, y, method='kendall')
r <- round(rr$p.value,2)
txt <- format(c(r, 0.123456789), digits=digits)[1]
txt <- paste(prefix, txt, sep='')
if(missing(cex.cor)) cex <- 0.5/strwidth(txt)
text(0.5, 0.5, txt, cex = cex)
}
panel.hist <- function(x, ...)
{
usr <- par('usr'); on.exit(par(usr))
par(usr = c(usr[1:2], 0, 1.5) )
h <- hist(x, plot = FALSE)
breaks <- h$breaks; nB <- length(breaks)
y <- h$counts; y <- y/max(y)
rect(breaks[-nB], 0, breaks[-1], y, col='grey', ...)
}
bitmap(file='test1.png')
pairs(t(y),diag.panel=panel.hist, upper.panel=panel.smooth, lower.panel=panel.tau, main=main)
dev.off()
load(file='createtable')
a<-table.start()
a<-table.row.start(a)
a<-table.element(a,'Kendall tau rank correlations for all pairs of data series',3,TRUE)
a<-table.row.end(a)
a<-table.row.start(a)
a<-table.element(a,'pair',1,TRUE)
a<-table.element(a,'tau',1,TRUE)
a<-table.element(a,'p-value',1,TRUE)
a<-table.row.end(a)
n <- length(y[,1])
n
cor.test(y[1,],y[2,],method='kendall')
for (i in 1:(n-1))
{
for (j in (i+1):n)
{
a<-table.row.start(a)
dum <- paste('tau(',dimnames(t(x))[[2]][i])
dum <- paste(dum,',')
dum <- paste(dum,dimnames(t(x))[[2]][j])
dum <- paste(dum,')')
a<-table.element(a,dum,header=TRUE)
r <- cor.test(y[i,],y[j,],method='kendall')
a<-table.element(a,r$estimate)
a<-table.element(a,r$p.value)
a<-table.row.end(a)
}
}
a<-table.end(a)
table.save(a,file='mytable.tab')