Free Statistics

of Irreproducible Research!

Author's title

Author*Unverified author*
R Software Modulerwasp_autocorrelation.wasp
Title produced by software(Partial) Autocorrelation Function
Date of computationWed, 24 Dec 2008 07:09:34 -0700
Cite this page as followsStatistical Computations at FreeStatistics.org, Office for Research Development and Education, URL https://freestatistics.org/blog/index.php?v=date/2008/Dec/24/t1230127794ebwd208zejmk4d0.htm/, Retrieved Fri, 17 May 2024 22:29:49 +0000
Statistical Computations at FreeStatistics.org, Office for Research Development and Education, URL https://freestatistics.org/blog/index.php?pk=36578, Retrieved Fri, 17 May 2024 22:29:49 +0000
QR Codes:

Original text written by user:
IsPrivate?No (this computation is public)
User-defined keywords
Estimated Impact174
Family? (F = Feedback message, R = changed R code, M = changed R Module, P = changed Parameters, D = changed Data)
-     [(Partial) Autocorrelation Function] [autocorrelatie: e...] [2007-12-15 09:28:58] [707a919fab5d6f3020ea3c395672cd86]
- R PD    [(Partial) Autocorrelation Function] [Nick Mulkens] [2008-12-24 14:09:34] [d41d8cd98f00b204e9800998ecf8427e] [Current]
Feedback Forum

Post a new message
Dataseries X:
544.50
619.80
777.60
640.40
633.00
722.00
860.10
495.10
692.80
766.70
648.50
640.00
681.60
752.50
1031.70
685.50
887.60
655.40
944.20
626.60
1221.80
939.60
886.60
811.30
774.70
910.60
911.60
697.70
829.80
824.30
885.60
538.90
686.00
878.70
812.70
640.40
773.90
795.90
836.30
876.10
851.70
692.40
877.30
536.80
705.90
951.00
755.70
695.50
744.80
672.10
666.60
760.80
756.00
604.40
883.90
527.90
756.20
812.90
655.60
707.60


Summary of computational transaction
Raw Inputview raw input (R code)
Raw Outputview raw output of R engine
Computing time1 seconds
R Server'George Udny Yule' @ 72.249.76.132

\begin{tabular}{lllllllll}
\hline
Summary of computational transaction \tabularnewline
Raw Input & view raw input (R code)  \tabularnewline
Raw Output & view raw output of R engine  \tabularnewline
Computing time & 1 seconds \tabularnewline
R Server & 'George Udny Yule' @ 72.249.76.132 \tabularnewline
\hline
\end{tabular}
%Source: https://freestatistics.org/blog/index.php?pk=36578&T=0

[TABLE]
[ROW][C]Summary of computational transaction[/C][/ROW]
[ROW][C]Raw Input[/C][C]view raw input (R code) [/C][/ROW]
[ROW][C]Raw Output[/C][C]view raw output of R engine [/C][/ROW]
[ROW][C]Computing time[/C][C]1 seconds[/C][/ROW]
[ROW][C]R Server[/C][C]'George Udny Yule' @ 72.249.76.132[/C][/ROW]
[/TABLE]
Source: https://freestatistics.org/blog/index.php?pk=36578&T=0

Globally Unique Identifier (entire table): ba.freestatistics.org/blog/index.php?pk=36578&T=0

As an alternative you can also use a QR Code:  

The GUIDs for individual cells are displayed in the table below:

Summary of computational transaction
Raw Inputview raw input (R code)
Raw Outputview raw output of R engine
Computing time1 seconds
R Server'George Udny Yule' @ 72.249.76.132


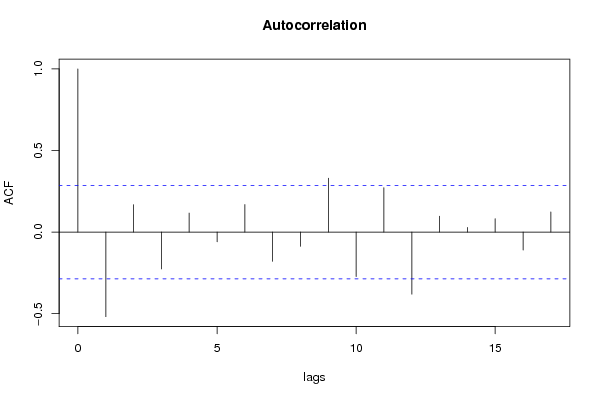
Autocorrelation Function
Time lag kACF(k)T-STATP-value
1-0.518032-3.55150.000442
20.1684811.1550.126954
3-0.225487-1.54590.064423
40.1170030.80210.213257
5-0.059718-0.40940.342052
60.1686751.15640.126685
7-0.178561-1.22420.113498
8-0.087306-0.59850.276178
90.3303162.26450.014097
10-0.272508-1.86820.033986
110.2721161.86550.034178
12-0.380643-2.60960.006061
130.0978070.67050.252901
140.0288360.19770.422069
150.0820780.56270.288158
16-0.110228-0.75570.226804
170.1238820.84930.200012

\begin{tabular}{lllllllll}
\hline
Autocorrelation Function \tabularnewline
Time lag k & ACF(k) & T-STAT & P-value \tabularnewline
1 & -0.518032 & -3.5515 & 0.000442 \tabularnewline
2 & 0.168481 & 1.155 & 0.126954 \tabularnewline
3 & -0.225487 & -1.5459 & 0.064423 \tabularnewline
4 & 0.117003 & 0.8021 & 0.213257 \tabularnewline
5 & -0.059718 & -0.4094 & 0.342052 \tabularnewline
6 & 0.168675 & 1.1564 & 0.126685 \tabularnewline
7 & -0.178561 & -1.2242 & 0.113498 \tabularnewline
8 & -0.087306 & -0.5985 & 0.276178 \tabularnewline
9 & 0.330316 & 2.2645 & 0.014097 \tabularnewline
10 & -0.272508 & -1.8682 & 0.033986 \tabularnewline
11 & 0.272116 & 1.8655 & 0.034178 \tabularnewline
12 & -0.380643 & -2.6096 & 0.006061 \tabularnewline
13 & 0.097807 & 0.6705 & 0.252901 \tabularnewline
14 & 0.028836 & 0.1977 & 0.422069 \tabularnewline
15 & 0.082078 & 0.5627 & 0.288158 \tabularnewline
16 & -0.110228 & -0.7557 & 0.226804 \tabularnewline
17 & 0.123882 & 0.8493 & 0.200012 \tabularnewline
\hline
\end{tabular}
%Source: https://freestatistics.org/blog/index.php?pk=36578&T=1

[TABLE]
[ROW][C]Autocorrelation Function[/C][/ROW]
[ROW][C]Time lag k[/C][C]ACF(k)[/C][C]T-STAT[/C][C]P-value[/C][/ROW]
[ROW][C]1[/C][C]-0.518032[/C][C]-3.5515[/C][C]0.000442[/C][/ROW]
[ROW][C]2[/C][C]0.168481[/C][C]1.155[/C][C]0.126954[/C][/ROW]
[ROW][C]3[/C][C]-0.225487[/C][C]-1.5459[/C][C]0.064423[/C][/ROW]
[ROW][C]4[/C][C]0.117003[/C][C]0.8021[/C][C]0.213257[/C][/ROW]
[ROW][C]5[/C][C]-0.059718[/C][C]-0.4094[/C][C]0.342052[/C][/ROW]
[ROW][C]6[/C][C]0.168675[/C][C]1.1564[/C][C]0.126685[/C][/ROW]
[ROW][C]7[/C][C]-0.178561[/C][C]-1.2242[/C][C]0.113498[/C][/ROW]
[ROW][C]8[/C][C]-0.087306[/C][C]-0.5985[/C][C]0.276178[/C][/ROW]
[ROW][C]9[/C][C]0.330316[/C][C]2.2645[/C][C]0.014097[/C][/ROW]
[ROW][C]10[/C][C]-0.272508[/C][C]-1.8682[/C][C]0.033986[/C][/ROW]
[ROW][C]11[/C][C]0.272116[/C][C]1.8655[/C][C]0.034178[/C][/ROW]
[ROW][C]12[/C][C]-0.380643[/C][C]-2.6096[/C][C]0.006061[/C][/ROW]
[ROW][C]13[/C][C]0.097807[/C][C]0.6705[/C][C]0.252901[/C][/ROW]
[ROW][C]14[/C][C]0.028836[/C][C]0.1977[/C][C]0.422069[/C][/ROW]
[ROW][C]15[/C][C]0.082078[/C][C]0.5627[/C][C]0.288158[/C][/ROW]
[ROW][C]16[/C][C]-0.110228[/C][C]-0.7557[/C][C]0.226804[/C][/ROW]
[ROW][C]17[/C][C]0.123882[/C][C]0.8493[/C][C]0.200012[/C][/ROW]
[/TABLE]
Source: https://freestatistics.org/blog/index.php?pk=36578&T=1

Globally Unique Identifier (entire table): ba.freestatistics.org/blog/index.php?pk=36578&T=1

As an alternative you can also use a QR Code:  

The GUIDs for individual cells are displayed in the table below:

Autocorrelation Function
Time lag kACF(k)T-STATP-value
1-0.518032-3.55150.000442
20.1684811.1550.126954
3-0.225487-1.54590.064423
40.1170030.80210.213257
5-0.059718-0.40940.342052
60.1686751.15640.126685
7-0.178561-1.22420.113498
8-0.087306-0.59850.276178
90.3303162.26450.014097
10-0.272508-1.86820.033986
110.2721161.86550.034178
12-0.380643-2.60960.006061
130.0978070.67050.252901
140.0288360.19770.422069
150.0820780.56270.288158
16-0.110228-0.75570.226804
170.1238820.84930.200012


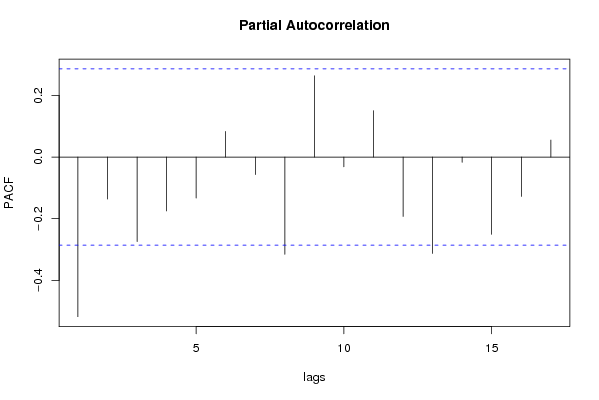
Partial Autocorrelation Function
Time lag kPACF(k)T-STATP-value
1-0.518032-3.55150.000442
2-0.13651-0.93590.177064
3-0.274385-1.88110.033082
4-0.174895-1.1990.118265
5-0.133175-0.9130.182951
60.0830410.56930.285931
7-0.056875-0.38990.349181
8-0.315899-2.16570.017721
90.2635211.80660.038614
10-0.03192-0.21880.413863
110.1504051.03110.153879
12-0.192701-1.32110.096433
13-0.31303-2.1460.018533
14-0.01731-0.11870.453021
15-0.25098-1.72060.045948
16-0.12768-0.87530.192924
170.0552780.3790.35321

\begin{tabular}{lllllllll}
\hline
Partial Autocorrelation Function \tabularnewline
Time lag k & PACF(k) & T-STAT & P-value \tabularnewline
1 & -0.518032 & -3.5515 & 0.000442 \tabularnewline
2 & -0.13651 & -0.9359 & 0.177064 \tabularnewline
3 & -0.274385 & -1.8811 & 0.033082 \tabularnewline
4 & -0.174895 & -1.199 & 0.118265 \tabularnewline
5 & -0.133175 & -0.913 & 0.182951 \tabularnewline
6 & 0.083041 & 0.5693 & 0.285931 \tabularnewline
7 & -0.056875 & -0.3899 & 0.349181 \tabularnewline
8 & -0.315899 & -2.1657 & 0.017721 \tabularnewline
9 & 0.263521 & 1.8066 & 0.038614 \tabularnewline
10 & -0.03192 & -0.2188 & 0.413863 \tabularnewline
11 & 0.150405 & 1.0311 & 0.153879 \tabularnewline
12 & -0.192701 & -1.3211 & 0.096433 \tabularnewline
13 & -0.31303 & -2.146 & 0.018533 \tabularnewline
14 & -0.01731 & -0.1187 & 0.453021 \tabularnewline
15 & -0.25098 & -1.7206 & 0.045948 \tabularnewline
16 & -0.12768 & -0.8753 & 0.192924 \tabularnewline
17 & 0.055278 & 0.379 & 0.35321 \tabularnewline
\hline
\end{tabular}
%Source: https://freestatistics.org/blog/index.php?pk=36578&T=2

[TABLE]
[ROW][C]Partial Autocorrelation Function[/C][/ROW]
[ROW][C]Time lag k[/C][C]PACF(k)[/C][C]T-STAT[/C][C]P-value[/C][/ROW]
[ROW][C]1[/C][C]-0.518032[/C][C]-3.5515[/C][C]0.000442[/C][/ROW]
[ROW][C]2[/C][C]-0.13651[/C][C]-0.9359[/C][C]0.177064[/C][/ROW]
[ROW][C]3[/C][C]-0.274385[/C][C]-1.8811[/C][C]0.033082[/C][/ROW]
[ROW][C]4[/C][C]-0.174895[/C][C]-1.199[/C][C]0.118265[/C][/ROW]
[ROW][C]5[/C][C]-0.133175[/C][C]-0.913[/C][C]0.182951[/C][/ROW]
[ROW][C]6[/C][C]0.083041[/C][C]0.5693[/C][C]0.285931[/C][/ROW]
[ROW][C]7[/C][C]-0.056875[/C][C]-0.3899[/C][C]0.349181[/C][/ROW]
[ROW][C]8[/C][C]-0.315899[/C][C]-2.1657[/C][C]0.017721[/C][/ROW]
[ROW][C]9[/C][C]0.263521[/C][C]1.8066[/C][C]0.038614[/C][/ROW]
[ROW][C]10[/C][C]-0.03192[/C][C]-0.2188[/C][C]0.413863[/C][/ROW]
[ROW][C]11[/C][C]0.150405[/C][C]1.0311[/C][C]0.153879[/C][/ROW]
[ROW][C]12[/C][C]-0.192701[/C][C]-1.3211[/C][C]0.096433[/C][/ROW]
[ROW][C]13[/C][C]-0.31303[/C][C]-2.146[/C][C]0.018533[/C][/ROW]
[ROW][C]14[/C][C]-0.01731[/C][C]-0.1187[/C][C]0.453021[/C][/ROW]
[ROW][C]15[/C][C]-0.25098[/C][C]-1.7206[/C][C]0.045948[/C][/ROW]
[ROW][C]16[/C][C]-0.12768[/C][C]-0.8753[/C][C]0.192924[/C][/ROW]
[ROW][C]17[/C][C]0.055278[/C][C]0.379[/C][C]0.35321[/C][/ROW]
[/TABLE]
Source: https://freestatistics.org/blog/index.php?pk=36578&T=2

Globally Unique Identifier (entire table): ba.freestatistics.org/blog/index.php?pk=36578&T=2

As an alternative you can also use a QR Code:  

The GUIDs for individual cells are displayed in the table below:

Partial Autocorrelation Function
Time lag kPACF(k)T-STATP-value
1-0.518032-3.55150.000442
2-0.13651-0.93590.177064
3-0.274385-1.88110.033082
4-0.174895-1.1990.118265
5-0.133175-0.9130.182951
60.0830410.56930.285931
7-0.056875-0.38990.349181
8-0.315899-2.16570.017721
90.2635211.80660.038614
10-0.03192-0.21880.413863
110.1504051.03110.153879
12-0.192701-1.32110.096433
13-0.31303-2.1460.018533
14-0.01731-0.11870.453021
15-0.25098-1.72060.045948
16-0.12768-0.87530.192924
170.0552780.3790.35321


Parameters (Session):
par1 = Default ; par2 = 1 ; par3 = 1 ; par4 = 1 ; par5 = 12 ;
Parameters (R input):
par1 = Default ; par2 = 1 ; par3 = 1 ; par4 = 1 ; par5 = 12 ;
R code (references can be found in the software module):
if (par1 == 'Default') {
par1 = 10*log10(length(x))
} else {
par1 <- as.numeric(par1)
}
par2 <- as.numeric(par2)
par3 <- as.numeric(par3)
par4 <- as.numeric(par4)
par5 <- as.numeric(par5)
if (par2 == 0) {
x <- log(x)
} else {
x <- (x ^ par2 - 1) / par2
}
if (par3 > 0) x <- diff(x,lag=1,difference=par3)
if (par4 > 0) x <- diff(x,lag=par5,difference=par4)
bitmap(file='pic1.png')
racf <- acf(x,par1,main='Autocorrelation',xlab='lags',ylab='ACF')
dev.off()
bitmap(file='pic2.png')
rpacf <- pacf(x,par1,main='Partial Autocorrelation',xlab='lags',ylab='PACF')
dev.off()
(myacf <- c(racf$acf))
(mypacf <- c(rpacf$acf))
lengthx <- length(x)
sqrtn <- sqrt(lengthx)
load(file='createtable')
a<-table.start()
a<-table.row.start(a)
a<-table.element(a,'Autocorrelation Function',4,TRUE)
a<-table.row.end(a)
a<-table.row.start(a)
a<-table.element(a,'Time lag k',header=TRUE)
a<-table.element(a,hyperlink('basics.htm','ACF(k)','click here for more information about the Autocorrelation Function'),header=TRUE)
a<-table.element(a,'T-STAT',header=TRUE)
a<-table.element(a,'P-value',header=TRUE)
a<-table.row.end(a)
for (i in 2:(par1+1)) {
a<-table.row.start(a)
a<-table.element(a,i-1,header=TRUE)
a<-table.element(a,round(myacf[i],6))
mytstat <- myacf[i]*sqrtn
a<-table.element(a,round(mytstat,4))
a<-table.element(a,round(1-pt(abs(mytstat),lengthx),6))
a<-table.row.end(a)
}
a<-table.end(a)
table.save(a,file='mytable.tab')
a<-table.start()
a<-table.row.start(a)
a<-table.element(a,'Partial Autocorrelation Function',4,TRUE)
a<-table.row.end(a)
a<-table.row.start(a)
a<-table.element(a,'Time lag k',header=TRUE)
a<-table.element(a,hyperlink('basics.htm','PACF(k)','click here for more information about the Partial Autocorrelation Function'),header=TRUE)
a<-table.element(a,'T-STAT',header=TRUE)
a<-table.element(a,'P-value',header=TRUE)
a<-table.row.end(a)
for (i in 1:par1) {
a<-table.row.start(a)
a<-table.element(a,i,header=TRUE)
a<-table.element(a,round(mypacf[i],6))
mytstat <- mypacf[i]*sqrtn
a<-table.element(a,round(mytstat,4))
a<-table.element(a,round(1-pt(abs(mytstat),lengthx),6))
a<-table.row.end(a)
}
a<-table.end(a)
table.save(a,file='mytable1.tab')