Free Statistics

of Irreproducible Research!

Author's title

Author*Unverified author*
R Software Modulerwasp_autocorrelation.wasp
Title produced by software(Partial) Autocorrelation Function
Date of computationWed, 24 Dec 2008 07:08:07 -0700
Cite this page as followsStatistical Computations at FreeStatistics.org, Office for Research Development and Education, URL https://freestatistics.org/blog/index.php?v=date/2008/Dec/24/t1230127708g1jz7hy7751x969.htm/, Retrieved Fri, 17 May 2024 21:18:46 +0000
Statistical Computations at FreeStatistics.org, Office for Research Development and Education, URL https://freestatistics.org/blog/index.php?pk=36575, Retrieved Fri, 17 May 2024 21:18:46 +0000
QR Codes:

Original text written by user:
IsPrivate?No (this computation is public)
User-defined keywords
Estimated Impact163
Family? (F = Feedback message, R = changed R code, M = changed R Module, P = changed Parameters, D = changed Data)
-     [(Partial) Autocorrelation Function] [autocorrelatie: e...] [2007-12-15 09:28:58] [707a919fab5d6f3020ea3c395672cd86]
- R PD    [(Partial) Autocorrelation Function] [Nick Mulkens] [2008-12-24 14:08:07] [d41d8cd98f00b204e9800998ecf8427e] [Current]
Feedback Forum

Post a new message
Dataseries X:
544.50
619.80
777.60
640.40
633.00
722.00
860.10
495.10
692.80
766.70
648.50
640.00
681.60
752.50
1031.70
685.50
887.60
655.40
944.20
626.60
1221.80
939.60
886.60
811.30
774.70
910.60
911.60
697.70
829.80
824.30
885.60
538.90
686.00
878.70
812.70
640.40
773.90
795.90
836.30
876.10
851.70
692.40
877.30
536.80
705.90
951.00
755.70
695.50
744.80
672.10
666.60
760.80
756.00
604.40
883.90
527.90
756.20
812.90
655.60
707.60


Summary of computational transaction
Raw Inputview raw input (R code)
Raw Outputview raw output of R engine
Computing time3 seconds
R Server'Herman Ole Andreas Wold' @ 193.190.124.10:1001

\begin{tabular}{lllllllll}
\hline
Summary of computational transaction \tabularnewline
Raw Input & view raw input (R code)  \tabularnewline
Raw Output & view raw output of R engine  \tabularnewline
Computing time & 3 seconds \tabularnewline
R Server & 'Herman Ole Andreas Wold' @ 193.190.124.10:1001 \tabularnewline
\hline
\end{tabular}
%Source: https://freestatistics.org/blog/index.php?pk=36575&T=0

[TABLE]
[ROW][C]Summary of computational transaction[/C][/ROW]
[ROW][C]Raw Input[/C][C]view raw input (R code) [/C][/ROW]
[ROW][C]Raw Output[/C][C]view raw output of R engine [/C][/ROW]
[ROW][C]Computing time[/C][C]3 seconds[/C][/ROW]
[ROW][C]R Server[/C][C]'Herman Ole Andreas Wold' @ 193.190.124.10:1001[/C][/ROW]
[/TABLE]
Source: https://freestatistics.org/blog/index.php?pk=36575&T=0

Globally Unique Identifier (entire table): ba.freestatistics.org/blog/index.php?pk=36575&T=0

As an alternative you can also use a QR Code:  

The GUIDs for individual cells are displayed in the table below:

Summary of computational transaction
Raw Inputview raw input (R code)
Raw Outputview raw output of R engine
Computing time3 seconds
R Server'Herman Ole Andreas Wold' @ 193.190.124.10:1001


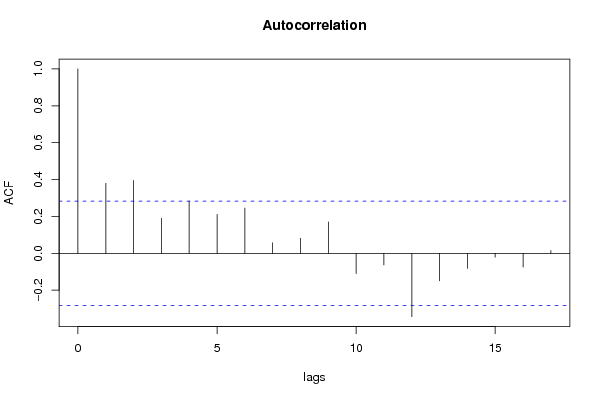
Autocorrelation Function
Time lag kACF(k)T-STATP-value
10.3798182.63150.005699
20.3951632.73780.004326
30.190111.31710.097026
40.2835991.96480.027618
50.2107831.46030.075355
60.2454431.70050.047756
70.0568940.39420.347599
80.0818040.56680.286761
90.1701331.17870.122161
10-0.109653-0.75970.225576
11-0.063016-0.43660.332183
12-0.343709-2.38130.010633
13-0.149445-1.03540.152838
14-0.082475-0.57140.285197
15-0.02115-0.14650.442059
16-0.07456-0.51660.303915
170.0147320.10210.459565

\begin{tabular}{lllllllll}
\hline
Autocorrelation Function \tabularnewline
Time lag k & ACF(k) & T-STAT & P-value \tabularnewline
1 & 0.379818 & 2.6315 & 0.005699 \tabularnewline
2 & 0.395163 & 2.7378 & 0.004326 \tabularnewline
3 & 0.19011 & 1.3171 & 0.097026 \tabularnewline
4 & 0.283599 & 1.9648 & 0.027618 \tabularnewline
5 & 0.210783 & 1.4603 & 0.075355 \tabularnewline
6 & 0.245443 & 1.7005 & 0.047756 \tabularnewline
7 & 0.056894 & 0.3942 & 0.347599 \tabularnewline
8 & 0.081804 & 0.5668 & 0.286761 \tabularnewline
9 & 0.170133 & 1.1787 & 0.122161 \tabularnewline
10 & -0.109653 & -0.7597 & 0.225576 \tabularnewline
11 & -0.063016 & -0.4366 & 0.332183 \tabularnewline
12 & -0.343709 & -2.3813 & 0.010633 \tabularnewline
13 & -0.149445 & -1.0354 & 0.152838 \tabularnewline
14 & -0.082475 & -0.5714 & 0.285197 \tabularnewline
15 & -0.02115 & -0.1465 & 0.442059 \tabularnewline
16 & -0.07456 & -0.5166 & 0.303915 \tabularnewline
17 & 0.014732 & 0.1021 & 0.459565 \tabularnewline
\hline
\end{tabular}
%Source: https://freestatistics.org/blog/index.php?pk=36575&T=1

[TABLE]
[ROW][C]Autocorrelation Function[/C][/ROW]
[ROW][C]Time lag k[/C][C]ACF(k)[/C][C]T-STAT[/C][C]P-value[/C][/ROW]
[ROW][C]1[/C][C]0.379818[/C][C]2.6315[/C][C]0.005699[/C][/ROW]
[ROW][C]2[/C][C]0.395163[/C][C]2.7378[/C][C]0.004326[/C][/ROW]
[ROW][C]3[/C][C]0.19011[/C][C]1.3171[/C][C]0.097026[/C][/ROW]
[ROW][C]4[/C][C]0.283599[/C][C]1.9648[/C][C]0.027618[/C][/ROW]
[ROW][C]5[/C][C]0.210783[/C][C]1.4603[/C][C]0.075355[/C][/ROW]
[ROW][C]6[/C][C]0.245443[/C][C]1.7005[/C][C]0.047756[/C][/ROW]
[ROW][C]7[/C][C]0.056894[/C][C]0.3942[/C][C]0.347599[/C][/ROW]
[ROW][C]8[/C][C]0.081804[/C][C]0.5668[/C][C]0.286761[/C][/ROW]
[ROW][C]9[/C][C]0.170133[/C][C]1.1787[/C][C]0.122161[/C][/ROW]
[ROW][C]10[/C][C]-0.109653[/C][C]-0.7597[/C][C]0.225576[/C][/ROW]
[ROW][C]11[/C][C]-0.063016[/C][C]-0.4366[/C][C]0.332183[/C][/ROW]
[ROW][C]12[/C][C]-0.343709[/C][C]-2.3813[/C][C]0.010633[/C][/ROW]
[ROW][C]13[/C][C]-0.149445[/C][C]-1.0354[/C][C]0.152838[/C][/ROW]
[ROW][C]14[/C][C]-0.082475[/C][C]-0.5714[/C][C]0.285197[/C][/ROW]
[ROW][C]15[/C][C]-0.02115[/C][C]-0.1465[/C][C]0.442059[/C][/ROW]
[ROW][C]16[/C][C]-0.07456[/C][C]-0.5166[/C][C]0.303915[/C][/ROW]
[ROW][C]17[/C][C]0.014732[/C][C]0.1021[/C][C]0.459565[/C][/ROW]
[/TABLE]
Source: https://freestatistics.org/blog/index.php?pk=36575&T=1

Globally Unique Identifier (entire table): ba.freestatistics.org/blog/index.php?pk=36575&T=1

As an alternative you can also use a QR Code:  

The GUIDs for individual cells are displayed in the table below:

Autocorrelation Function
Time lag kACF(k)T-STATP-value
10.3798182.63150.005699
20.3951632.73780.004326
30.190111.31710.097026
40.2835991.96480.027618
50.2107831.46030.075355
60.2454431.70050.047756
70.0568940.39420.347599
80.0818040.56680.286761
90.1701331.17870.122161
10-0.109653-0.75970.225576
11-0.063016-0.43660.332183
12-0.343709-2.38130.010633
13-0.149445-1.03540.152838
14-0.082475-0.57140.285197
15-0.02115-0.14650.442059
16-0.07456-0.51660.303915
170.0147320.10210.459565


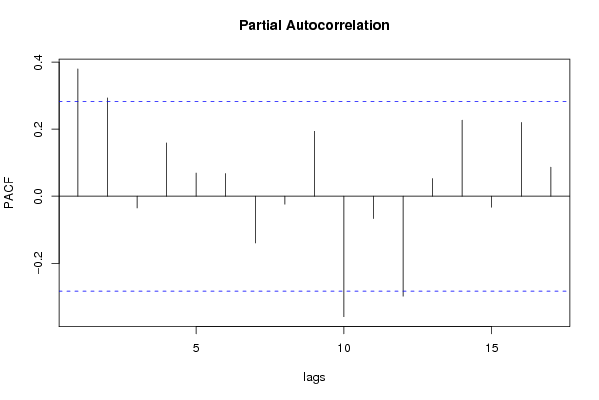
Partial Autocorrelation Function
Time lag kPACF(k)T-STATP-value
10.3798182.63150.005699
20.2931992.03130.023889
3-0.03495-0.24210.404853
40.1591371.10250.137864
50.0691980.47940.31691
60.0675150.46780.321038
7-0.139297-0.96510.169672
8-0.023802-0.16490.434855
90.1939041.34340.092729
10-0.35933-2.48950.008155
11-0.066621-0.46160.32324
12-0.298263-2.06640.022103
130.0527210.36530.35826
140.2267751.57110.061359
15-0.032693-0.22650.410886
160.2202711.52610.066776
170.0865610.59970.275759

\begin{tabular}{lllllllll}
\hline
Partial Autocorrelation Function \tabularnewline
Time lag k & PACF(k) & T-STAT & P-value \tabularnewline
1 & 0.379818 & 2.6315 & 0.005699 \tabularnewline
2 & 0.293199 & 2.0313 & 0.023889 \tabularnewline
3 & -0.03495 & -0.2421 & 0.404853 \tabularnewline
4 & 0.159137 & 1.1025 & 0.137864 \tabularnewline
5 & 0.069198 & 0.4794 & 0.31691 \tabularnewline
6 & 0.067515 & 0.4678 & 0.321038 \tabularnewline
7 & -0.139297 & -0.9651 & 0.169672 \tabularnewline
8 & -0.023802 & -0.1649 & 0.434855 \tabularnewline
9 & 0.193904 & 1.3434 & 0.092729 \tabularnewline
10 & -0.35933 & -2.4895 & 0.008155 \tabularnewline
11 & -0.066621 & -0.4616 & 0.32324 \tabularnewline
12 & -0.298263 & -2.0664 & 0.022103 \tabularnewline
13 & 0.052721 & 0.3653 & 0.35826 \tabularnewline
14 & 0.226775 & 1.5711 & 0.061359 \tabularnewline
15 & -0.032693 & -0.2265 & 0.410886 \tabularnewline
16 & 0.220271 & 1.5261 & 0.066776 \tabularnewline
17 & 0.086561 & 0.5997 & 0.275759 \tabularnewline
\hline
\end{tabular}
%Source: https://freestatistics.org/blog/index.php?pk=36575&T=2

[TABLE]
[ROW][C]Partial Autocorrelation Function[/C][/ROW]
[ROW][C]Time lag k[/C][C]PACF(k)[/C][C]T-STAT[/C][C]P-value[/C][/ROW]
[ROW][C]1[/C][C]0.379818[/C][C]2.6315[/C][C]0.005699[/C][/ROW]
[ROW][C]2[/C][C]0.293199[/C][C]2.0313[/C][C]0.023889[/C][/ROW]
[ROW][C]3[/C][C]-0.03495[/C][C]-0.2421[/C][C]0.404853[/C][/ROW]
[ROW][C]4[/C][C]0.159137[/C][C]1.1025[/C][C]0.137864[/C][/ROW]
[ROW][C]5[/C][C]0.069198[/C][C]0.4794[/C][C]0.31691[/C][/ROW]
[ROW][C]6[/C][C]0.067515[/C][C]0.4678[/C][C]0.321038[/C][/ROW]
[ROW][C]7[/C][C]-0.139297[/C][C]-0.9651[/C][C]0.169672[/C][/ROW]
[ROW][C]8[/C][C]-0.023802[/C][C]-0.1649[/C][C]0.434855[/C][/ROW]
[ROW][C]9[/C][C]0.193904[/C][C]1.3434[/C][C]0.092729[/C][/ROW]
[ROW][C]10[/C][C]-0.35933[/C][C]-2.4895[/C][C]0.008155[/C][/ROW]
[ROW][C]11[/C][C]-0.066621[/C][C]-0.4616[/C][C]0.32324[/C][/ROW]
[ROW][C]12[/C][C]-0.298263[/C][C]-2.0664[/C][C]0.022103[/C][/ROW]
[ROW][C]13[/C][C]0.052721[/C][C]0.3653[/C][C]0.35826[/C][/ROW]
[ROW][C]14[/C][C]0.226775[/C][C]1.5711[/C][C]0.061359[/C][/ROW]
[ROW][C]15[/C][C]-0.032693[/C][C]-0.2265[/C][C]0.410886[/C][/ROW]
[ROW][C]16[/C][C]0.220271[/C][C]1.5261[/C][C]0.066776[/C][/ROW]
[ROW][C]17[/C][C]0.086561[/C][C]0.5997[/C][C]0.275759[/C][/ROW]
[/TABLE]
Source: https://freestatistics.org/blog/index.php?pk=36575&T=2

Globally Unique Identifier (entire table): ba.freestatistics.org/blog/index.php?pk=36575&T=2

As an alternative you can also use a QR Code:  

The GUIDs for individual cells are displayed in the table below:

Partial Autocorrelation Function
Time lag kPACF(k)T-STATP-value
10.3798182.63150.005699
20.2931992.03130.023889
3-0.03495-0.24210.404853
40.1591371.10250.137864
50.0691980.47940.31691
60.0675150.46780.321038
7-0.139297-0.96510.169672
8-0.023802-0.16490.434855
90.1939041.34340.092729
10-0.35933-2.48950.008155
11-0.066621-0.46160.32324
12-0.298263-2.06640.022103
130.0527210.36530.35826
140.2267751.57110.061359
15-0.032693-0.22650.410886
160.2202711.52610.066776
170.0865610.59970.275759


Parameters (Session):
par1 = Default ; par2 = 1 ; par3 = 0 ; par4 = 1 ; par5 = 12 ;
Parameters (R input):
par1 = Default ; par2 = 1 ; par3 = 0 ; par4 = 1 ; par5 = 12 ;
R code (references can be found in the software module):
if (par1 == 'Default') {
par1 = 10*log10(length(x))
} else {
par1 <- as.numeric(par1)
}
par2 <- as.numeric(par2)
par3 <- as.numeric(par3)
par4 <- as.numeric(par4)
par5 <- as.numeric(par5)
if (par2 == 0) {
x <- log(x)
} else {
x <- (x ^ par2 - 1) / par2
}
if (par3 > 0) x <- diff(x,lag=1,difference=par3)
if (par4 > 0) x <- diff(x,lag=par5,difference=par4)
bitmap(file='pic1.png')
racf <- acf(x,par1,main='Autocorrelation',xlab='lags',ylab='ACF')
dev.off()
bitmap(file='pic2.png')
rpacf <- pacf(x,par1,main='Partial Autocorrelation',xlab='lags',ylab='PACF')
dev.off()
(myacf <- c(racf$acf))
(mypacf <- c(rpacf$acf))
lengthx <- length(x)
sqrtn <- sqrt(lengthx)
load(file='createtable')
a<-table.start()
a<-table.row.start(a)
a<-table.element(a,'Autocorrelation Function',4,TRUE)
a<-table.row.end(a)
a<-table.row.start(a)
a<-table.element(a,'Time lag k',header=TRUE)
a<-table.element(a,hyperlink('basics.htm','ACF(k)','click here for more information about the Autocorrelation Function'),header=TRUE)
a<-table.element(a,'T-STAT',header=TRUE)
a<-table.element(a,'P-value',header=TRUE)
a<-table.row.end(a)
for (i in 2:(par1+1)) {
a<-table.row.start(a)
a<-table.element(a,i-1,header=TRUE)
a<-table.element(a,round(myacf[i],6))
mytstat <- myacf[i]*sqrtn
a<-table.element(a,round(mytstat,4))
a<-table.element(a,round(1-pt(abs(mytstat),lengthx),6))
a<-table.row.end(a)
}
a<-table.end(a)
table.save(a,file='mytable.tab')
a<-table.start()
a<-table.row.start(a)
a<-table.element(a,'Partial Autocorrelation Function',4,TRUE)
a<-table.row.end(a)
a<-table.row.start(a)
a<-table.element(a,'Time lag k',header=TRUE)
a<-table.element(a,hyperlink('basics.htm','PACF(k)','click here for more information about the Partial Autocorrelation Function'),header=TRUE)
a<-table.element(a,'T-STAT',header=TRUE)
a<-table.element(a,'P-value',header=TRUE)
a<-table.row.end(a)
for (i in 1:par1) {
a<-table.row.start(a)
a<-table.element(a,i,header=TRUE)
a<-table.element(a,round(mypacf[i],6))
mytstat <- mypacf[i]*sqrtn
a<-table.element(a,round(mytstat,4))
a<-table.element(a,round(1-pt(abs(mytstat),lengthx),6))
a<-table.row.end(a)
}
a<-table.end(a)
table.save(a,file='mytable1.tab')