Free Statistics

of Irreproducible Research!

Author's title

Author*Unverified author*
R Software Modulerwasp_autocorrelation.wasp
Title produced by software(Partial) Autocorrelation Function
Date of computationWed, 24 Dec 2008 06:02:19 -0700
Cite this page as followsStatistical Computations at FreeStatistics.org, Office for Research Development and Education, URL https://freestatistics.org/blog/index.php?v=date/2008/Dec/24/t12301238720918b4if7pvl3th.htm/, Retrieved Fri, 17 May 2024 09:27:53 +0000
Statistical Computations at FreeStatistics.org, Office for Research Development and Education, URL https://freestatistics.org/blog/index.php?pk=36545, Retrieved Fri, 17 May 2024 09:27:53 +0000
QR Codes:

Original text written by user:
IsPrivate?No (this computation is public)
User-defined keywords
Estimated Impact220
Family? (F = Feedback message, R = changed R code, M = changed R Module, P = changed Parameters, D = changed Data)
-     [(Partial) Autocorrelation Function] [autocorrelatie: d...] [2007-12-15 09:38:00] [707a919fab5d6f3020ea3c395672cd86]
- R  D    [(Partial) Autocorrelation Function] [Nick Mulkens] [2008-12-24 13:02:19] [d41d8cd98f00b204e9800998ecf8427e] [Current]
Feedback Forum

Post a new message
Dataseries X:
1.1608
1.1208
1.0883
1.0704
1.0628
1.0378
1.0353
1.0604
1.0501
1.0706
1.0338
1.011
1.0137
0.9834
0.9643
0.947
0.906
0.9492
0.9397
0.9041
0.8721
0.8552
0.8564
0.8973
0.9383
0.9217
0.9095
0.892
0.8742
0.8532
0.8607
0.9005
0.9111
0.9059
0.8883
0.8924
0.8833
0.87
0.8758
0.8858
0.917
0.9554
0.9922
0.9778
0.9808
0.9811
1.0014
1.0183
1.0622
1.0773
1.0807
1.0848
1.1582
1.1663
1.1372
1.1139
1.1222
1.1692
1.1702
1.2286


Summary of computational transaction
Raw Inputview raw input (R code)
Raw Outputview raw output of R engine
Computing time2 seconds
R Server'Gwilym Jenkins' @ 72.249.127.135

\begin{tabular}{lllllllll}
\hline
Summary of computational transaction \tabularnewline
Raw Input & view raw input (R code)  \tabularnewline
Raw Output & view raw output of R engine  \tabularnewline
Computing time & 2 seconds \tabularnewline
R Server & 'Gwilym Jenkins' @ 72.249.127.135 \tabularnewline
\hline
\end{tabular}
%Source: https://freestatistics.org/blog/index.php?pk=36545&T=0

[TABLE]
[ROW][C]Summary of computational transaction[/C][/ROW]
[ROW][C]Raw Input[/C][C]view raw input (R code) [/C][/ROW]
[ROW][C]Raw Output[/C][C]view raw output of R engine [/C][/ROW]
[ROW][C]Computing time[/C][C]2 seconds[/C][/ROW]
[ROW][C]R Server[/C][C]'Gwilym Jenkins' @ 72.249.127.135[/C][/ROW]
[/TABLE]
Source: https://freestatistics.org/blog/index.php?pk=36545&T=0

Globally Unique Identifier (entire table): ba.freestatistics.org/blog/index.php?pk=36545&T=0

As an alternative you can also use a QR Code:  

The GUIDs for individual cells are displayed in the table below:

Summary of computational transaction
Raw Inputview raw input (R code)
Raw Outputview raw output of R engine
Computing time2 seconds
R Server'Gwilym Jenkins' @ 72.249.127.135


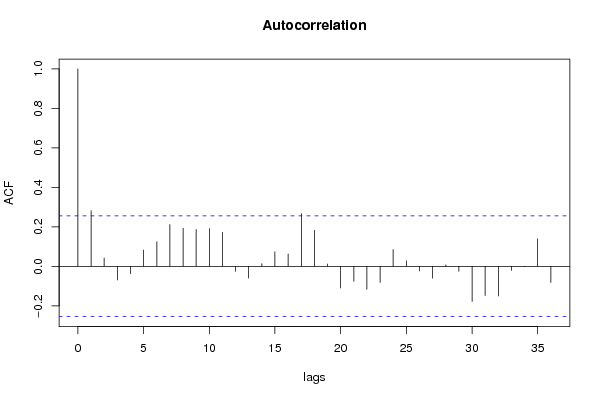
Autocorrelation Function
Time lag kACF(k)T-STATP-value
10.2816742.16360.017279
20.041520.31890.375457
3-0.068811-0.52850.299551
4-0.037998-0.29190.385706
50.0823440.63250.264753
60.12440.95550.171603
70.2117711.62660.054571
80.1929161.48180.071855
90.1867011.43410.078415
100.1910341.46740.073794
110.1719261.32060.09587
12-0.026059-0.20020.421021
13-0.059345-0.45580.325091
140.0133110.10220.459454
150.0731770.56210.288094
160.062510.48020.316447
170.2664052.04630.022596
180.1828061.40420.082757
190.011410.08760.465229
20-0.109716-0.84270.201388
21-0.076113-0.58460.28051
22-0.116634-0.89590.186978
23-0.081789-0.62820.266138
240.0850730.65350.258
250.027930.21450.415436
26-0.023855-0.18320.42762
27-0.060023-0.4610.323231
280.0073210.05620.477672
29-0.025701-0.19740.422091
30-0.178391-1.37020.087901
31-0.148413-1.140.12945
32-0.150256-1.15410.126548
33-0.020831-0.160.43671
34-0.002168-0.01670.493385
350.139041.0680.144939
36-0.082659-0.63490.263969

\begin{tabular}{lllllllll}
\hline
Autocorrelation Function \tabularnewline
Time lag k & ACF(k) & T-STAT & P-value \tabularnewline
1 & 0.281674 & 2.1636 & 0.017279 \tabularnewline
2 & 0.04152 & 0.3189 & 0.375457 \tabularnewline
3 & -0.068811 & -0.5285 & 0.299551 \tabularnewline
4 & -0.037998 & -0.2919 & 0.385706 \tabularnewline
5 & 0.082344 & 0.6325 & 0.264753 \tabularnewline
6 & 0.1244 & 0.9555 & 0.171603 \tabularnewline
7 & 0.211771 & 1.6266 & 0.054571 \tabularnewline
8 & 0.192916 & 1.4818 & 0.071855 \tabularnewline
9 & 0.186701 & 1.4341 & 0.078415 \tabularnewline
10 & 0.191034 & 1.4674 & 0.073794 \tabularnewline
11 & 0.171926 & 1.3206 & 0.09587 \tabularnewline
12 & -0.026059 & -0.2002 & 0.421021 \tabularnewline
13 & -0.059345 & -0.4558 & 0.325091 \tabularnewline
14 & 0.013311 & 0.1022 & 0.459454 \tabularnewline
15 & 0.073177 & 0.5621 & 0.288094 \tabularnewline
16 & 0.06251 & 0.4802 & 0.316447 \tabularnewline
17 & 0.266405 & 2.0463 & 0.022596 \tabularnewline
18 & 0.182806 & 1.4042 & 0.082757 \tabularnewline
19 & 0.01141 & 0.0876 & 0.465229 \tabularnewline
20 & -0.109716 & -0.8427 & 0.201388 \tabularnewline
21 & -0.076113 & -0.5846 & 0.28051 \tabularnewline
22 & -0.116634 & -0.8959 & 0.186978 \tabularnewline
23 & -0.081789 & -0.6282 & 0.266138 \tabularnewline
24 & 0.085073 & 0.6535 & 0.258 \tabularnewline
25 & 0.02793 & 0.2145 & 0.415436 \tabularnewline
26 & -0.023855 & -0.1832 & 0.42762 \tabularnewline
27 & -0.060023 & -0.461 & 0.323231 \tabularnewline
28 & 0.007321 & 0.0562 & 0.477672 \tabularnewline
29 & -0.025701 & -0.1974 & 0.422091 \tabularnewline
30 & -0.178391 & -1.3702 & 0.087901 \tabularnewline
31 & -0.148413 & -1.14 & 0.12945 \tabularnewline
32 & -0.150256 & -1.1541 & 0.126548 \tabularnewline
33 & -0.020831 & -0.16 & 0.43671 \tabularnewline
34 & -0.002168 & -0.0167 & 0.493385 \tabularnewline
35 & 0.13904 & 1.068 & 0.144939 \tabularnewline
36 & -0.082659 & -0.6349 & 0.263969 \tabularnewline
\hline
\end{tabular}
%Source: https://freestatistics.org/blog/index.php?pk=36545&T=1

[TABLE]
[ROW][C]Autocorrelation Function[/C][/ROW]
[ROW][C]Time lag k[/C][C]ACF(k)[/C][C]T-STAT[/C][C]P-value[/C][/ROW]
[ROW][C]1[/C][C]0.281674[/C][C]2.1636[/C][C]0.017279[/C][/ROW]
[ROW][C]2[/C][C]0.04152[/C][C]0.3189[/C][C]0.375457[/C][/ROW]
[ROW][C]3[/C][C]-0.068811[/C][C]-0.5285[/C][C]0.299551[/C][/ROW]
[ROW][C]4[/C][C]-0.037998[/C][C]-0.2919[/C][C]0.385706[/C][/ROW]
[ROW][C]5[/C][C]0.082344[/C][C]0.6325[/C][C]0.264753[/C][/ROW]
[ROW][C]6[/C][C]0.1244[/C][C]0.9555[/C][C]0.171603[/C][/ROW]
[ROW][C]7[/C][C]0.211771[/C][C]1.6266[/C][C]0.054571[/C][/ROW]
[ROW][C]8[/C][C]0.192916[/C][C]1.4818[/C][C]0.071855[/C][/ROW]
[ROW][C]9[/C][C]0.186701[/C][C]1.4341[/C][C]0.078415[/C][/ROW]
[ROW][C]10[/C][C]0.191034[/C][C]1.4674[/C][C]0.073794[/C][/ROW]
[ROW][C]11[/C][C]0.171926[/C][C]1.3206[/C][C]0.09587[/C][/ROW]
[ROW][C]12[/C][C]-0.026059[/C][C]-0.2002[/C][C]0.421021[/C][/ROW]
[ROW][C]13[/C][C]-0.059345[/C][C]-0.4558[/C][C]0.325091[/C][/ROW]
[ROW][C]14[/C][C]0.013311[/C][C]0.1022[/C][C]0.459454[/C][/ROW]
[ROW][C]15[/C][C]0.073177[/C][C]0.5621[/C][C]0.288094[/C][/ROW]
[ROW][C]16[/C][C]0.06251[/C][C]0.4802[/C][C]0.316447[/C][/ROW]
[ROW][C]17[/C][C]0.266405[/C][C]2.0463[/C][C]0.022596[/C][/ROW]
[ROW][C]18[/C][C]0.182806[/C][C]1.4042[/C][C]0.082757[/C][/ROW]
[ROW][C]19[/C][C]0.01141[/C][C]0.0876[/C][C]0.465229[/C][/ROW]
[ROW][C]20[/C][C]-0.109716[/C][C]-0.8427[/C][C]0.201388[/C][/ROW]
[ROW][C]21[/C][C]-0.076113[/C][C]-0.5846[/C][C]0.28051[/C][/ROW]
[ROW][C]22[/C][C]-0.116634[/C][C]-0.8959[/C][C]0.186978[/C][/ROW]
[ROW][C]23[/C][C]-0.081789[/C][C]-0.6282[/C][C]0.266138[/C][/ROW]
[ROW][C]24[/C][C]0.085073[/C][C]0.6535[/C][C]0.258[/C][/ROW]
[ROW][C]25[/C][C]0.02793[/C][C]0.2145[/C][C]0.415436[/C][/ROW]
[ROW][C]26[/C][C]-0.023855[/C][C]-0.1832[/C][C]0.42762[/C][/ROW]
[ROW][C]27[/C][C]-0.060023[/C][C]-0.461[/C][C]0.323231[/C][/ROW]
[ROW][C]28[/C][C]0.007321[/C][C]0.0562[/C][C]0.477672[/C][/ROW]
[ROW][C]29[/C][C]-0.025701[/C][C]-0.1974[/C][C]0.422091[/C][/ROW]
[ROW][C]30[/C][C]-0.178391[/C][C]-1.3702[/C][C]0.087901[/C][/ROW]
[ROW][C]31[/C][C]-0.148413[/C][C]-1.14[/C][C]0.12945[/C][/ROW]
[ROW][C]32[/C][C]-0.150256[/C][C]-1.1541[/C][C]0.126548[/C][/ROW]
[ROW][C]33[/C][C]-0.020831[/C][C]-0.16[/C][C]0.43671[/C][/ROW]
[ROW][C]34[/C][C]-0.002168[/C][C]-0.0167[/C][C]0.493385[/C][/ROW]
[ROW][C]35[/C][C]0.13904[/C][C]1.068[/C][C]0.144939[/C][/ROW]
[ROW][C]36[/C][C]-0.082659[/C][C]-0.6349[/C][C]0.263969[/C][/ROW]
[/TABLE]
Source: https://freestatistics.org/blog/index.php?pk=36545&T=1

Globally Unique Identifier (entire table): ba.freestatistics.org/blog/index.php?pk=36545&T=1

As an alternative you can also use a QR Code:  

The GUIDs for individual cells are displayed in the table below:

Autocorrelation Function
Time lag kACF(k)T-STATP-value
10.2816742.16360.017279
20.041520.31890.375457
3-0.068811-0.52850.299551
4-0.037998-0.29190.385706
50.0823440.63250.264753
60.12440.95550.171603
70.2117711.62660.054571
80.1929161.48180.071855
90.1867011.43410.078415
100.1910341.46740.073794
110.1719261.32060.09587
12-0.026059-0.20020.421021
13-0.059345-0.45580.325091
140.0133110.10220.459454
150.0731770.56210.288094
160.062510.48020.316447
170.2664052.04630.022596
180.1828061.40420.082757
190.011410.08760.465229
20-0.109716-0.84270.201388
21-0.076113-0.58460.28051
22-0.116634-0.89590.186978
23-0.081789-0.62820.266138
240.0850730.65350.258
250.027930.21450.415436
26-0.023855-0.18320.42762
27-0.060023-0.4610.323231
280.0073210.05620.477672
29-0.025701-0.19740.422091
30-0.178391-1.37020.087901
31-0.148413-1.140.12945
32-0.150256-1.15410.126548
33-0.020831-0.160.43671
34-0.002168-0.01670.493385
350.139041.0680.144939
36-0.082659-0.63490.263969


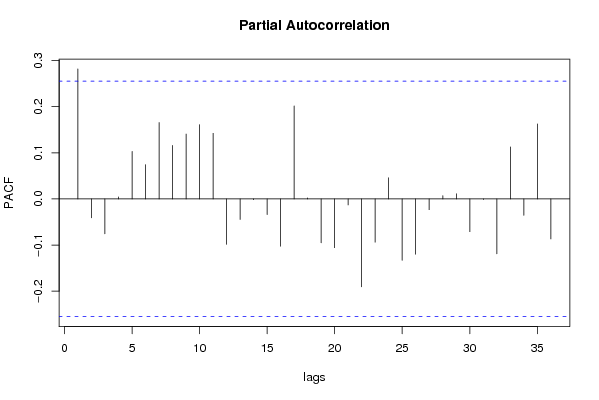
Partial Autocorrelation Function
Time lag kPACF(k)T-STATP-value
10.2816742.16360.017279
2-0.04108-0.31550.376732
3-0.075525-0.58010.282022
40.0044060.03380.486557
50.1028970.79040.216239
60.0741290.56940.285624
70.1654751.2710.104351
80.1158720.890.188532
90.1405761.07980.142316
100.1609031.23590.110693
110.1421621.0920.139643
12-0.098334-0.75530.226531
13-0.044461-0.34150.366965
14-0.001599-0.01230.495122
15-0.033865-0.26010.397837
16-0.102543-0.78770.217027
170.2014681.54750.063544
180.0021630.01660.493399
19-0.095218-0.73140.23372
20-0.105696-0.81190.210066
21-0.013071-0.10040.460183
22-0.190592-1.4640.074256
23-0.093659-0.71940.237364
240.0458080.35190.3631
25-0.13312-1.02250.155356
26-0.119738-0.91970.18073
27-0.023219-0.17830.42953
280.0071020.05460.47834
290.0110890.08520.466204
30-0.070992-0.54530.293801
31-0.001363-0.01050.495841
32-0.119076-0.91460.182052
330.1126590.86530.195176
34-0.035521-0.27280.392964
350.162531.24840.108405
36-0.086721-0.66610.253966

\begin{tabular}{lllllllll}
\hline
Partial Autocorrelation Function \tabularnewline
Time lag k & PACF(k) & T-STAT & P-value \tabularnewline
1 & 0.281674 & 2.1636 & 0.017279 \tabularnewline
2 & -0.04108 & -0.3155 & 0.376732 \tabularnewline
3 & -0.075525 & -0.5801 & 0.282022 \tabularnewline
4 & 0.004406 & 0.0338 & 0.486557 \tabularnewline
5 & 0.102897 & 0.7904 & 0.216239 \tabularnewline
6 & 0.074129 & 0.5694 & 0.285624 \tabularnewline
7 & 0.165475 & 1.271 & 0.104351 \tabularnewline
8 & 0.115872 & 0.89 & 0.188532 \tabularnewline
9 & 0.140576 & 1.0798 & 0.142316 \tabularnewline
10 & 0.160903 & 1.2359 & 0.110693 \tabularnewline
11 & 0.142162 & 1.092 & 0.139643 \tabularnewline
12 & -0.098334 & -0.7553 & 0.226531 \tabularnewline
13 & -0.044461 & -0.3415 & 0.366965 \tabularnewline
14 & -0.001599 & -0.0123 & 0.495122 \tabularnewline
15 & -0.033865 & -0.2601 & 0.397837 \tabularnewline
16 & -0.102543 & -0.7877 & 0.217027 \tabularnewline
17 & 0.201468 & 1.5475 & 0.063544 \tabularnewline
18 & 0.002163 & 0.0166 & 0.493399 \tabularnewline
19 & -0.095218 & -0.7314 & 0.23372 \tabularnewline
20 & -0.105696 & -0.8119 & 0.210066 \tabularnewline
21 & -0.013071 & -0.1004 & 0.460183 \tabularnewline
22 & -0.190592 & -1.464 & 0.074256 \tabularnewline
23 & -0.093659 & -0.7194 & 0.237364 \tabularnewline
24 & 0.045808 & 0.3519 & 0.3631 \tabularnewline
25 & -0.13312 & -1.0225 & 0.155356 \tabularnewline
26 & -0.119738 & -0.9197 & 0.18073 \tabularnewline
27 & -0.023219 & -0.1783 & 0.42953 \tabularnewline
28 & 0.007102 & 0.0546 & 0.47834 \tabularnewline
29 & 0.011089 & 0.0852 & 0.466204 \tabularnewline
30 & -0.070992 & -0.5453 & 0.293801 \tabularnewline
31 & -0.001363 & -0.0105 & 0.495841 \tabularnewline
32 & -0.119076 & -0.9146 & 0.182052 \tabularnewline
33 & 0.112659 & 0.8653 & 0.195176 \tabularnewline
34 & -0.035521 & -0.2728 & 0.392964 \tabularnewline
35 & 0.16253 & 1.2484 & 0.108405 \tabularnewline
36 & -0.086721 & -0.6661 & 0.253966 \tabularnewline
\hline
\end{tabular}
%Source: https://freestatistics.org/blog/index.php?pk=36545&T=2

[TABLE]
[ROW][C]Partial Autocorrelation Function[/C][/ROW]
[ROW][C]Time lag k[/C][C]PACF(k)[/C][C]T-STAT[/C][C]P-value[/C][/ROW]
[ROW][C]1[/C][C]0.281674[/C][C]2.1636[/C][C]0.017279[/C][/ROW]
[ROW][C]2[/C][C]-0.04108[/C][C]-0.3155[/C][C]0.376732[/C][/ROW]
[ROW][C]3[/C][C]-0.075525[/C][C]-0.5801[/C][C]0.282022[/C][/ROW]
[ROW][C]4[/C][C]0.004406[/C][C]0.0338[/C][C]0.486557[/C][/ROW]
[ROW][C]5[/C][C]0.102897[/C][C]0.7904[/C][C]0.216239[/C][/ROW]
[ROW][C]6[/C][C]0.074129[/C][C]0.5694[/C][C]0.285624[/C][/ROW]
[ROW][C]7[/C][C]0.165475[/C][C]1.271[/C][C]0.104351[/C][/ROW]
[ROW][C]8[/C][C]0.115872[/C][C]0.89[/C][C]0.188532[/C][/ROW]
[ROW][C]9[/C][C]0.140576[/C][C]1.0798[/C][C]0.142316[/C][/ROW]
[ROW][C]10[/C][C]0.160903[/C][C]1.2359[/C][C]0.110693[/C][/ROW]
[ROW][C]11[/C][C]0.142162[/C][C]1.092[/C][C]0.139643[/C][/ROW]
[ROW][C]12[/C][C]-0.098334[/C][C]-0.7553[/C][C]0.226531[/C][/ROW]
[ROW][C]13[/C][C]-0.044461[/C][C]-0.3415[/C][C]0.366965[/C][/ROW]
[ROW][C]14[/C][C]-0.001599[/C][C]-0.0123[/C][C]0.495122[/C][/ROW]
[ROW][C]15[/C][C]-0.033865[/C][C]-0.2601[/C][C]0.397837[/C][/ROW]
[ROW][C]16[/C][C]-0.102543[/C][C]-0.7877[/C][C]0.217027[/C][/ROW]
[ROW][C]17[/C][C]0.201468[/C][C]1.5475[/C][C]0.063544[/C][/ROW]
[ROW][C]18[/C][C]0.002163[/C][C]0.0166[/C][C]0.493399[/C][/ROW]
[ROW][C]19[/C][C]-0.095218[/C][C]-0.7314[/C][C]0.23372[/C][/ROW]
[ROW][C]20[/C][C]-0.105696[/C][C]-0.8119[/C][C]0.210066[/C][/ROW]
[ROW][C]21[/C][C]-0.013071[/C][C]-0.1004[/C][C]0.460183[/C][/ROW]
[ROW][C]22[/C][C]-0.190592[/C][C]-1.464[/C][C]0.074256[/C][/ROW]
[ROW][C]23[/C][C]-0.093659[/C][C]-0.7194[/C][C]0.237364[/C][/ROW]
[ROW][C]24[/C][C]0.045808[/C][C]0.3519[/C][C]0.3631[/C][/ROW]
[ROW][C]25[/C][C]-0.13312[/C][C]-1.0225[/C][C]0.155356[/C][/ROW]
[ROW][C]26[/C][C]-0.119738[/C][C]-0.9197[/C][C]0.18073[/C][/ROW]
[ROW][C]27[/C][C]-0.023219[/C][C]-0.1783[/C][C]0.42953[/C][/ROW]
[ROW][C]28[/C][C]0.007102[/C][C]0.0546[/C][C]0.47834[/C][/ROW]
[ROW][C]29[/C][C]0.011089[/C][C]0.0852[/C][C]0.466204[/C][/ROW]
[ROW][C]30[/C][C]-0.070992[/C][C]-0.5453[/C][C]0.293801[/C][/ROW]
[ROW][C]31[/C][C]-0.001363[/C][C]-0.0105[/C][C]0.495841[/C][/ROW]
[ROW][C]32[/C][C]-0.119076[/C][C]-0.9146[/C][C]0.182052[/C][/ROW]
[ROW][C]33[/C][C]0.112659[/C][C]0.8653[/C][C]0.195176[/C][/ROW]
[ROW][C]34[/C][C]-0.035521[/C][C]-0.2728[/C][C]0.392964[/C][/ROW]
[ROW][C]35[/C][C]0.16253[/C][C]1.2484[/C][C]0.108405[/C][/ROW]
[ROW][C]36[/C][C]-0.086721[/C][C]-0.6661[/C][C]0.253966[/C][/ROW]
[/TABLE]
Source: https://freestatistics.org/blog/index.php?pk=36545&T=2

Globally Unique Identifier (entire table): ba.freestatistics.org/blog/index.php?pk=36545&T=2

As an alternative you can also use a QR Code:  

The GUIDs for individual cells are displayed in the table below:

Partial Autocorrelation Function
Time lag kPACF(k)T-STATP-value
10.2816742.16360.017279
2-0.04108-0.31550.376732
3-0.075525-0.58010.282022
40.0044060.03380.486557
50.1028970.79040.216239
60.0741290.56940.285624
70.1654751.2710.104351
80.1158720.890.188532
90.1405761.07980.142316
100.1609031.23590.110693
110.1421621.0920.139643
12-0.098334-0.75530.226531
13-0.044461-0.34150.366965
14-0.001599-0.01230.495122
15-0.033865-0.26010.397837
16-0.102543-0.78770.217027
170.2014681.54750.063544
180.0021630.01660.493399
19-0.095218-0.73140.23372
20-0.105696-0.81190.210066
21-0.013071-0.10040.460183
22-0.190592-1.4640.074256
23-0.093659-0.71940.237364
240.0458080.35190.3631
25-0.13312-1.02250.155356
26-0.119738-0.91970.18073
27-0.023219-0.17830.42953
280.0071020.05460.47834
290.0110890.08520.466204
30-0.070992-0.54530.293801
31-0.001363-0.01050.495841
32-0.119076-0.91460.182052
330.1126590.86530.195176
34-0.035521-0.27280.392964
350.162531.24840.108405
36-0.086721-0.66610.253966


Parameters (Session):
par1 = 36 ; par2 = 1 ; par3 = 1 ; par4 = 0 ; par5 = 12 ;
Parameters (R input):
par1 = 36 ; par2 = 1 ; par3 = 1 ; par4 = 0 ; par5 = 12 ;
R code (references can be found in the software module):
if (par1 == 'Default') {
par1 = 10*log10(length(x))
} else {
par1 <- as.numeric(par1)
}
par2 <- as.numeric(par2)
par3 <- as.numeric(par3)
par4 <- as.numeric(par4)
par5 <- as.numeric(par5)
if (par2 == 0) {
x <- log(x)
} else {
x <- (x ^ par2 - 1) / par2
}
if (par3 > 0) x <- diff(x,lag=1,difference=par3)
if (par4 > 0) x <- diff(x,lag=par5,difference=par4)
bitmap(file='pic1.png')
racf <- acf(x,par1,main='Autocorrelation',xlab='lags',ylab='ACF')
dev.off()
bitmap(file='pic2.png')
rpacf <- pacf(x,par1,main='Partial Autocorrelation',xlab='lags',ylab='PACF')
dev.off()
(myacf <- c(racf$acf))
(mypacf <- c(rpacf$acf))
lengthx <- length(x)
sqrtn <- sqrt(lengthx)
load(file='createtable')
a<-table.start()
a<-table.row.start(a)
a<-table.element(a,'Autocorrelation Function',4,TRUE)
a<-table.row.end(a)
a<-table.row.start(a)
a<-table.element(a,'Time lag k',header=TRUE)
a<-table.element(a,hyperlink('basics.htm','ACF(k)','click here for more information about the Autocorrelation Function'),header=TRUE)
a<-table.element(a,'T-STAT',header=TRUE)
a<-table.element(a,'P-value',header=TRUE)
a<-table.row.end(a)
for (i in 2:(par1+1)) {
a<-table.row.start(a)
a<-table.element(a,i-1,header=TRUE)
a<-table.element(a,round(myacf[i],6))
mytstat <- myacf[i]*sqrtn
a<-table.element(a,round(mytstat,4))
a<-table.element(a,round(1-pt(abs(mytstat),lengthx),6))
a<-table.row.end(a)
}
a<-table.end(a)
table.save(a,file='mytable.tab')
a<-table.start()
a<-table.row.start(a)
a<-table.element(a,'Partial Autocorrelation Function',4,TRUE)
a<-table.row.end(a)
a<-table.row.start(a)
a<-table.element(a,'Time lag k',header=TRUE)
a<-table.element(a,hyperlink('basics.htm','PACF(k)','click here for more information about the Partial Autocorrelation Function'),header=TRUE)
a<-table.element(a,'T-STAT',header=TRUE)
a<-table.element(a,'P-value',header=TRUE)
a<-table.row.end(a)
for (i in 1:par1) {
a<-table.row.start(a)
a<-table.element(a,i,header=TRUE)
a<-table.element(a,round(mypacf[i],6))
mytstat <- mypacf[i]*sqrtn
a<-table.element(a,round(mytstat,4))
a<-table.element(a,round(1-pt(abs(mytstat),lengthx),6))
a<-table.row.end(a)
}
a<-table.end(a)
table.save(a,file='mytable1.tab')