Free Statistics

of Irreproducible Research!

Author's title

Author*Unverified author*
R Software Modulerwasp_autocorrelation.wasp
Title produced by software(Partial) Autocorrelation Function
Date of computationWed, 24 Dec 2008 05:58:14 -0700
Cite this page as followsStatistical Computations at FreeStatistics.org, Office for Research Development and Education, URL https://freestatistics.org/blog/index.php?v=date/2008/Dec/24/t1230123520tukg3wye3b299uw.htm/, Retrieved Fri, 17 May 2024 22:07:53 +0000
Statistical Computations at FreeStatistics.org, Office for Research Development and Education, URL https://freestatistics.org/blog/index.php?pk=36540, Retrieved Fri, 17 May 2024 22:07:53 +0000
QR Codes:

Original text written by user:
IsPrivate?No (this computation is public)
User-defined keywords
Estimated Impact187
Family? (F = Feedback message, R = changed R code, M = changed R Module, P = changed Parameters, D = changed Data)
-     [(Partial) Autocorrelation Function] [autocorrelatie: d...] [2007-12-15 09:35:42] [707a919fab5d6f3020ea3c395672cd86]
- R  D    [(Partial) Autocorrelation Function] [Nick Mulkens] [2008-12-24 12:58:14] [d41d8cd98f00b204e9800998ecf8427e] [Current]
Feedback Forum

Post a new message
Dataseries X:
1.1608
1.1208
1.0883
1.0704
1.0628
1.0378
1.0353
1.0604
1.0501
1.0706
1.0338
1.011
1.0137
0.9834
0.9643
0.947
0.906
0.9492
0.9397
0.9041
0.8721
0.8552
0.8564
0.8973
0.9383
0.9217
0.9095
0.892
0.8742
0.8532
0.8607
0.9005
0.9111
0.9059
0.8883
0.8924
0.8833
0.87
0.8758
0.8858
0.917
0.9554
0.9922
0.9778
0.9808
0.9811
1.0014
1.0183
1.0622
1.0773
1.0807
1.0848
1.1582
1.1663
1.1372
1.1139
1.1222
1.1692
1.1702
1.2286


Summary of computational transaction
Raw Inputview raw input (R code)
Raw Outputview raw output of R engine
Computing time1 seconds
R Server'Gwilym Jenkins' @ 72.249.127.135

\begin{tabular}{lllllllll}
\hline
Summary of computational transaction \tabularnewline
Raw Input & view raw input (R code)  \tabularnewline
Raw Output & view raw output of R engine  \tabularnewline
Computing time & 1 seconds \tabularnewline
R Server & 'Gwilym Jenkins' @ 72.249.127.135 \tabularnewline
\hline
\end{tabular}
%Source: https://freestatistics.org/blog/index.php?pk=36540&T=0

[TABLE]
[ROW][C]Summary of computational transaction[/C][/ROW]
[ROW][C]Raw Input[/C][C]view raw input (R code) [/C][/ROW]
[ROW][C]Raw Output[/C][C]view raw output of R engine [/C][/ROW]
[ROW][C]Computing time[/C][C]1 seconds[/C][/ROW]
[ROW][C]R Server[/C][C]'Gwilym Jenkins' @ 72.249.127.135[/C][/ROW]
[/TABLE]
Source: https://freestatistics.org/blog/index.php?pk=36540&T=0

Globally Unique Identifier (entire table): ba.freestatistics.org/blog/index.php?pk=36540&T=0

As an alternative you can also use a QR Code:  

The GUIDs for individual cells are displayed in the table below:

Summary of computational transaction
Raw Inputview raw input (R code)
Raw Outputview raw output of R engine
Computing time1 seconds
R Server'Gwilym Jenkins' @ 72.249.127.135


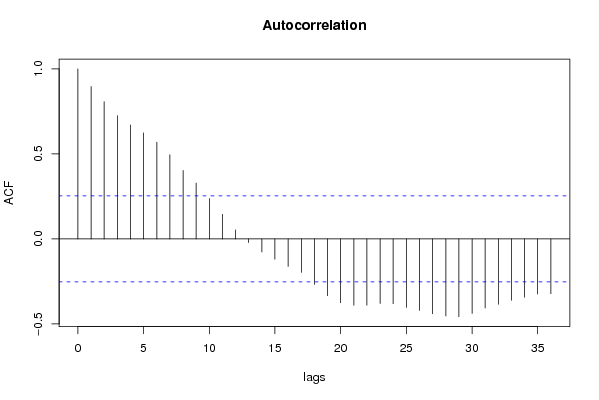
Autocorrelation Function
Time lag kACF(k)T-STATP-value
10.8965066.94430
20.8076426.2560
30.7252195.61750
40.6706695.1951e-06
50.6239454.83315e-06
60.5692864.40972.2e-05
70.4952543.83620.000151
80.4027983.12010.001389
90.3286162.54550.006751
100.2375971.84040.035327
110.1450331.12340.132866
120.0528780.40960.341783
13-0.021176-0.1640.43513
14-0.076246-0.59060.278503
15-0.119062-0.92220.180046
16-0.162027-1.25510.107163
17-0.19685-1.52480.066282
18-0.267533-2.07230.021271
19-0.333731-2.58510.006092
20-0.375908-2.91180.00252
21-0.389634-3.01810.001865
22-0.389673-3.01840.001863
23-0.379924-2.94290.002309
24-0.381188-2.95270.002246
25-0.403147-3.12280.001378
26-0.420784-3.25940.000921
27-0.440319-3.41070.000582
28-0.45303-3.50920.00043
29-0.457271-3.5420.000388
30-0.438489-3.39650.000608
31-0.406785-3.15090.001269
32-0.384251-2.97640.0021
33-0.361417-2.79950.003437
34-0.342622-2.65390.005085
35-0.323682-2.50720.007447
36-0.321973-2.4940.007702

\begin{tabular}{lllllllll}
\hline
Autocorrelation Function \tabularnewline
Time lag k & ACF(k) & T-STAT & P-value \tabularnewline
1 & 0.896506 & 6.9443 & 0 \tabularnewline
2 & 0.807642 & 6.256 & 0 \tabularnewline
3 & 0.725219 & 5.6175 & 0 \tabularnewline
4 & 0.670669 & 5.195 & 1e-06 \tabularnewline
5 & 0.623945 & 4.8331 & 5e-06 \tabularnewline
6 & 0.569286 & 4.4097 & 2.2e-05 \tabularnewline
7 & 0.495254 & 3.8362 & 0.000151 \tabularnewline
8 & 0.402798 & 3.1201 & 0.001389 \tabularnewline
9 & 0.328616 & 2.5455 & 0.006751 \tabularnewline
10 & 0.237597 & 1.8404 & 0.035327 \tabularnewline
11 & 0.145033 & 1.1234 & 0.132866 \tabularnewline
12 & 0.052878 & 0.4096 & 0.341783 \tabularnewline
13 & -0.021176 & -0.164 & 0.43513 \tabularnewline
14 & -0.076246 & -0.5906 & 0.278503 \tabularnewline
15 & -0.119062 & -0.9222 & 0.180046 \tabularnewline
16 & -0.162027 & -1.2551 & 0.107163 \tabularnewline
17 & -0.19685 & -1.5248 & 0.066282 \tabularnewline
18 & -0.267533 & -2.0723 & 0.021271 \tabularnewline
19 & -0.333731 & -2.5851 & 0.006092 \tabularnewline
20 & -0.375908 & -2.9118 & 0.00252 \tabularnewline
21 & -0.389634 & -3.0181 & 0.001865 \tabularnewline
22 & -0.389673 & -3.0184 & 0.001863 \tabularnewline
23 & -0.379924 & -2.9429 & 0.002309 \tabularnewline
24 & -0.381188 & -2.9527 & 0.002246 \tabularnewline
25 & -0.403147 & -3.1228 & 0.001378 \tabularnewline
26 & -0.420784 & -3.2594 & 0.000921 \tabularnewline
27 & -0.440319 & -3.4107 & 0.000582 \tabularnewline
28 & -0.45303 & -3.5092 & 0.00043 \tabularnewline
29 & -0.457271 & -3.542 & 0.000388 \tabularnewline
30 & -0.438489 & -3.3965 & 0.000608 \tabularnewline
31 & -0.406785 & -3.1509 & 0.001269 \tabularnewline
32 & -0.384251 & -2.9764 & 0.0021 \tabularnewline
33 & -0.361417 & -2.7995 & 0.003437 \tabularnewline
34 & -0.342622 & -2.6539 & 0.005085 \tabularnewline
35 & -0.323682 & -2.5072 & 0.007447 \tabularnewline
36 & -0.321973 & -2.494 & 0.007702 \tabularnewline
\hline
\end{tabular}
%Source: https://freestatistics.org/blog/index.php?pk=36540&T=1

[TABLE]
[ROW][C]Autocorrelation Function[/C][/ROW]
[ROW][C]Time lag k[/C][C]ACF(k)[/C][C]T-STAT[/C][C]P-value[/C][/ROW]
[ROW][C]1[/C][C]0.896506[/C][C]6.9443[/C][C]0[/C][/ROW]
[ROW][C]2[/C][C]0.807642[/C][C]6.256[/C][C]0[/C][/ROW]
[ROW][C]3[/C][C]0.725219[/C][C]5.6175[/C][C]0[/C][/ROW]
[ROW][C]4[/C][C]0.670669[/C][C]5.195[/C][C]1e-06[/C][/ROW]
[ROW][C]5[/C][C]0.623945[/C][C]4.8331[/C][C]5e-06[/C][/ROW]
[ROW][C]6[/C][C]0.569286[/C][C]4.4097[/C][C]2.2e-05[/C][/ROW]
[ROW][C]7[/C][C]0.495254[/C][C]3.8362[/C][C]0.000151[/C][/ROW]
[ROW][C]8[/C][C]0.402798[/C][C]3.1201[/C][C]0.001389[/C][/ROW]
[ROW][C]9[/C][C]0.328616[/C][C]2.5455[/C][C]0.006751[/C][/ROW]
[ROW][C]10[/C][C]0.237597[/C][C]1.8404[/C][C]0.035327[/C][/ROW]
[ROW][C]11[/C][C]0.145033[/C][C]1.1234[/C][C]0.132866[/C][/ROW]
[ROW][C]12[/C][C]0.052878[/C][C]0.4096[/C][C]0.341783[/C][/ROW]
[ROW][C]13[/C][C]-0.021176[/C][C]-0.164[/C][C]0.43513[/C][/ROW]
[ROW][C]14[/C][C]-0.076246[/C][C]-0.5906[/C][C]0.278503[/C][/ROW]
[ROW][C]15[/C][C]-0.119062[/C][C]-0.9222[/C][C]0.180046[/C][/ROW]
[ROW][C]16[/C][C]-0.162027[/C][C]-1.2551[/C][C]0.107163[/C][/ROW]
[ROW][C]17[/C][C]-0.19685[/C][C]-1.5248[/C][C]0.066282[/C][/ROW]
[ROW][C]18[/C][C]-0.267533[/C][C]-2.0723[/C][C]0.021271[/C][/ROW]
[ROW][C]19[/C][C]-0.333731[/C][C]-2.5851[/C][C]0.006092[/C][/ROW]
[ROW][C]20[/C][C]-0.375908[/C][C]-2.9118[/C][C]0.00252[/C][/ROW]
[ROW][C]21[/C][C]-0.389634[/C][C]-3.0181[/C][C]0.001865[/C][/ROW]
[ROW][C]22[/C][C]-0.389673[/C][C]-3.0184[/C][C]0.001863[/C][/ROW]
[ROW][C]23[/C][C]-0.379924[/C][C]-2.9429[/C][C]0.002309[/C][/ROW]
[ROW][C]24[/C][C]-0.381188[/C][C]-2.9527[/C][C]0.002246[/C][/ROW]
[ROW][C]25[/C][C]-0.403147[/C][C]-3.1228[/C][C]0.001378[/C][/ROW]
[ROW][C]26[/C][C]-0.420784[/C][C]-3.2594[/C][C]0.000921[/C][/ROW]
[ROW][C]27[/C][C]-0.440319[/C][C]-3.4107[/C][C]0.000582[/C][/ROW]
[ROW][C]28[/C][C]-0.45303[/C][C]-3.5092[/C][C]0.00043[/C][/ROW]
[ROW][C]29[/C][C]-0.457271[/C][C]-3.542[/C][C]0.000388[/C][/ROW]
[ROW][C]30[/C][C]-0.438489[/C][C]-3.3965[/C][C]0.000608[/C][/ROW]
[ROW][C]31[/C][C]-0.406785[/C][C]-3.1509[/C][C]0.001269[/C][/ROW]
[ROW][C]32[/C][C]-0.384251[/C][C]-2.9764[/C][C]0.0021[/C][/ROW]
[ROW][C]33[/C][C]-0.361417[/C][C]-2.7995[/C][C]0.003437[/C][/ROW]
[ROW][C]34[/C][C]-0.342622[/C][C]-2.6539[/C][C]0.005085[/C][/ROW]
[ROW][C]35[/C][C]-0.323682[/C][C]-2.5072[/C][C]0.007447[/C][/ROW]
[ROW][C]36[/C][C]-0.321973[/C][C]-2.494[/C][C]0.007702[/C][/ROW]
[/TABLE]
Source: https://freestatistics.org/blog/index.php?pk=36540&T=1

Globally Unique Identifier (entire table): ba.freestatistics.org/blog/index.php?pk=36540&T=1

As an alternative you can also use a QR Code:  

The GUIDs for individual cells are displayed in the table below:

Autocorrelation Function
Time lag kACF(k)T-STATP-value
10.8965066.94430
20.8076426.2560
30.7252195.61750
40.6706695.1951e-06
50.6239454.83315e-06
60.5692864.40972.2e-05
70.4952543.83620.000151
80.4027983.12010.001389
90.3286162.54550.006751
100.2375971.84040.035327
110.1450331.12340.132866
120.0528780.40960.341783
13-0.021176-0.1640.43513
14-0.076246-0.59060.278503
15-0.119062-0.92220.180046
16-0.162027-1.25510.107163
17-0.19685-1.52480.066282
18-0.267533-2.07230.021271
19-0.333731-2.58510.006092
20-0.375908-2.91180.00252
21-0.389634-3.01810.001865
22-0.389673-3.01840.001863
23-0.379924-2.94290.002309
24-0.381188-2.95270.002246
25-0.403147-3.12280.001378
26-0.420784-3.25940.000921
27-0.440319-3.41070.000582
28-0.45303-3.50920.00043
29-0.457271-3.5420.000388
30-0.438489-3.39650.000608
31-0.406785-3.15090.001269
32-0.384251-2.97640.0021
33-0.361417-2.79950.003437
34-0.342622-2.65390.005085
35-0.323682-2.50720.007447
36-0.321973-2.4940.007702


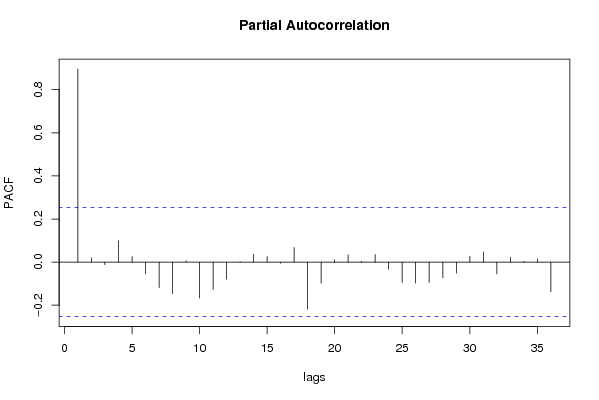
Partial Autocorrelation Function
Time lag kPACF(k)T-STATP-value
10.8965066.94430
20.0199650.15470.438808
3-0.011625-0.090.464274
40.0987190.76470.223733
50.0257190.19920.421384
6-0.05555-0.43030.334264
7-0.118-0.9140.18218
8-0.14617-1.13220.131022
90.0063950.04950.480328
10-0.166818-1.29220.100627
11-0.126965-0.98350.164663
12-0.07916-0.61320.271041
130.0014980.01160.49539
140.0360360.27910.390551
150.0257070.19910.421419
16-0.004965-0.03850.484726
170.067740.52470.300859
18-0.218553-1.69290.047831
19-0.097533-0.75550.226456
200.0107330.08310.467011
210.0341740.26470.39607
220.004570.03540.485939
230.0353320.27370.392636
24-0.032899-0.25480.399862
25-0.094079-0.72870.234501
26-0.097417-0.75460.226723
27-0.095023-0.7360.232285
28-0.071925-0.55710.289756
29-0.050788-0.39340.347708
300.0271690.21040.417016
310.0468290.36270.359039
32-0.054027-0.41850.338542
330.0223540.17320.431556
340.0039440.03060.487864
350.0143760.11140.455854
36-0.137904-1.06820.144855

\begin{tabular}{lllllllll}
\hline
Partial Autocorrelation Function \tabularnewline
Time lag k & PACF(k) & T-STAT & P-value \tabularnewline
1 & 0.896506 & 6.9443 & 0 \tabularnewline
2 & 0.019965 & 0.1547 & 0.438808 \tabularnewline
3 & -0.011625 & -0.09 & 0.464274 \tabularnewline
4 & 0.098719 & 0.7647 & 0.223733 \tabularnewline
5 & 0.025719 & 0.1992 & 0.421384 \tabularnewline
6 & -0.05555 & -0.4303 & 0.334264 \tabularnewline
7 & -0.118 & -0.914 & 0.18218 \tabularnewline
8 & -0.14617 & -1.1322 & 0.131022 \tabularnewline
9 & 0.006395 & 0.0495 & 0.480328 \tabularnewline
10 & -0.166818 & -1.2922 & 0.100627 \tabularnewline
11 & -0.126965 & -0.9835 & 0.164663 \tabularnewline
12 & -0.07916 & -0.6132 & 0.271041 \tabularnewline
13 & 0.001498 & 0.0116 & 0.49539 \tabularnewline
14 & 0.036036 & 0.2791 & 0.390551 \tabularnewline
15 & 0.025707 & 0.1991 & 0.421419 \tabularnewline
16 & -0.004965 & -0.0385 & 0.484726 \tabularnewline
17 & 0.06774 & 0.5247 & 0.300859 \tabularnewline
18 & -0.218553 & -1.6929 & 0.047831 \tabularnewline
19 & -0.097533 & -0.7555 & 0.226456 \tabularnewline
20 & 0.010733 & 0.0831 & 0.467011 \tabularnewline
21 & 0.034174 & 0.2647 & 0.39607 \tabularnewline
22 & 0.00457 & 0.0354 & 0.485939 \tabularnewline
23 & 0.035332 & 0.2737 & 0.392636 \tabularnewline
24 & -0.032899 & -0.2548 & 0.399862 \tabularnewline
25 & -0.094079 & -0.7287 & 0.234501 \tabularnewline
26 & -0.097417 & -0.7546 & 0.226723 \tabularnewline
27 & -0.095023 & -0.736 & 0.232285 \tabularnewline
28 & -0.071925 & -0.5571 & 0.289756 \tabularnewline
29 & -0.050788 & -0.3934 & 0.347708 \tabularnewline
30 & 0.027169 & 0.2104 & 0.417016 \tabularnewline
31 & 0.046829 & 0.3627 & 0.359039 \tabularnewline
32 & -0.054027 & -0.4185 & 0.338542 \tabularnewline
33 & 0.022354 & 0.1732 & 0.431556 \tabularnewline
34 & 0.003944 & 0.0306 & 0.487864 \tabularnewline
35 & 0.014376 & 0.1114 & 0.455854 \tabularnewline
36 & -0.137904 & -1.0682 & 0.144855 \tabularnewline
\hline
\end{tabular}
%Source: https://freestatistics.org/blog/index.php?pk=36540&T=2

[TABLE]
[ROW][C]Partial Autocorrelation Function[/C][/ROW]
[ROW][C]Time lag k[/C][C]PACF(k)[/C][C]T-STAT[/C][C]P-value[/C][/ROW]
[ROW][C]1[/C][C]0.896506[/C][C]6.9443[/C][C]0[/C][/ROW]
[ROW][C]2[/C][C]0.019965[/C][C]0.1547[/C][C]0.438808[/C][/ROW]
[ROW][C]3[/C][C]-0.011625[/C][C]-0.09[/C][C]0.464274[/C][/ROW]
[ROW][C]4[/C][C]0.098719[/C][C]0.7647[/C][C]0.223733[/C][/ROW]
[ROW][C]5[/C][C]0.025719[/C][C]0.1992[/C][C]0.421384[/C][/ROW]
[ROW][C]6[/C][C]-0.05555[/C][C]-0.4303[/C][C]0.334264[/C][/ROW]
[ROW][C]7[/C][C]-0.118[/C][C]-0.914[/C][C]0.18218[/C][/ROW]
[ROW][C]8[/C][C]-0.14617[/C][C]-1.1322[/C][C]0.131022[/C][/ROW]
[ROW][C]9[/C][C]0.006395[/C][C]0.0495[/C][C]0.480328[/C][/ROW]
[ROW][C]10[/C][C]-0.166818[/C][C]-1.2922[/C][C]0.100627[/C][/ROW]
[ROW][C]11[/C][C]-0.126965[/C][C]-0.9835[/C][C]0.164663[/C][/ROW]
[ROW][C]12[/C][C]-0.07916[/C][C]-0.6132[/C][C]0.271041[/C][/ROW]
[ROW][C]13[/C][C]0.001498[/C][C]0.0116[/C][C]0.49539[/C][/ROW]
[ROW][C]14[/C][C]0.036036[/C][C]0.2791[/C][C]0.390551[/C][/ROW]
[ROW][C]15[/C][C]0.025707[/C][C]0.1991[/C][C]0.421419[/C][/ROW]
[ROW][C]16[/C][C]-0.004965[/C][C]-0.0385[/C][C]0.484726[/C][/ROW]
[ROW][C]17[/C][C]0.06774[/C][C]0.5247[/C][C]0.300859[/C][/ROW]
[ROW][C]18[/C][C]-0.218553[/C][C]-1.6929[/C][C]0.047831[/C][/ROW]
[ROW][C]19[/C][C]-0.097533[/C][C]-0.7555[/C][C]0.226456[/C][/ROW]
[ROW][C]20[/C][C]0.010733[/C][C]0.0831[/C][C]0.467011[/C][/ROW]
[ROW][C]21[/C][C]0.034174[/C][C]0.2647[/C][C]0.39607[/C][/ROW]
[ROW][C]22[/C][C]0.00457[/C][C]0.0354[/C][C]0.485939[/C][/ROW]
[ROW][C]23[/C][C]0.035332[/C][C]0.2737[/C][C]0.392636[/C][/ROW]
[ROW][C]24[/C][C]-0.032899[/C][C]-0.2548[/C][C]0.399862[/C][/ROW]
[ROW][C]25[/C][C]-0.094079[/C][C]-0.7287[/C][C]0.234501[/C][/ROW]
[ROW][C]26[/C][C]-0.097417[/C][C]-0.7546[/C][C]0.226723[/C][/ROW]
[ROW][C]27[/C][C]-0.095023[/C][C]-0.736[/C][C]0.232285[/C][/ROW]
[ROW][C]28[/C][C]-0.071925[/C][C]-0.5571[/C][C]0.289756[/C][/ROW]
[ROW][C]29[/C][C]-0.050788[/C][C]-0.3934[/C][C]0.347708[/C][/ROW]
[ROW][C]30[/C][C]0.027169[/C][C]0.2104[/C][C]0.417016[/C][/ROW]
[ROW][C]31[/C][C]0.046829[/C][C]0.3627[/C][C]0.359039[/C][/ROW]
[ROW][C]32[/C][C]-0.054027[/C][C]-0.4185[/C][C]0.338542[/C][/ROW]
[ROW][C]33[/C][C]0.022354[/C][C]0.1732[/C][C]0.431556[/C][/ROW]
[ROW][C]34[/C][C]0.003944[/C][C]0.0306[/C][C]0.487864[/C][/ROW]
[ROW][C]35[/C][C]0.014376[/C][C]0.1114[/C][C]0.455854[/C][/ROW]
[ROW][C]36[/C][C]-0.137904[/C][C]-1.0682[/C][C]0.144855[/C][/ROW]
[/TABLE]
Source: https://freestatistics.org/blog/index.php?pk=36540&T=2

Globally Unique Identifier (entire table): ba.freestatistics.org/blog/index.php?pk=36540&T=2

As an alternative you can also use a QR Code:  

The GUIDs for individual cells are displayed in the table below:

Partial Autocorrelation Function
Time lag kPACF(k)T-STATP-value
10.8965066.94430
20.0199650.15470.438808
3-0.011625-0.090.464274
40.0987190.76470.223733
50.0257190.19920.421384
6-0.05555-0.43030.334264
7-0.118-0.9140.18218
8-0.14617-1.13220.131022
90.0063950.04950.480328
10-0.166818-1.29220.100627
11-0.126965-0.98350.164663
12-0.07916-0.61320.271041
130.0014980.01160.49539
140.0360360.27910.390551
150.0257070.19910.421419
16-0.004965-0.03850.484726
170.067740.52470.300859
18-0.218553-1.69290.047831
19-0.097533-0.75550.226456
200.0107330.08310.467011
210.0341740.26470.39607
220.004570.03540.485939
230.0353320.27370.392636
24-0.032899-0.25480.399862
25-0.094079-0.72870.234501
26-0.097417-0.75460.226723
27-0.095023-0.7360.232285
28-0.071925-0.55710.289756
29-0.050788-0.39340.347708
300.0271690.21040.417016
310.0468290.36270.359039
32-0.054027-0.41850.338542
330.0223540.17320.431556
340.0039440.03060.487864
350.0143760.11140.455854
36-0.137904-1.06820.144855


Parameters (Session):
par1 = 36 ; par2 = 1 ; par3 = 0 ; par4 = 0 ; par5 = 12 ;
Parameters (R input):
par1 = 36 ; par2 = 1 ; par3 = 0 ; par4 = 0 ; par5 = 12 ;
R code (references can be found in the software module):
if (par1 == 'Default') {
par1 = 10*log10(length(x))
} else {
par1 <- as.numeric(par1)
}
par2 <- as.numeric(par2)
par3 <- as.numeric(par3)
par4 <- as.numeric(par4)
par5 <- as.numeric(par5)
if (par2 == 0) {
x <- log(x)
} else {
x <- (x ^ par2 - 1) / par2
}
if (par3 > 0) x <- diff(x,lag=1,difference=par3)
if (par4 > 0) x <- diff(x,lag=par5,difference=par4)
bitmap(file='pic1.png')
racf <- acf(x,par1,main='Autocorrelation',xlab='lags',ylab='ACF')
dev.off()
bitmap(file='pic2.png')
rpacf <- pacf(x,par1,main='Partial Autocorrelation',xlab='lags',ylab='PACF')
dev.off()
(myacf <- c(racf$acf))
(mypacf <- c(rpacf$acf))
lengthx <- length(x)
sqrtn <- sqrt(lengthx)
load(file='createtable')
a<-table.start()
a<-table.row.start(a)
a<-table.element(a,'Autocorrelation Function',4,TRUE)
a<-table.row.end(a)
a<-table.row.start(a)
a<-table.element(a,'Time lag k',header=TRUE)
a<-table.element(a,hyperlink('basics.htm','ACF(k)','click here for more information about the Autocorrelation Function'),header=TRUE)
a<-table.element(a,'T-STAT',header=TRUE)
a<-table.element(a,'P-value',header=TRUE)
a<-table.row.end(a)
for (i in 2:(par1+1)) {
a<-table.row.start(a)
a<-table.element(a,i-1,header=TRUE)
a<-table.element(a,round(myacf[i],6))
mytstat <- myacf[i]*sqrtn
a<-table.element(a,round(mytstat,4))
a<-table.element(a,round(1-pt(abs(mytstat),lengthx),6))
a<-table.row.end(a)
}
a<-table.end(a)
table.save(a,file='mytable.tab')
a<-table.start()
a<-table.row.start(a)
a<-table.element(a,'Partial Autocorrelation Function',4,TRUE)
a<-table.row.end(a)
a<-table.row.start(a)
a<-table.element(a,'Time lag k',header=TRUE)
a<-table.element(a,hyperlink('basics.htm','PACF(k)','click here for more information about the Partial Autocorrelation Function'),header=TRUE)
a<-table.element(a,'T-STAT',header=TRUE)
a<-table.element(a,'P-value',header=TRUE)
a<-table.row.end(a)
for (i in 1:par1) {
a<-table.row.start(a)
a<-table.element(a,i,header=TRUE)
a<-table.element(a,round(mypacf[i],6))
mytstat <- mypacf[i]*sqrtn
a<-table.element(a,round(mytstat,4))
a<-table.element(a,round(1-pt(abs(mytstat),lengthx),6))
a<-table.row.end(a)
}
a<-table.end(a)
table.save(a,file='mytable1.tab')