Free Statistics

of Irreproducible Research!

Author's title

Author*Unverified author*
R Software Modulerwasp_cross.wasp
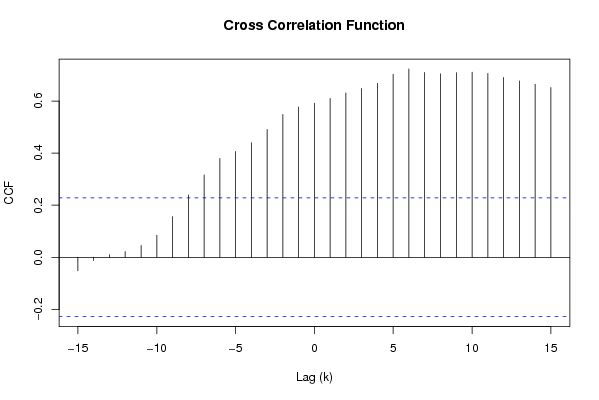
Title produced by softwareCross Correlation Function
Date of computationWed, 17 Dec 2008 14:45:12 -0700
Cite this page as followsStatistical Computations at FreeStatistics.org, Office for Research Development and Education, URL https://freestatistics.org/blog/index.php?v=date/2008/Dec/17/t1229550338g11c54e1aq5seaj.htm/, Retrieved Sat, 18 May 2024 17:37:05 +0000
Statistical Computations at FreeStatistics.org, Office for Research Development and Education, URL https://freestatistics.org/blog/index.php?pk=34578, Retrieved Sat, 18 May 2024 17:37:05 +0000
QR Codes:

Original text written by user:
IsPrivate?No (this computation is public)
User-defined keywords
Estimated Impact180
Family? (F = Feedback message, R = changed R code, M = changed R Module, P = changed Parameters, D = changed Data)
-     [Kendall tau Correlation Matrix] [Kendall Tau (diff)] [2007-12-22 13:19:55] [9fd02a4fb76a6860fd38131ad7f5d02f]
- RMPD    [Cross Correlation Function] [] [2008-12-17 21:45:12] [59094f58b9d90d3694e930ebd2901ecd] [Current]
-   P       [Cross Correlation Function] [] [2008-12-17 21:48:00] [f3161d5a04a14312cd010aa8f92941cc]
Feedback Forum

Post a new message
Dataseries X:
104.3
103.9
103.9
103.9
108.0
108.0
108.0
108.0
108.0
108.0
108.0
108.0
108.0
108.0
108.0
108.0
108.0
108.0
108.0
108.0
108.0
108.0
108.0
108.0
108.0
108.0
108.0
108.2
112.3
111.3
111.3
115.3
117.2
118.3
118.3
118.3
119.0
120.6
122.6
122.6
127.4
125.9
121.5
118.8
121.6
122.3
122.7
120.8
120.1
120.1
120.1
120.1
128.4
129.8
129.8
128.6
128.6
133.7
130.0
125.9
129.4
129.4
130.6
130.6
130.6
130.8
129.7
125.8
126.0
125.6
125.4
124.7
126.9
129.1
Dataseries Y:
513
503
471
471
476
475
470
461
455
456
517
525
523
519
509
512
519
517
510
509
501
507
569
580
578
565
547
555
562
561
555
544
537
543
594
611
613
611
594
595
591
589
584
573
567
569
621
629
628
612
595
597
593
590
580
574
573
573
620
626
620
588
566
557
561
549
532
526
511
499
555
565
542
527


Summary of computational transaction
Raw Inputview raw input (R code)
Raw Outputview raw output of R engine
Computing time3 seconds
R Server'Sir Ronald Aylmer Fisher' @ 193.190.124.24

\begin{tabular}{lllllllll}
\hline
Summary of computational transaction \tabularnewline
Raw Input & view raw input (R code)  \tabularnewline
Raw Output & view raw output of R engine  \tabularnewline
Computing time & 3 seconds \tabularnewline
R Server & 'Sir Ronald Aylmer Fisher' @ 193.190.124.24 \tabularnewline
\hline
\end{tabular}
%Source: https://freestatistics.org/blog/index.php?pk=34578&T=0

[TABLE]
[ROW][C]Summary of computational transaction[/C][/ROW]
[ROW][C]Raw Input[/C][C]view raw input (R code) [/C][/ROW]
[ROW][C]Raw Output[/C][C]view raw output of R engine [/C][/ROW]
[ROW][C]Computing time[/C][C]3 seconds[/C][/ROW]
[ROW][C]R Server[/C][C]'Sir Ronald Aylmer Fisher' @ 193.190.124.24[/C][/ROW]
[/TABLE]
Source: https://freestatistics.org/blog/index.php?pk=34578&T=0

Globally Unique Identifier (entire table): ba.freestatistics.org/blog/index.php?pk=34578&T=0

As an alternative you can also use a QR Code:  

The GUIDs for individual cells are displayed in the table below:

Summary of computational transaction
Raw Inputview raw input (R code)
Raw Outputview raw output of R engine
Computing time3 seconds
R Server'Sir Ronald Aylmer Fisher' @ 193.190.124.24


Cross Correlation Function
ParameterValue
Box-Cox transformation parameter (lambda) of X series1
Degree of non-seasonal differencing (d) of X series0
Degree of seasonal differencing (D) of X series0
Seasonal Period (s)1
Box-Cox transformation parameter (lambda) of Y series1
Degree of non-seasonal differencing (d) of Y series0
Degree of seasonal differencing (D) of Y series0
krho(Y[t],X[t+k])
-15-0.0518749698691717
-14-0.0126262473242855
-130.00998724266386255
-120.0219111508695077
-110.0452220791761193
-100.085073491236055
-90.156347309334877
-80.239359654704665
-70.316153908373067
-60.379618769689182
-50.406651343868560
-40.439994885358002
-30.491118747701443
-20.548138250875983
-10.57680202916747
00.591513294700217
10.609678600634753
20.631394046217209
30.648124136484032
40.668064969650545
50.703265587686902
60.72327642606127
70.710098305074434
80.704402246607859
90.709075017997562
100.71082072658313
110.705587260090557
120.690652256693749
130.677341966571483
140.664354040194165
150.65160143935066

\begin{tabular}{lllllllll}
\hline
Cross Correlation Function \tabularnewline
Parameter & Value \tabularnewline
Box-Cox transformation parameter (lambda) of X series & 1 \tabularnewline
Degree of non-seasonal differencing (d) of X series & 0 \tabularnewline
Degree of seasonal differencing (D) of X series & 0 \tabularnewline
Seasonal Period (s) & 1 \tabularnewline
Box-Cox transformation parameter (lambda) of Y series & 1 \tabularnewline
Degree of non-seasonal differencing (d) of Y series & 0 \tabularnewline
Degree of seasonal differencing (D) of Y series & 0 \tabularnewline
k & rho(Y[t],X[t+k]) \tabularnewline
-15 & -0.0518749698691717 \tabularnewline
-14 & -0.0126262473242855 \tabularnewline
-13 & 0.00998724266386255 \tabularnewline
-12 & 0.0219111508695077 \tabularnewline
-11 & 0.0452220791761193 \tabularnewline
-10 & 0.085073491236055 \tabularnewline
-9 & 0.156347309334877 \tabularnewline
-8 & 0.239359654704665 \tabularnewline
-7 & 0.316153908373067 \tabularnewline
-6 & 0.379618769689182 \tabularnewline
-5 & 0.406651343868560 \tabularnewline
-4 & 0.439994885358002 \tabularnewline
-3 & 0.491118747701443 \tabularnewline
-2 & 0.548138250875983 \tabularnewline
-1 & 0.57680202916747 \tabularnewline
0 & 0.591513294700217 \tabularnewline
1 & 0.609678600634753 \tabularnewline
2 & 0.631394046217209 \tabularnewline
3 & 0.648124136484032 \tabularnewline
4 & 0.668064969650545 \tabularnewline
5 & 0.703265587686902 \tabularnewline
6 & 0.72327642606127 \tabularnewline
7 & 0.710098305074434 \tabularnewline
8 & 0.704402246607859 \tabularnewline
9 & 0.709075017997562 \tabularnewline
10 & 0.71082072658313 \tabularnewline
11 & 0.705587260090557 \tabularnewline
12 & 0.690652256693749 \tabularnewline
13 & 0.677341966571483 \tabularnewline
14 & 0.664354040194165 \tabularnewline
15 & 0.65160143935066 \tabularnewline
\hline
\end{tabular}
%Source: https://freestatistics.org/blog/index.php?pk=34578&T=1

[TABLE]
[ROW][C]Cross Correlation Function[/C][/ROW]
[ROW][C]Parameter[/C][C]Value[/C][/ROW]
[ROW][C]Box-Cox transformation parameter (lambda) of X series[/C][C]1[/C][/ROW]
[ROW][C]Degree of non-seasonal differencing (d) of X series[/C][C]0[/C][/ROW]
[ROW][C]Degree of seasonal differencing (D) of X series[/C][C]0[/C][/ROW]
[ROW][C]Seasonal Period (s)[/C][C]1[/C][/ROW]
[ROW][C]Box-Cox transformation parameter (lambda) of Y series[/C][C]1[/C][/ROW]
[ROW][C]Degree of non-seasonal differencing (d) of Y series[/C][C]0[/C][/ROW]
[ROW][C]Degree of seasonal differencing (D) of Y series[/C][C]0[/C][/ROW]
[ROW][C]k[/C][C]rho(Y[t],X[t+k])[/C][/ROW]
[ROW][C]-15[/C][C]-0.0518749698691717[/C][/ROW]
[ROW][C]-14[/C][C]-0.0126262473242855[/C][/ROW]
[ROW][C]-13[/C][C]0.00998724266386255[/C][/ROW]
[ROW][C]-12[/C][C]0.0219111508695077[/C][/ROW]
[ROW][C]-11[/C][C]0.0452220791761193[/C][/ROW]
[ROW][C]-10[/C][C]0.085073491236055[/C][/ROW]
[ROW][C]-9[/C][C]0.156347309334877[/C][/ROW]
[ROW][C]-8[/C][C]0.239359654704665[/C][/ROW]
[ROW][C]-7[/C][C]0.316153908373067[/C][/ROW]
[ROW][C]-6[/C][C]0.379618769689182[/C][/ROW]
[ROW][C]-5[/C][C]0.406651343868560[/C][/ROW]
[ROW][C]-4[/C][C]0.439994885358002[/C][/ROW]
[ROW][C]-3[/C][C]0.491118747701443[/C][/ROW]
[ROW][C]-2[/C][C]0.548138250875983[/C][/ROW]
[ROW][C]-1[/C][C]0.57680202916747[/C][/ROW]
[ROW][C]0[/C][C]0.591513294700217[/C][/ROW]
[ROW][C]1[/C][C]0.609678600634753[/C][/ROW]
[ROW][C]2[/C][C]0.631394046217209[/C][/ROW]
[ROW][C]3[/C][C]0.648124136484032[/C][/ROW]
[ROW][C]4[/C][C]0.668064969650545[/C][/ROW]
[ROW][C]5[/C][C]0.703265587686902[/C][/ROW]
[ROW][C]6[/C][C]0.72327642606127[/C][/ROW]
[ROW][C]7[/C][C]0.710098305074434[/C][/ROW]
[ROW][C]8[/C][C]0.704402246607859[/C][/ROW]
[ROW][C]9[/C][C]0.709075017997562[/C][/ROW]
[ROW][C]10[/C][C]0.71082072658313[/C][/ROW]
[ROW][C]11[/C][C]0.705587260090557[/C][/ROW]
[ROW][C]12[/C][C]0.690652256693749[/C][/ROW]
[ROW][C]13[/C][C]0.677341966571483[/C][/ROW]
[ROW][C]14[/C][C]0.664354040194165[/C][/ROW]
[ROW][C]15[/C][C]0.65160143935066[/C][/ROW]
[/TABLE]
Source: https://freestatistics.org/blog/index.php?pk=34578&T=1

Globally Unique Identifier (entire table): ba.freestatistics.org/blog/index.php?pk=34578&T=1

As an alternative you can also use a QR Code:  

The GUIDs for individual cells are displayed in the table below:

Cross Correlation Function
ParameterValue
Box-Cox transformation parameter (lambda) of X series1
Degree of non-seasonal differencing (d) of X series0
Degree of seasonal differencing (D) of X series0
Seasonal Period (s)1
Box-Cox transformation parameter (lambda) of Y series1
Degree of non-seasonal differencing (d) of Y series0
Degree of seasonal differencing (D) of Y series0
krho(Y[t],X[t+k])
-15-0.0518749698691717
-14-0.0126262473242855
-130.00998724266386255
-120.0219111508695077
-110.0452220791761193
-100.085073491236055
-90.156347309334877
-80.239359654704665
-70.316153908373067
-60.379618769689182
-50.406651343868560
-40.439994885358002
-30.491118747701443
-20.548138250875983
-10.57680202916747
00.591513294700217
10.609678600634753
20.631394046217209
30.648124136484032
40.668064969650545
50.703265587686902
60.72327642606127
70.710098305074434
80.704402246607859
90.709075017997562
100.71082072658313
110.705587260090557
120.690652256693749
130.677341966571483
140.664354040194165
150.65160143935066


Parameters (Session):
par1 = 1 ; par2 = 0 ; par3 = 0 ; par4 = 1 ; par5 = 1 ; par6 = 0 ; par7 = 0 ;
Parameters (R input):
par1 = 1 ; par2 = 0 ; par3 = 0 ; par4 = 1 ; par5 = 1 ; par6 = 0 ; par7 = 0 ;
R code (references can be found in the software module):
par1 <- as.numeric(par1)
par2 <- as.numeric(par2)
par3 <- as.numeric(par3)
par4 <- as.numeric(par4)
par5 <- as.numeric(par5)
par6 <- as.numeric(par6)
par7 <- as.numeric(par7)
if (par1 == 0) {
x <- log(x)
} else {
x <- (x ^ par1 - 1) / par1
}
if (par5 == 0) {
y <- log(y)
} else {
y <- (y ^ par5 - 1) / par5
}
if (par2 > 0) x <- diff(x,lag=1,difference=par2)
if (par6 > 0) y <- diff(y,lag=1,difference=par6)
if (par3 > 0) x <- diff(x,lag=par4,difference=par3)
if (par7 > 0) y <- diff(y,lag=par4,difference=par7)
x
y
bitmap(file='test1.png')
(r <- ccf(x,y,main='Cross Correlation Function',ylab='CCF',xlab='Lag (k)'))
dev.off()
load(file='createtable')
a<-table.start()
a<-table.row.start(a)
a<-table.element(a,'Cross Correlation Function',2,TRUE)
a<-table.row.end(a)
a<-table.row.start(a)
a<-table.element(a,'Parameter',header=TRUE)
a<-table.element(a,'Value',header=TRUE)
a<-table.row.end(a)
a<-table.row.start(a)
a<-table.element(a,'Box-Cox transformation parameter (lambda) of X series',header=TRUE)
a<-table.element(a,par1)
a<-table.row.end(a)
a<-table.row.start(a)
a<-table.element(a,'Degree of non-seasonal differencing (d) of X series',header=TRUE)
a<-table.element(a,par2)
a<-table.row.end(a)
a<-table.row.start(a)
a<-table.element(a,'Degree of seasonal differencing (D) of X series',header=TRUE)
a<-table.element(a,par3)
a<-table.row.end(a)
a<-table.row.start(a)
a<-table.element(a,'Seasonal Period (s)',header=TRUE)
a<-table.element(a,par4)
a<-table.row.end(a)
a<-table.row.start(a)
a<-table.element(a,'Box-Cox transformation parameter (lambda) of Y series',header=TRUE)
a<-table.element(a,par5)
a<-table.row.end(a)
a<-table.row.start(a)
a<-table.element(a,'Degree of non-seasonal differencing (d) of Y series',header=TRUE)
a<-table.element(a,par6)
a<-table.row.end(a)
a<-table.row.start(a)
a<-table.element(a,'Degree of seasonal differencing (D) of Y series',header=TRUE)
a<-table.element(a,par7)
a<-table.row.end(a)
a<-table.row.start(a)
a<-table.element(a,'k',header=TRUE)
a<-table.element(a,'rho(Y[t],X[t+k])',header=TRUE)
a<-table.row.end(a)
mylength <- length(r$acf)
myhalf <- floor((mylength-1)/2)
for (i in 1:mylength) {
a<-table.row.start(a)
a<-table.element(a,i-myhalf-1,header=TRUE)
a<-table.element(a,r$acf[i])
a<-table.row.end(a)
}
a<-table.end(a)
table.save(a,file='mytable.tab')