Free Statistics
of Irreproducible Research!
Description of Statistical Computation | |||||||||||||||||||||||||||||||||||||||
|---|---|---|---|---|---|---|---|---|---|---|---|---|---|---|---|---|---|---|---|---|---|---|---|---|---|---|---|---|---|---|---|---|---|---|---|---|---|---|---|
| Author's title | |||||||||||||||||||||||||||||||||||||||
| Author | *Unverified author* | ||||||||||||||||||||||||||||||||||||||
| R Software Module | rwasp_pairs.wasp | ||||||||||||||||||||||||||||||||||||||
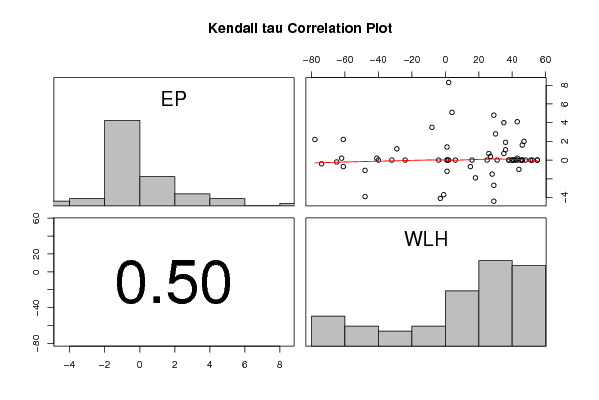
| Title produced by software | Kendall tau Correlation Matrix | ||||||||||||||||||||||||||||||||||||||
| Date of computation | Wed, 17 Dec 2008 14:39:36 -0700 | ||||||||||||||||||||||||||||||||||||||
| Cite this page as follows | Statistical Computations at FreeStatistics.org, Office for Research Development and Education, URL https://freestatistics.org/blog/index.php?v=date/2008/Dec/17/t12295500011ih1vhcpusb81gr.htm/, Retrieved Sat, 18 May 2024 15:27:56 +0000 | ||||||||||||||||||||||||||||||||||||||
| Statistical Computations at FreeStatistics.org, Office for Research Development and Education, URL https://freestatistics.org/blog/index.php?pk=34574, Retrieved Sat, 18 May 2024 15:27:56 +0000 | |||||||||||||||||||||||||||||||||||||||
| QR Codes: | |||||||||||||||||||||||||||||||||||||||
|
| |||||||||||||||||||||||||||||||||||||||
| Original text written by user: | |||||||||||||||||||||||||||||||||||||||
| IsPrivate? | No (this computation is public) | ||||||||||||||||||||||||||||||||||||||
| User-defined keywords | |||||||||||||||||||||||||||||||||||||||
| Estimated Impact | 185 | ||||||||||||||||||||||||||||||||||||||
Tree of Dependent Computations | |||||||||||||||||||||||||||||||||||||||
| Family? (F = Feedback message, R = changed R code, M = changed R Module, P = changed Parameters, D = changed Data) | |||||||||||||||||||||||||||||||||||||||
| - [Kendall tau Correlation Matrix] [Kendall Tau (diff)] [2007-12-22 13:19:55] [9fd02a4fb76a6860fd38131ad7f5d02f] - R D [Kendall tau Correlation Matrix] [Taak] [2008-12-17 21:39:36] [33f3d2151f6019d17feb8eee7259f239] [Current] | |||||||||||||||||||||||||||||||||||||||
| Feedback Forum | |||||||||||||||||||||||||||||||||||||||
Post a new message | |||||||||||||||||||||||||||||||||||||||
Dataset | |||||||||||||||||||||||||||||||||||||||
| Dataseries X: | |||||||||||||||||||||||||||||||||||||||
0,00 16,00 0,00 38,00 0,00 41,00 0,00 43,00 0,00 42,00 0,00 40,00 0,00 48,00 0,00 46,00 0,00 51,00 0,00 52,00 0,00 55,00 0,00 55,00 0,00 46,00 0,00 38,00 0,20 43,00 4,10 43,00 -1,00 44,00 0,00 45,00 4,00 35,00 1,90 36,00 1,10 36,00 0,00 25,00 0,00 31,00 0,70 35,00 1,60 46,00 2,00 47,00 0,00 40,00 4,80 29,00 -1,50 28,00 -4,40 29,00 -2,70 29,00 2,80 30,00 0,70 26,00 0,40 27,00 -1,90 18,00 -0,70 15,00 0,00 1,00 0,00 1,00 0,00 2,00 8,30 2,00 1,40 1,00 0,00 -4,00 -1,20 1,00 0,00 6,00 5,10 4,00 -3,70 -1,00 -4,10 -3,00 3,50 -8,00 0,00 -24,00 1,20 -29,00 0,00 -40,00 0,00 -32,00 0,20 -41,00 -1,10 -48,00 -3,90 -48,00 0,20 -62,00 -0,40 -74,00 -0,20 -65,00 -0,70 -61,00 2,20 -78,00 2,20 -61,00 | |||||||||||||||||||||||||||||||||||||||
Tables (Output of Computation) | |||||||||||||||||||||||||||||||||||||||
| |||||||||||||||||||||||||||||||||||||||
Figures (Output of Computation) | |||||||||||||||||||||||||||||||||||||||
Input Parameters & R Code | |||||||||||||||||||||||||||||||||||||||
| Parameters (Session): | |||||||||||||||||||||||||||||||||||||||
| Parameters (R input): | |||||||||||||||||||||||||||||||||||||||
| R code (references can be found in the software module): | |||||||||||||||||||||||||||||||||||||||
panel.tau <- function(x, y, digits=2, prefix='', cex.cor) | |||||||||||||||||||||||||||||||||||||||