Free Statistics

of Irreproducible Research!

Author's title

Author*The author of this computation has been verified*
R Software Modulerwasp_autocorrelation.wasp
Title produced by software(Partial) Autocorrelation Function
Date of computationWed, 17 Dec 2008 04:28:36 -0700
Cite this page as followsStatistical Computations at FreeStatistics.org, Office for Research Development and Education, URL https://freestatistics.org/blog/index.php?v=date/2008/Dec/17/t122951335887ddntu9v1ze300.htm/, Retrieved Fri, 24 May 2024 08:07:37 +0000
Statistical Computations at FreeStatistics.org, Office for Research Development and Education, URL https://freestatistics.org/blog/index.php?pk=34304, Retrieved Fri, 24 May 2024 08:07:37 +0000
QR Codes:

Original text written by user:
IsPrivate?No (this computation is public)
User-defined keywords
Estimated Impact219
Family? (F = Feedback message, R = changed R code, M = changed R Module, P = changed Parameters, D = changed Data)
-     [(Partial) Autocorrelation Function] [VAC (Partiële) au...] [2008-12-14 13:47:12] [379d6c32f73e3218fd773d79e4063d07]
-    D  [(Partial) Autocorrelation Function] [VAC (Partiële) au...] [2008-12-14 14:18:58] [379d6c32f73e3218fd773d79e4063d07]
-   PD      [(Partial) Autocorrelation Function] [VAC (Partiële) au...] [2008-12-17 11:28:36] [490fee4f334e2e025c95681783e3fd0b] [Current]
-   PD        [(Partial) Autocorrelation Function] [VAC (Partiële) au...] [2008-12-23 15:39:24] [379d6c32f73e3218fd773d79e4063d07]
-  MP           [(Partial) Autocorrelation Function] [(Partial) Autocor...] [2010-01-23 19:24:41] [f1bd7399181c649098ca7b814ee0e027]
Feedback Forum

Post a new message
Dataseries X:
188,5
188,6
191,9
193,5
194,9
194,9
196,2
196,2
198
198,6
201,3
203,5
204,1
204,8
206,5
207,8
208,6
209,7
210
211,7
212,4
213,7
214,8
216,4
217,5
218,6
220,4
221,8
222,5
223,4
225,5
226,5
227,8
228,5
229,1
229,9
230,8
231,9
236
237,5


Summary of computational transaction
Raw Inputview raw input (R code)
Raw Outputview raw output of R engine
Computing time1 seconds
R Server'George Udny Yule' @ 72.249.76.132

\begin{tabular}{lllllllll}
\hline
Summary of computational transaction \tabularnewline
Raw Input & view raw input (R code)  \tabularnewline
Raw Output & view raw output of R engine  \tabularnewline
Computing time & 1 seconds \tabularnewline
R Server & 'George Udny Yule' @ 72.249.76.132 \tabularnewline
\hline
\end{tabular}
%Source: https://freestatistics.org/blog/index.php?pk=34304&T=0

[TABLE]
[ROW][C]Summary of computational transaction[/C][/ROW]
[ROW][C]Raw Input[/C][C]view raw input (R code) [/C][/ROW]
[ROW][C]Raw Output[/C][C]view raw output of R engine [/C][/ROW]
[ROW][C]Computing time[/C][C]1 seconds[/C][/ROW]
[ROW][C]R Server[/C][C]'George Udny Yule' @ 72.249.76.132[/C][/ROW]
[/TABLE]
Source: https://freestatistics.org/blog/index.php?pk=34304&T=0

Globally Unique Identifier (entire table): ba.freestatistics.org/blog/index.php?pk=34304&T=0

As an alternative you can also use a QR Code:  

The GUIDs for individual cells are displayed in the table below:

Summary of computational transaction
Raw Inputview raw input (R code)
Raw Outputview raw output of R engine
Computing time1 seconds
R Server'George Udny Yule' @ 72.249.76.132


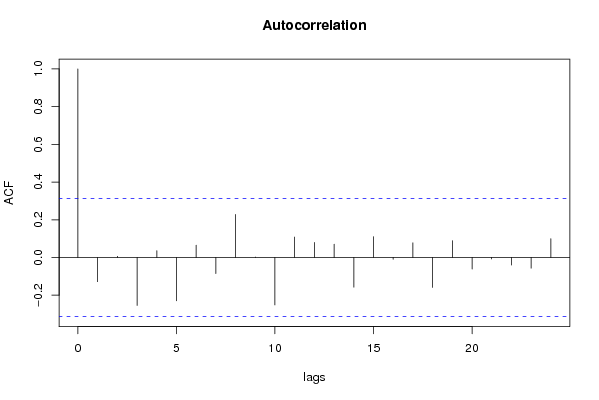
Autocorrelation Function
Time lag kACF(k)T-STATP-value
1-0.128413-0.80190.213724
20.006370.03980.484237
3-0.25456-1.58970.059986
40.035750.22330.41225
5-0.229986-1.43630.079451
60.0650680.40630.343354
7-0.085367-0.53310.298488
80.2285071.4270.080765
90.0021050.01310.494789
10-0.251785-1.57240.061969
110.1082280.67590.251551
120.0795940.49710.310967
130.0706510.44120.330747
14-0.157863-0.98590.165141
150.1103870.68940.247338
16-0.00986-0.06160.475607
170.0775640.48440.31541
18-0.15879-0.99160.163742
190.0888880.55510.290996
20-0.06136-0.38320.35183
21-0.007666-0.04790.481031
22-0.040541-0.25320.400729
23-0.056524-0.3530.362997
240.0995670.62180.268848

\begin{tabular}{lllllllll}
\hline
Autocorrelation Function \tabularnewline
Time lag k & ACF(k) & T-STAT & P-value \tabularnewline
1 & -0.128413 & -0.8019 & 0.213724 \tabularnewline
2 & 0.00637 & 0.0398 & 0.484237 \tabularnewline
3 & -0.25456 & -1.5897 & 0.059986 \tabularnewline
4 & 0.03575 & 0.2233 & 0.41225 \tabularnewline
5 & -0.229986 & -1.4363 & 0.079451 \tabularnewline
6 & 0.065068 & 0.4063 & 0.343354 \tabularnewline
7 & -0.085367 & -0.5331 & 0.298488 \tabularnewline
8 & 0.228507 & 1.427 & 0.080765 \tabularnewline
9 & 0.002105 & 0.0131 & 0.494789 \tabularnewline
10 & -0.251785 & -1.5724 & 0.061969 \tabularnewline
11 & 0.108228 & 0.6759 & 0.251551 \tabularnewline
12 & 0.079594 & 0.4971 & 0.310967 \tabularnewline
13 & 0.070651 & 0.4412 & 0.330747 \tabularnewline
14 & -0.157863 & -0.9859 & 0.165141 \tabularnewline
15 & 0.110387 & 0.6894 & 0.247338 \tabularnewline
16 & -0.00986 & -0.0616 & 0.475607 \tabularnewline
17 & 0.077564 & 0.4844 & 0.31541 \tabularnewline
18 & -0.15879 & -0.9916 & 0.163742 \tabularnewline
19 & 0.088888 & 0.5551 & 0.290996 \tabularnewline
20 & -0.06136 & -0.3832 & 0.35183 \tabularnewline
21 & -0.007666 & -0.0479 & 0.481031 \tabularnewline
22 & -0.040541 & -0.2532 & 0.400729 \tabularnewline
23 & -0.056524 & -0.353 & 0.362997 \tabularnewline
24 & 0.099567 & 0.6218 & 0.268848 \tabularnewline
\hline
\end{tabular}
%Source: https://freestatistics.org/blog/index.php?pk=34304&T=1

[TABLE]
[ROW][C]Autocorrelation Function[/C][/ROW]
[ROW][C]Time lag k[/C][C]ACF(k)[/C][C]T-STAT[/C][C]P-value[/C][/ROW]
[ROW][C]1[/C][C]-0.128413[/C][C]-0.8019[/C][C]0.213724[/C][/ROW]
[ROW][C]2[/C][C]0.00637[/C][C]0.0398[/C][C]0.484237[/C][/ROW]
[ROW][C]3[/C][C]-0.25456[/C][C]-1.5897[/C][C]0.059986[/C][/ROW]
[ROW][C]4[/C][C]0.03575[/C][C]0.2233[/C][C]0.41225[/C][/ROW]
[ROW][C]5[/C][C]-0.229986[/C][C]-1.4363[/C][C]0.079451[/C][/ROW]
[ROW][C]6[/C][C]0.065068[/C][C]0.4063[/C][C]0.343354[/C][/ROW]
[ROW][C]7[/C][C]-0.085367[/C][C]-0.5331[/C][C]0.298488[/C][/ROW]
[ROW][C]8[/C][C]0.228507[/C][C]1.427[/C][C]0.080765[/C][/ROW]
[ROW][C]9[/C][C]0.002105[/C][C]0.0131[/C][C]0.494789[/C][/ROW]
[ROW][C]10[/C][C]-0.251785[/C][C]-1.5724[/C][C]0.061969[/C][/ROW]
[ROW][C]11[/C][C]0.108228[/C][C]0.6759[/C][C]0.251551[/C][/ROW]
[ROW][C]12[/C][C]0.079594[/C][C]0.4971[/C][C]0.310967[/C][/ROW]
[ROW][C]13[/C][C]0.070651[/C][C]0.4412[/C][C]0.330747[/C][/ROW]
[ROW][C]14[/C][C]-0.157863[/C][C]-0.9859[/C][C]0.165141[/C][/ROW]
[ROW][C]15[/C][C]0.110387[/C][C]0.6894[/C][C]0.247338[/C][/ROW]
[ROW][C]16[/C][C]-0.00986[/C][C]-0.0616[/C][C]0.475607[/C][/ROW]
[ROW][C]17[/C][C]0.077564[/C][C]0.4844[/C][C]0.31541[/C][/ROW]
[ROW][C]18[/C][C]-0.15879[/C][C]-0.9916[/C][C]0.163742[/C][/ROW]
[ROW][C]19[/C][C]0.088888[/C][C]0.5551[/C][C]0.290996[/C][/ROW]
[ROW][C]20[/C][C]-0.06136[/C][C]-0.3832[/C][C]0.35183[/C][/ROW]
[ROW][C]21[/C][C]-0.007666[/C][C]-0.0479[/C][C]0.481031[/C][/ROW]
[ROW][C]22[/C][C]-0.040541[/C][C]-0.2532[/C][C]0.400729[/C][/ROW]
[ROW][C]23[/C][C]-0.056524[/C][C]-0.353[/C][C]0.362997[/C][/ROW]
[ROW][C]24[/C][C]0.099567[/C][C]0.6218[/C][C]0.268848[/C][/ROW]
[/TABLE]
Source: https://freestatistics.org/blog/index.php?pk=34304&T=1

Globally Unique Identifier (entire table): ba.freestatistics.org/blog/index.php?pk=34304&T=1

As an alternative you can also use a QR Code:  

The GUIDs for individual cells are displayed in the table below:

Autocorrelation Function
Time lag kACF(k)T-STATP-value
1-0.128413-0.80190.213724
20.006370.03980.484237
3-0.25456-1.58970.059986
40.035750.22330.41225
5-0.229986-1.43630.079451
60.0650680.40630.343354
7-0.085367-0.53310.298488
80.2285071.4270.080765
90.0021050.01310.494789
10-0.251785-1.57240.061969
110.1082280.67590.251551
120.0795940.49710.310967
130.0706510.44120.330747
14-0.157863-0.98590.165141
150.1103870.68940.247338
16-0.00986-0.06160.475607
170.0775640.48440.31541
18-0.15879-0.99160.163742
190.0888880.55510.290996
20-0.06136-0.38320.35183
21-0.007666-0.04790.481031
22-0.040541-0.25320.400729
23-0.056524-0.3530.362997
240.0995670.62180.268848


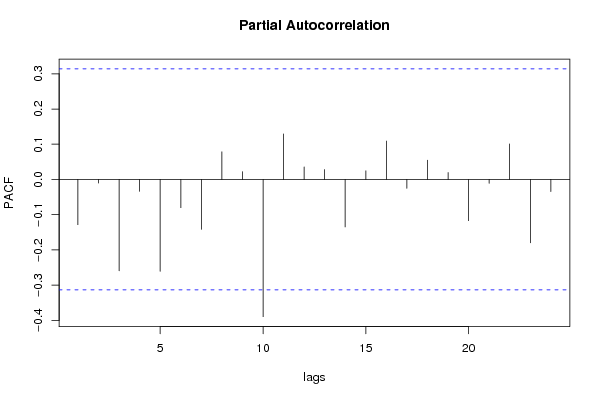
Partial Autocorrelation Function
Time lag kPACF(k)T-STATP-value
1-0.128413-0.80190.213724
2-0.01029-0.06430.474545
3-0.259359-1.61970.056679
4-0.033774-0.21090.417023
5-0.26103-1.63010.055562
6-0.080334-0.50170.309354
7-0.141556-0.8840.191053
80.0784090.48970.313558
90.0219230.13690.445904
10-0.389688-2.43360.009816
110.1293360.80770.212081
120.0353910.2210.413117
130.0281070.17550.430786
14-0.134919-0.84260.202304
150.0246120.15370.439318
160.1089550.68040.250128
17-0.02525-0.15770.437759
180.054740.34180.36715
190.0196350.12260.451518
20-0.117217-0.7320.234266
21-0.01093-0.06830.472964
220.1007960.62950.266355
23-0.179974-1.12390.133955
24-0.034494-0.21540.415284

\begin{tabular}{lllllllll}
\hline
Partial Autocorrelation Function \tabularnewline
Time lag k & PACF(k) & T-STAT & P-value \tabularnewline
1 & -0.128413 & -0.8019 & 0.213724 \tabularnewline
2 & -0.01029 & -0.0643 & 0.474545 \tabularnewline
3 & -0.259359 & -1.6197 & 0.056679 \tabularnewline
4 & -0.033774 & -0.2109 & 0.417023 \tabularnewline
5 & -0.26103 & -1.6301 & 0.055562 \tabularnewline
6 & -0.080334 & -0.5017 & 0.309354 \tabularnewline
7 & -0.141556 & -0.884 & 0.191053 \tabularnewline
8 & 0.078409 & 0.4897 & 0.313558 \tabularnewline
9 & 0.021923 & 0.1369 & 0.445904 \tabularnewline
10 & -0.389688 & -2.4336 & 0.009816 \tabularnewline
11 & 0.129336 & 0.8077 & 0.212081 \tabularnewline
12 & 0.035391 & 0.221 & 0.413117 \tabularnewline
13 & 0.028107 & 0.1755 & 0.430786 \tabularnewline
14 & -0.134919 & -0.8426 & 0.202304 \tabularnewline
15 & 0.024612 & 0.1537 & 0.439318 \tabularnewline
16 & 0.108955 & 0.6804 & 0.250128 \tabularnewline
17 & -0.02525 & -0.1577 & 0.437759 \tabularnewline
18 & 0.05474 & 0.3418 & 0.36715 \tabularnewline
19 & 0.019635 & 0.1226 & 0.451518 \tabularnewline
20 & -0.117217 & -0.732 & 0.234266 \tabularnewline
21 & -0.01093 & -0.0683 & 0.472964 \tabularnewline
22 & 0.100796 & 0.6295 & 0.266355 \tabularnewline
23 & -0.179974 & -1.1239 & 0.133955 \tabularnewline
24 & -0.034494 & -0.2154 & 0.415284 \tabularnewline
\hline
\end{tabular}
%Source: https://freestatistics.org/blog/index.php?pk=34304&T=2

[TABLE]
[ROW][C]Partial Autocorrelation Function[/C][/ROW]
[ROW][C]Time lag k[/C][C]PACF(k)[/C][C]T-STAT[/C][C]P-value[/C][/ROW]
[ROW][C]1[/C][C]-0.128413[/C][C]-0.8019[/C][C]0.213724[/C][/ROW]
[ROW][C]2[/C][C]-0.01029[/C][C]-0.0643[/C][C]0.474545[/C][/ROW]
[ROW][C]3[/C][C]-0.259359[/C][C]-1.6197[/C][C]0.056679[/C][/ROW]
[ROW][C]4[/C][C]-0.033774[/C][C]-0.2109[/C][C]0.417023[/C][/ROW]
[ROW][C]5[/C][C]-0.26103[/C][C]-1.6301[/C][C]0.055562[/C][/ROW]
[ROW][C]6[/C][C]-0.080334[/C][C]-0.5017[/C][C]0.309354[/C][/ROW]
[ROW][C]7[/C][C]-0.141556[/C][C]-0.884[/C][C]0.191053[/C][/ROW]
[ROW][C]8[/C][C]0.078409[/C][C]0.4897[/C][C]0.313558[/C][/ROW]
[ROW][C]9[/C][C]0.021923[/C][C]0.1369[/C][C]0.445904[/C][/ROW]
[ROW][C]10[/C][C]-0.389688[/C][C]-2.4336[/C][C]0.009816[/C][/ROW]
[ROW][C]11[/C][C]0.129336[/C][C]0.8077[/C][C]0.212081[/C][/ROW]
[ROW][C]12[/C][C]0.035391[/C][C]0.221[/C][C]0.413117[/C][/ROW]
[ROW][C]13[/C][C]0.028107[/C][C]0.1755[/C][C]0.430786[/C][/ROW]
[ROW][C]14[/C][C]-0.134919[/C][C]-0.8426[/C][C]0.202304[/C][/ROW]
[ROW][C]15[/C][C]0.024612[/C][C]0.1537[/C][C]0.439318[/C][/ROW]
[ROW][C]16[/C][C]0.108955[/C][C]0.6804[/C][C]0.250128[/C][/ROW]
[ROW][C]17[/C][C]-0.02525[/C][C]-0.1577[/C][C]0.437759[/C][/ROW]
[ROW][C]18[/C][C]0.05474[/C][C]0.3418[/C][C]0.36715[/C][/ROW]
[ROW][C]19[/C][C]0.019635[/C][C]0.1226[/C][C]0.451518[/C][/ROW]
[ROW][C]20[/C][C]-0.117217[/C][C]-0.732[/C][C]0.234266[/C][/ROW]
[ROW][C]21[/C][C]-0.01093[/C][C]-0.0683[/C][C]0.472964[/C][/ROW]
[ROW][C]22[/C][C]0.100796[/C][C]0.6295[/C][C]0.266355[/C][/ROW]
[ROW][C]23[/C][C]-0.179974[/C][C]-1.1239[/C][C]0.133955[/C][/ROW]
[ROW][C]24[/C][C]-0.034494[/C][C]-0.2154[/C][C]0.415284[/C][/ROW]
[/TABLE]
Source: https://freestatistics.org/blog/index.php?pk=34304&T=2

Globally Unique Identifier (entire table): ba.freestatistics.org/blog/index.php?pk=34304&T=2

As an alternative you can also use a QR Code:  

The GUIDs for individual cells are displayed in the table below:

Partial Autocorrelation Function
Time lag kPACF(k)T-STATP-value
1-0.128413-0.80190.213724
2-0.01029-0.06430.474545
3-0.259359-1.61970.056679
4-0.033774-0.21090.417023
5-0.26103-1.63010.055562
6-0.080334-0.50170.309354
7-0.141556-0.8840.191053
80.0784090.48970.313558
90.0219230.13690.445904
10-0.389688-2.43360.009816
110.1293360.80770.212081
120.0353910.2210.413117
130.0281070.17550.430786
14-0.134919-0.84260.202304
150.0246120.15370.439318
160.1089550.68040.250128
17-0.02525-0.15770.437759
180.054740.34180.36715
190.0196350.12260.451518
20-0.117217-0.7320.234266
21-0.01093-0.06830.472964
220.1007960.62950.266355
23-0.179974-1.12390.133955
24-0.034494-0.21540.415284


Parameters (Session):
par1 = 24 ; par2 = 0.3 ; par3 = 1 ; par4 = 0 ; par5 = 4 ;
Parameters (R input):
par1 = 24 ; par2 = 0.3 ; par3 = 1 ; par4 = 0 ; par5 = 4 ;
R code (references can be found in the software module):
if (par1 == 'Default') {
par1 = 10*log10(length(x))
} else {
par1 <- as.numeric(par1)
}
par2 <- as.numeric(par2)
par3 <- as.numeric(par3)
par4 <- as.numeric(par4)
par5 <- as.numeric(par5)
if (par2 == 0) {
x <- log(x)
} else {
x <- (x ^ par2 - 1) / par2
}
if (par3 > 0) x <- diff(x,lag=1,difference=par3)
if (par4 > 0) x <- diff(x,lag=par5,difference=par4)
bitmap(file='pic1.png')
racf <- acf(x,par1,main='Autocorrelation',xlab='lags',ylab='ACF')
dev.off()
bitmap(file='pic2.png')
rpacf <- pacf(x,par1,main='Partial Autocorrelation',xlab='lags',ylab='PACF')
dev.off()
(myacf <- c(racf$acf))
(mypacf <- c(rpacf$acf))
lengthx <- length(x)
sqrtn <- sqrt(lengthx)
load(file='createtable')
a<-table.start()
a<-table.row.start(a)
a<-table.element(a,'Autocorrelation Function',4,TRUE)
a<-table.row.end(a)
a<-table.row.start(a)
a<-table.element(a,'Time lag k',header=TRUE)
a<-table.element(a,hyperlink('basics.htm','ACF(k)','click here for more information about the Autocorrelation Function'),header=TRUE)
a<-table.element(a,'T-STAT',header=TRUE)
a<-table.element(a,'P-value',header=TRUE)
a<-table.row.end(a)
for (i in 2:(par1+1)) {
a<-table.row.start(a)
a<-table.element(a,i-1,header=TRUE)
a<-table.element(a,round(myacf[i],6))
mytstat <- myacf[i]*sqrtn
a<-table.element(a,round(mytstat,4))
a<-table.element(a,round(1-pt(abs(mytstat),lengthx),6))
a<-table.row.end(a)
}
a<-table.end(a)
table.save(a,file='mytable.tab')
a<-table.start()
a<-table.row.start(a)
a<-table.element(a,'Partial Autocorrelation Function',4,TRUE)
a<-table.row.end(a)
a<-table.row.start(a)
a<-table.element(a,'Time lag k',header=TRUE)
a<-table.element(a,hyperlink('basics.htm','PACF(k)','click here for more information about the Partial Autocorrelation Function'),header=TRUE)
a<-table.element(a,'T-STAT',header=TRUE)
a<-table.element(a,'P-value',header=TRUE)
a<-table.row.end(a)
for (i in 1:par1) {
a<-table.row.start(a)
a<-table.element(a,i,header=TRUE)
a<-table.element(a,round(mypacf[i],6))
mytstat <- mypacf[i]*sqrtn
a<-table.element(a,round(mytstat,4))
a<-table.element(a,round(1-pt(abs(mytstat),lengthx),6))
a<-table.row.end(a)
}
a<-table.end(a)
table.save(a,file='mytable1.tab')