Free Statistics

of Irreproducible Research!

Author's title

Author*Unverified author*
R Software Modulerwasp_arimaforecasting.wasp
Title produced by softwareARIMA Forecasting
Date of computationSat, 13 Dec 2008 08:36:11 -0700
Cite this page as followsStatistical Computations at FreeStatistics.org, Office for Research Development and Education, URL https://freestatistics.org/blog/index.php?v=date/2008/Dec/13/t1229182625s3gbdlxl7j5djys.htm/, Retrieved Wed, 15 May 2024 22:14:35 +0000
Statistical Computations at FreeStatistics.org, Office for Research Development and Education, URL https://freestatistics.org/blog/index.php?pk=33153, Retrieved Wed, 15 May 2024 22:14:35 +0000
QR Codes:

Original text written by user:
IsPrivate?No (this computation is public)
User-defined keywords
Estimated Impact209
Family? (F = Feedback message, R = changed R code, M = changed R Module, P = changed Parameters, D = changed Data)
-     [ARIMA Backward Selection] [ARIMA bel20] [2008-12-13 15:32:40] [74be16979710d4c4e7c6647856088456]
F RMP     [ARIMA Forecasting] [] [2008-12-13 15:36:11] [d41d8cd98f00b204e9800998ecf8427e] [Current]
-   PD      [ARIMA Forecasting] [ARIMA p=1 BEL20] [2008-12-16 16:17:08] [74be16979710d4c4e7c6647856088456]
-  MPD      [ARIMA Forecasting] [forecasting] [2009-12-14 13:22:22] [960f506a46b790b06fab7ca57984a121]
-  MPD      [ARIMA Forecasting] [] [2009-12-15 15:40:27] [2f674a53c3d7aaa1bcf80e66074d3c9b]
-    D        [ARIMA Forecasting] [] [2009-12-15 15:48:35] [2f674a53c3d7aaa1bcf80e66074d3c9b]
-   PD        [ARIMA Forecasting] [paper] [2010-12-25 14:06:37] [960f506a46b790b06fab7ca57984a121]
Feedback Forum
2008-12-23 22:03:10 [Kelly Deckx] [reply
2008-12-23 22:10:52 [Kelly Deckx] [reply
STEP 1

de berekening is goed uitgevoerd en ik heb de tabellen ook juist toegelicht.

STEP 2
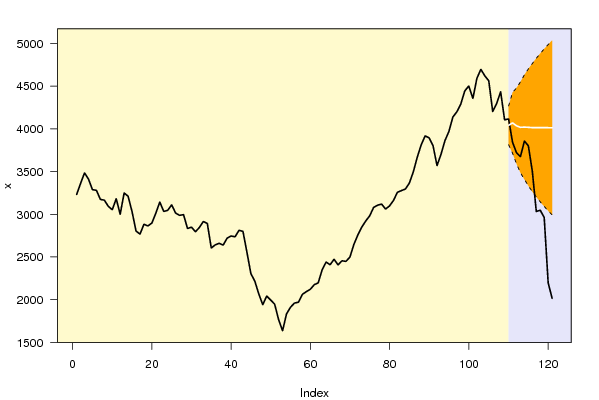
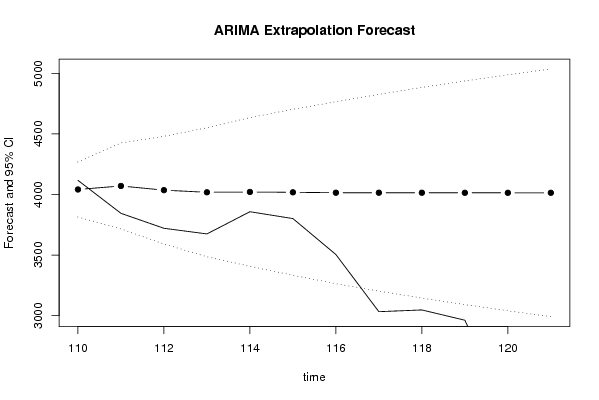
De voorspelling had duidelijk geen trends want het is gewoon een rechte lijn. Ik denk dat dit wil zeggen dat de voorspelling niet echt kan gemaakt worden.

STEP3
de voorspelling die het meest redelijk waren zijn 110,114 en 115. Dit was ik vergeten te vermelden.

STEP4
De data voorspelt een zéér lichte stijgende trend, dus hier kan gewoon geen voorspelling gemaakt worden.

STEP 5
Deze vraag is juist beantwoord, het is duidelijk dat het model geen goede voorspelling maakt. (wat ook logisch is, gezien de tijdreeks)

Post a new message
Dataseries X:
3230,66
3361,13
3484,74
3411,13
3288,18
3280,37
3173,95
3165,26
3092,71
3053,05
3181,96
2999,93
3249,57
3210,52
3030,29
2803,47
2767,63
2882,6
2863,36
2897,06
3012,61
3142,95
3032,93
3045,78
3110,52
3013,24
2987,1
2995,55
2833,18
2848,96
2794,83
2845,26
2915,02
2892,63
2604,42
2641,65
2659,81
2638,53
2720,25
2745,88
2735,7
2811,7
2799,43
2555,28
2304,98
2214,95
2065,81
1940,49
2042
1995,37
1946,81
1765,9
1635,25
1833,42
1910,43
1959,67
1969,6
2061,41
2093,48
2120,88
2174,56
2196,72
2350,44
2440,25
2408,64
2472,81
2407,6
2454,62
2448,05
2497,84
2645,64
2756,76
2849,27
2921,44
2981,85
3080,58
3106,22
3119,31
3061,26
3097,31
3161,69
3257,16
3277,01
3295,32
3363,99
3494,17
3667,03
3813,06
3917,96
3895,51
3801,06
3570,12
3701,61
3862,27
3970,1
4138,52
4199,75
4290,89
4443,91
4502,64
4356,98
4591,27
4696,96
4621,4
4562,84
4202,52
4296,49
4435,23
4105,18
4116,68
3844,49
3720,98
3674,4
3857,62
3801,06
3504,37
3032,6
3047,03
2962,34
2197,82
2014,45


Summary of computational transaction
Raw Inputview raw input (R code)
Raw Outputview raw output of R engine
Computing time1 seconds
R Server'Gwilym Jenkins' @ 72.249.127.135

\begin{tabular}{lllllllll}
\hline
Summary of computational transaction \tabularnewline
Raw Input & view raw input (R code)  \tabularnewline
Raw Output & view raw output of R engine  \tabularnewline
Computing time & 1 seconds \tabularnewline
R Server & 'Gwilym Jenkins' @ 72.249.127.135 \tabularnewline
\hline
\end{tabular}
%Source: https://freestatistics.org/blog/index.php?pk=33153&T=0

[TABLE]
[ROW][C]Summary of computational transaction[/C][/ROW]
[ROW][C]Raw Input[/C][C]view raw input (R code) [/C][/ROW]
[ROW][C]Raw Output[/C][C]view raw output of R engine [/C][/ROW]
[ROW][C]Computing time[/C][C]1 seconds[/C][/ROW]
[ROW][C]R Server[/C][C]'Gwilym Jenkins' @ 72.249.127.135[/C][/ROW]
[/TABLE]
Source: https://freestatistics.org/blog/index.php?pk=33153&T=0

Globally Unique Identifier (entire table): ba.freestatistics.org/blog/index.php?pk=33153&T=0

As an alternative you can also use a QR Code:  

The GUIDs for individual cells are displayed in the table below:

Summary of computational transaction
Raw Inputview raw input (R code)
Raw Outputview raw output of R engine
Computing time1 seconds
R Server'Gwilym Jenkins' @ 72.249.127.135


Univariate ARIMA Extrapolation Forecast
timeY[t]F[t]95% LB95% UBp-value(H0: Y[t] = F[t])P(F[t]>Y[t-1])P(F[t]>Y[t-s])P(F[t]>Y[109])
974199.75-------
984290.89-------
994443.91-------
1004502.64-------
1014356.98-------
1024591.27-------
1034696.96-------
1044621.4-------
1054562.84-------
1064202.52-------
1074296.49-------
1084435.23-------
1094105.18-------
1104116.684041.30263814.18424268.42090.25770.29070.01560.2907
1113844.494070.20553714.92944425.48150.10650.39880.01960.4235
1123720.984035.69173591.44424479.93910.08250.80050.01970.3796
1133674.44017.99633485.8094550.18360.10290.8630.10590.3741
1143857.624020.7393407.30644634.17170.30110.86580.03420.3937
1153801.064017.84133332.85214702.83060.26750.67670.0260.4013
1163504.374014.65843263.81784765.49910.09140.71140.05660.4066
1173032.64014.58733202.3864826.78850.00890.89090.09290.4135
1183047.034014.40123145.08084883.72160.01460.98660.33570.4189
1192962.344013.93613090.9394936.93310.01280.980.27430.4232
1202197.824013.8453040.01894987.6711e-040.98280.19820.4271
1212014.454013.83372991.67875035.98861e-040.99980.43050.4305

\begin{tabular}{lllllllll}
\hline
Univariate ARIMA Extrapolation Forecast \tabularnewline
time & Y[t] & F[t] & 95% LB & 95% UB & p-value(H0: Y[t] = F[t]) & P(F[t]>Y[t-1]) & P(F[t]>Y[t-s]) & P(F[t]>Y[109]) \tabularnewline
97 & 4199.75 & - & - & - & - & - & - & - \tabularnewline
98 & 4290.89 & - & - & - & - & - & - & - \tabularnewline
99 & 4443.91 & - & - & - & - & - & - & - \tabularnewline
100 & 4502.64 & - & - & - & - & - & - & - \tabularnewline
101 & 4356.98 & - & - & - & - & - & - & - \tabularnewline
102 & 4591.27 & - & - & - & - & - & - & - \tabularnewline
103 & 4696.96 & - & - & - & - & - & - & - \tabularnewline
104 & 4621.4 & - & - & - & - & - & - & - \tabularnewline
105 & 4562.84 & - & - & - & - & - & - & - \tabularnewline
106 & 4202.52 & - & - & - & - & - & - & - \tabularnewline
107 & 4296.49 & - & - & - & - & - & - & - \tabularnewline
108 & 4435.23 & - & - & - & - & - & - & - \tabularnewline
109 & 4105.18 & - & - & - & - & - & - & - \tabularnewline
110 & 4116.68 & 4041.3026 & 3814.1842 & 4268.4209 & 0.2577 & 0.2907 & 0.0156 & 0.2907 \tabularnewline
111 & 3844.49 & 4070.2055 & 3714.9294 & 4425.4815 & 0.1065 & 0.3988 & 0.0196 & 0.4235 \tabularnewline
112 & 3720.98 & 4035.6917 & 3591.4442 & 4479.9391 & 0.0825 & 0.8005 & 0.0197 & 0.3796 \tabularnewline
113 & 3674.4 & 4017.9963 & 3485.809 & 4550.1836 & 0.1029 & 0.863 & 0.1059 & 0.3741 \tabularnewline
114 & 3857.62 & 4020.739 & 3407.3064 & 4634.1717 & 0.3011 & 0.8658 & 0.0342 & 0.3937 \tabularnewline
115 & 3801.06 & 4017.8413 & 3332.8521 & 4702.8306 & 0.2675 & 0.6767 & 0.026 & 0.4013 \tabularnewline
116 & 3504.37 & 4014.6584 & 3263.8178 & 4765.4991 & 0.0914 & 0.7114 & 0.0566 & 0.4066 \tabularnewline
117 & 3032.6 & 4014.5873 & 3202.386 & 4826.7885 & 0.0089 & 0.8909 & 0.0929 & 0.4135 \tabularnewline
118 & 3047.03 & 4014.4012 & 3145.0808 & 4883.7216 & 0.0146 & 0.9866 & 0.3357 & 0.4189 \tabularnewline
119 & 2962.34 & 4013.9361 & 3090.939 & 4936.9331 & 0.0128 & 0.98 & 0.2743 & 0.4232 \tabularnewline
120 & 2197.82 & 4013.845 & 3040.0189 & 4987.671 & 1e-04 & 0.9828 & 0.1982 & 0.4271 \tabularnewline
121 & 2014.45 & 4013.8337 & 2991.6787 & 5035.9886 & 1e-04 & 0.9998 & 0.4305 & 0.4305 \tabularnewline
\hline
\end{tabular}
%Source: https://freestatistics.org/blog/index.php?pk=33153&T=1

[TABLE]
[ROW][C]Univariate ARIMA Extrapolation Forecast[/C][/ROW]
[ROW][C]time[/C][C]Y[t][/C][C]F[t][/C][C]95% LB[/C][C]95% UB[/C][C]p-value(H0: Y[t] = F[t])[/C][C]P(F[t]>Y[t-1])[/C][C]P(F[t]>Y[t-s])[/C][C]P(F[t]>Y[109])[/C][/ROW]
[ROW][C]97[/C][C]4199.75[/C][C]-[/C][C]-[/C][C]-[/C][C]-[/C][C]-[/C][C]-[/C][C]-[/C][/ROW]
[ROW][C]98[/C][C]4290.89[/C][C]-[/C][C]-[/C][C]-[/C][C]-[/C][C]-[/C][C]-[/C][C]-[/C][/ROW]
[ROW][C]99[/C][C]4443.91[/C][C]-[/C][C]-[/C][C]-[/C][C]-[/C][C]-[/C][C]-[/C][C]-[/C][/ROW]
[ROW][C]100[/C][C]4502.64[/C][C]-[/C][C]-[/C][C]-[/C][C]-[/C][C]-[/C][C]-[/C][C]-[/C][/ROW]
[ROW][C]101[/C][C]4356.98[/C][C]-[/C][C]-[/C][C]-[/C][C]-[/C][C]-[/C][C]-[/C][C]-[/C][/ROW]
[ROW][C]102[/C][C]4591.27[/C][C]-[/C][C]-[/C][C]-[/C][C]-[/C][C]-[/C][C]-[/C][C]-[/C][/ROW]
[ROW][C]103[/C][C]4696.96[/C][C]-[/C][C]-[/C][C]-[/C][C]-[/C][C]-[/C][C]-[/C][C]-[/C][/ROW]
[ROW][C]104[/C][C]4621.4[/C][C]-[/C][C]-[/C][C]-[/C][C]-[/C][C]-[/C][C]-[/C][C]-[/C][/ROW]
[ROW][C]105[/C][C]4562.84[/C][C]-[/C][C]-[/C][C]-[/C][C]-[/C][C]-[/C][C]-[/C][C]-[/C][/ROW]
[ROW][C]106[/C][C]4202.52[/C][C]-[/C][C]-[/C][C]-[/C][C]-[/C][C]-[/C][C]-[/C][C]-[/C][/ROW]
[ROW][C]107[/C][C]4296.49[/C][C]-[/C][C]-[/C][C]-[/C][C]-[/C][C]-[/C][C]-[/C][C]-[/C][/ROW]
[ROW][C]108[/C][C]4435.23[/C][C]-[/C][C]-[/C][C]-[/C][C]-[/C][C]-[/C][C]-[/C][C]-[/C][/ROW]
[ROW][C]109[/C][C]4105.18[/C][C]-[/C][C]-[/C][C]-[/C][C]-[/C][C]-[/C][C]-[/C][C]-[/C][/ROW]
[ROW][C]110[/C][C]4116.68[/C][C]4041.3026[/C][C]3814.1842[/C][C]4268.4209[/C][C]0.2577[/C][C]0.2907[/C][C]0.0156[/C][C]0.2907[/C][/ROW]
[ROW][C]111[/C][C]3844.49[/C][C]4070.2055[/C][C]3714.9294[/C][C]4425.4815[/C][C]0.1065[/C][C]0.3988[/C][C]0.0196[/C][C]0.4235[/C][/ROW]
[ROW][C]112[/C][C]3720.98[/C][C]4035.6917[/C][C]3591.4442[/C][C]4479.9391[/C][C]0.0825[/C][C]0.8005[/C][C]0.0197[/C][C]0.3796[/C][/ROW]
[ROW][C]113[/C][C]3674.4[/C][C]4017.9963[/C][C]3485.809[/C][C]4550.1836[/C][C]0.1029[/C][C]0.863[/C][C]0.1059[/C][C]0.3741[/C][/ROW]
[ROW][C]114[/C][C]3857.62[/C][C]4020.739[/C][C]3407.3064[/C][C]4634.1717[/C][C]0.3011[/C][C]0.8658[/C][C]0.0342[/C][C]0.3937[/C][/ROW]
[ROW][C]115[/C][C]3801.06[/C][C]4017.8413[/C][C]3332.8521[/C][C]4702.8306[/C][C]0.2675[/C][C]0.6767[/C][C]0.026[/C][C]0.4013[/C][/ROW]
[ROW][C]116[/C][C]3504.37[/C][C]4014.6584[/C][C]3263.8178[/C][C]4765.4991[/C][C]0.0914[/C][C]0.7114[/C][C]0.0566[/C][C]0.4066[/C][/ROW]
[ROW][C]117[/C][C]3032.6[/C][C]4014.5873[/C][C]3202.386[/C][C]4826.7885[/C][C]0.0089[/C][C]0.8909[/C][C]0.0929[/C][C]0.4135[/C][/ROW]
[ROW][C]118[/C][C]3047.03[/C][C]4014.4012[/C][C]3145.0808[/C][C]4883.7216[/C][C]0.0146[/C][C]0.9866[/C][C]0.3357[/C][C]0.4189[/C][/ROW]
[ROW][C]119[/C][C]2962.34[/C][C]4013.9361[/C][C]3090.939[/C][C]4936.9331[/C][C]0.0128[/C][C]0.98[/C][C]0.2743[/C][C]0.4232[/C][/ROW]
[ROW][C]120[/C][C]2197.82[/C][C]4013.845[/C][C]3040.0189[/C][C]4987.671[/C][C]1e-04[/C][C]0.9828[/C][C]0.1982[/C][C]0.4271[/C][/ROW]
[ROW][C]121[/C][C]2014.45[/C][C]4013.8337[/C][C]2991.6787[/C][C]5035.9886[/C][C]1e-04[/C][C]0.9998[/C][C]0.4305[/C][C]0.4305[/C][/ROW]
[/TABLE]
Source: https://freestatistics.org/blog/index.php?pk=33153&T=1

Globally Unique Identifier (entire table): ba.freestatistics.org/blog/index.php?pk=33153&T=1

As an alternative you can also use a QR Code:  

The GUIDs for individual cells are displayed in the table below:

Univariate ARIMA Extrapolation Forecast
timeY[t]F[t]95% LB95% UBp-value(H0: Y[t] = F[t])P(F[t]>Y[t-1])P(F[t]>Y[t-s])P(F[t]>Y[109])
974199.75-------
984290.89-------
994443.91-------
1004502.64-------
1014356.98-------
1024591.27-------
1034696.96-------
1044621.4-------
1054562.84-------
1064202.52-------
1074296.49-------
1084435.23-------
1094105.18-------
1104116.684041.30263814.18424268.42090.25770.29070.01560.2907
1113844.494070.20553714.92944425.48150.10650.39880.01960.4235
1123720.984035.69173591.44424479.93910.08250.80050.01970.3796
1133674.44017.99633485.8094550.18360.10290.8630.10590.3741
1143857.624020.7393407.30644634.17170.30110.86580.03420.3937
1153801.064017.84133332.85214702.83060.26750.67670.0260.4013
1163504.374014.65843263.81784765.49910.09140.71140.05660.4066
1173032.64014.58733202.3864826.78850.00890.89090.09290.4135
1183047.034014.40123145.08084883.72160.01460.98660.33570.4189
1192962.344013.93613090.9394936.93310.01280.980.27430.4232
1202197.824013.8453040.01894987.6711e-040.98280.19820.4271
1212014.454013.83372991.67875035.98861e-040.99980.43050.4305


Univariate ARIMA Extrapolation Forecast Performance
time% S.E.PEMAPESq.EMSERMSE
1100.02870.01870.00165681.7591473.479921.7596
1110.0445-0.05550.004650947.48644245.623965.1585
1120.0562-0.0780.006599043.43578253.619690.8494
1130.0676-0.08550.0071118058.42349838.201999.1877
1140.0778-0.04060.003426607.81562217.31847.0884
1150.087-0.0540.004546994.14493916.178762.5794
1160.0954-0.12710.0106260394.288821699.5241147.3076
1170.1032-0.24460.0204964299.019380358.2516283.4753
1180.1105-0.2410.0201935807.044677983.9204279.256
1190.1173-0.2620.02181105854.266592154.5222303.5696
1200.1238-0.45240.03773297946.7676274828.8973524.2413
1210.1299-0.49810.04153997535.0869333127.9239577.1724

\begin{tabular}{lllllllll}
\hline
Univariate ARIMA Extrapolation Forecast Performance \tabularnewline
time & % S.E. & PE & MAPE & Sq.E & MSE & RMSE \tabularnewline
110 & 0.0287 & 0.0187 & 0.0016 & 5681.7591 & 473.4799 & 21.7596 \tabularnewline
111 & 0.0445 & -0.0555 & 0.0046 & 50947.4864 & 4245.6239 & 65.1585 \tabularnewline
112 & 0.0562 & -0.078 & 0.0065 & 99043.4357 & 8253.6196 & 90.8494 \tabularnewline
113 & 0.0676 & -0.0855 & 0.0071 & 118058.4234 & 9838.2019 & 99.1877 \tabularnewline
114 & 0.0778 & -0.0406 & 0.0034 & 26607.8156 & 2217.318 & 47.0884 \tabularnewline
115 & 0.087 & -0.054 & 0.0045 & 46994.1449 & 3916.1787 & 62.5794 \tabularnewline
116 & 0.0954 & -0.1271 & 0.0106 & 260394.2888 & 21699.5241 & 147.3076 \tabularnewline
117 & 0.1032 & -0.2446 & 0.0204 & 964299.0193 & 80358.2516 & 283.4753 \tabularnewline
118 & 0.1105 & -0.241 & 0.0201 & 935807.0446 & 77983.9204 & 279.256 \tabularnewline
119 & 0.1173 & -0.262 & 0.0218 & 1105854.2665 & 92154.5222 & 303.5696 \tabularnewline
120 & 0.1238 & -0.4524 & 0.0377 & 3297946.7676 & 274828.8973 & 524.2413 \tabularnewline
121 & 0.1299 & -0.4981 & 0.0415 & 3997535.0869 & 333127.9239 & 577.1724 \tabularnewline
\hline
\end{tabular}
%Source: https://freestatistics.org/blog/index.php?pk=33153&T=2

[TABLE]
[ROW][C]Univariate ARIMA Extrapolation Forecast Performance[/C][/ROW]
[ROW][C]time[/C][C]% S.E.[/C][C]PE[/C][C]MAPE[/C][C]Sq.E[/C][C]MSE[/C][C]RMSE[/C][/ROW]
[ROW][C]110[/C][C]0.0287[/C][C]0.0187[/C][C]0.0016[/C][C]5681.7591[/C][C]473.4799[/C][C]21.7596[/C][/ROW]
[ROW][C]111[/C][C]0.0445[/C][C]-0.0555[/C][C]0.0046[/C][C]50947.4864[/C][C]4245.6239[/C][C]65.1585[/C][/ROW]
[ROW][C]112[/C][C]0.0562[/C][C]-0.078[/C][C]0.0065[/C][C]99043.4357[/C][C]8253.6196[/C][C]90.8494[/C][/ROW]
[ROW][C]113[/C][C]0.0676[/C][C]-0.0855[/C][C]0.0071[/C][C]118058.4234[/C][C]9838.2019[/C][C]99.1877[/C][/ROW]
[ROW][C]114[/C][C]0.0778[/C][C]-0.0406[/C][C]0.0034[/C][C]26607.8156[/C][C]2217.318[/C][C]47.0884[/C][/ROW]
[ROW][C]115[/C][C]0.087[/C][C]-0.054[/C][C]0.0045[/C][C]46994.1449[/C][C]3916.1787[/C][C]62.5794[/C][/ROW]
[ROW][C]116[/C][C]0.0954[/C][C]-0.1271[/C][C]0.0106[/C][C]260394.2888[/C][C]21699.5241[/C][C]147.3076[/C][/ROW]
[ROW][C]117[/C][C]0.1032[/C][C]-0.2446[/C][C]0.0204[/C][C]964299.0193[/C][C]80358.2516[/C][C]283.4753[/C][/ROW]
[ROW][C]118[/C][C]0.1105[/C][C]-0.241[/C][C]0.0201[/C][C]935807.0446[/C][C]77983.9204[/C][C]279.256[/C][/ROW]
[ROW][C]119[/C][C]0.1173[/C][C]-0.262[/C][C]0.0218[/C][C]1105854.2665[/C][C]92154.5222[/C][C]303.5696[/C][/ROW]
[ROW][C]120[/C][C]0.1238[/C][C]-0.4524[/C][C]0.0377[/C][C]3297946.7676[/C][C]274828.8973[/C][C]524.2413[/C][/ROW]
[ROW][C]121[/C][C]0.1299[/C][C]-0.4981[/C][C]0.0415[/C][C]3997535.0869[/C][C]333127.9239[/C][C]577.1724[/C][/ROW]
[/TABLE]
Source: https://freestatistics.org/blog/index.php?pk=33153&T=2

Globally Unique Identifier (entire table): ba.freestatistics.org/blog/index.php?pk=33153&T=2

As an alternative you can also use a QR Code:  

The GUIDs for individual cells are displayed in the table below:

Univariate ARIMA Extrapolation Forecast Performance
time% S.E.PEMAPESq.EMSERMSE
1100.02870.01870.00165681.7591473.479921.7596
1110.0445-0.05550.004650947.48644245.623965.1585
1120.0562-0.0780.006599043.43578253.619690.8494
1130.0676-0.08550.0071118058.42349838.201999.1877
1140.0778-0.04060.003426607.81562217.31847.0884
1150.087-0.0540.004546994.14493916.178762.5794
1160.0954-0.12710.0106260394.288821699.5241147.3076
1170.1032-0.24460.0204964299.019380358.2516283.4753
1180.1105-0.2410.0201935807.044677983.9204279.256
1190.1173-0.2620.02181105854.266592154.5222303.5696
1200.1238-0.45240.03773297946.7676274828.8973524.2413
1210.1299-0.49810.04153997535.0869333127.9239577.1724


Parameters (Session):
par1 = 12 ; par2 = 1 ; par3 = 1 ; par4 = 0 ; par5 = 12 ; par6 = 3 ; par7 = 0 ; par8 = 0 ; par9 = 0 ; par10 = FALSE ;
Parameters (R input):
par1 = 12 ; par2 = 1 ; par3 = 1 ; par4 = 0 ; par5 = 12 ; par6 = 3 ; par7 = 0 ; par8 = 0 ; par9 = 0 ; par10 = FALSE ;
R code (references can be found in the software module):
par1 <- as.numeric(par1) #cut off periods
par2 <- as.numeric(par2) #lambda
par3 <- as.numeric(par3) #degree of non-seasonal differencing
par4 <- as.numeric(par4) #degree of seasonal differencing
par5 <- as.numeric(par5) #seasonal period
par6 <- as.numeric(par6) #p
par7 <- as.numeric(par7) #q
par8 <- as.numeric(par8) #P
par9 <- as.numeric(par9) #Q
if (par10 == 'TRUE') par10 <- TRUE
if (par10 == 'FALSE') par10 <- FALSE
if (par2 == 0) x <- log(x)
if (par2 != 0) x <- x^par2
lx <- length(x)
first <- lx - 2*par1
nx <- lx - par1
nx1 <- nx + 1
fx <- lx - nx
if (fx < 1) {
fx <- par5
nx1 <- lx + fx - 1
first <- lx - 2*fx
}
first <- 1
if (fx < 3) fx <- round(lx/10,0)
(arima.out <- arima(x[1:nx], order=c(par6,par3,par7), seasonal=list(order=c(par8,par4,par9), period=par5), include.mean=par10, method='ML'))
(forecast <- predict(arima.out,fx))
(lb <- forecast$pred - 1.96 * forecast$se)
(ub <- forecast$pred + 1.96 * forecast$se)
if (par2 == 0) {
x <- exp(x)
forecast$pred <- exp(forecast$pred)
lb <- exp(lb)
ub <- exp(ub)
}
if (par2 != 0) {
x <- x^(1/par2)
forecast$pred <- forecast$pred^(1/par2)
lb <- lb^(1/par2)
ub <- ub^(1/par2)
}
if (par2 < 0) {
olb <- lb
lb <- ub
ub <- olb
}
(actandfor <- c(x[1:nx], forecast$pred))
(perc.se <- (ub-forecast$pred)/1.96/forecast$pred)
bitmap(file='test1.png')
opar <- par(mar=c(4,4,2,2),las=1)
ylim <- c( min(x[first:nx],lb), max(x[first:nx],ub))
plot(x,ylim=ylim,type='n',xlim=c(first,lx))
usr <- par('usr')
rect(usr[1],usr[3],nx+1,usr[4],border=NA,col='lemonchiffon')
rect(nx1,usr[3],usr[2],usr[4],border=NA,col='lavender')
abline(h= (-3:3)*2 , col ='gray', lty =3)
polygon( c(nx1:lx,lx:nx1), c(lb,rev(ub)), col = 'orange', lty=2,border=NA)
lines(nx1:lx, lb , lty=2)
lines(nx1:lx, ub , lty=2)
lines(x, lwd=2)
lines(nx1:lx, forecast$pred , lwd=2 , col ='white')
box()
par(opar)
dev.off()
prob.dec <- array(NA, dim=fx)
prob.sdec <- array(NA, dim=fx)
prob.ldec <- array(NA, dim=fx)
prob.pval <- array(NA, dim=fx)
perf.pe <- array(0, dim=fx)
perf.mape <- array(0, dim=fx)
perf.se <- array(0, dim=fx)
perf.mse <- array(0, dim=fx)
perf.rmse <- array(0, dim=fx)
for (i in 1:fx) {
locSD <- (ub[i] - forecast$pred[i]) / 1.96
perf.pe[i] = (x[nx+i] - forecast$pred[i]) / forecast$pred[i]
perf.mape[i] = perf.mape[i] + abs(perf.pe[i])
perf.se[i] = (x[nx+i] - forecast$pred[i])^2
perf.mse[i] = perf.mse[i] + perf.se[i]
prob.dec[i] = pnorm((x[nx+i-1] - forecast$pred[i]) / locSD)
prob.sdec[i] = pnorm((x[nx+i-par5] - forecast$pred[i]) / locSD)
prob.ldec[i] = pnorm((x[nx] - forecast$pred[i]) / locSD)
prob.pval[i] = pnorm(abs(x[nx+i] - forecast$pred[i]) / locSD)
}
perf.mape = perf.mape / fx
perf.mse = perf.mse / fx
perf.rmse = sqrt(perf.mse)
bitmap(file='test2.png')
plot(forecast$pred, pch=19, type='b',main='ARIMA Extrapolation Forecast', ylab='Forecast and 95% CI', xlab='time',ylim=c(min(lb),max(ub)))
dum <- forecast$pred
dum[1:12] <- x[(nx+1):lx]
lines(dum, lty=1)
lines(ub,lty=3)
lines(lb,lty=3)
dev.off()
load(file='createtable')
a<-table.start()
a<-table.row.start(a)
a<-table.element(a,'Univariate ARIMA Extrapolation Forecast',9,TRUE)
a<-table.row.end(a)
a<-table.row.start(a)
a<-table.element(a,'time',1,header=TRUE)
a<-table.element(a,'Y[t]',1,header=TRUE)
a<-table.element(a,'F[t]',1,header=TRUE)
a<-table.element(a,'95% LB',1,header=TRUE)
a<-table.element(a,'95% UB',1,header=TRUE)
a<-table.element(a,'p-value
(H0: Y[t] = F[t])',1,header=TRUE)
a<-table.element(a,'P(F[t]>Y[t-1])',1,header=TRUE)
a<-table.element(a,'P(F[t]>Y[t-s])',1,header=TRUE)
mylab <- paste('P(F[t]>Y[',nx,sep='')
mylab <- paste(mylab,'])',sep='')
a<-table.element(a,mylab,1,header=TRUE)
a<-table.row.end(a)
for (i in (nx-par5):nx) {
a<-table.row.start(a)
a<-table.element(a,i,header=TRUE)
a<-table.element(a,x[i])
a<-table.element(a,'-')
a<-table.row.end(a)
}
for (i in 1:fx) {
a<-table.row.start(a)
a<-table.element(a,nx+i,header=TRUE)
a<-table.element(a,round(x[nx+i],4))
a<-table.element(a,round(forecast$pred[i],4))
a<-table.element(a,round(lb[i],4))
a<-table.element(a,round(ub[i],4))
a<-table.element(a,round((1-prob.pval[i]),4))
a<-table.element(a,round((1-prob.dec[i]),4))
a<-table.element(a,round((1-prob.sdec[i]),4))
a<-table.element(a,round((1-prob.ldec[i]),4))
a<-table.row.end(a)
}
a<-table.end(a)
table.save(a,file='mytable.tab')
a<-table.start()
a<-table.row.start(a)
a<-table.element(a,'Univariate ARIMA Extrapolation Forecast Performance',7,TRUE)
a<-table.row.end(a)
a<-table.row.start(a)
a<-table.element(a,'time',1,header=TRUE)
a<-table.element(a,'% S.E.',1,header=TRUE)
a<-table.element(a,'PE',1,header=TRUE)
a<-table.element(a,'MAPE',1,header=TRUE)
a<-table.element(a,'Sq.E',1,header=TRUE)
a<-table.element(a,'MSE',1,header=TRUE)
a<-table.element(a,'RMSE',1,header=TRUE)
a<-table.row.end(a)
for (i in 1:fx) {
a<-table.row.start(a)
a<-table.element(a,nx+i,header=TRUE)
a<-table.element(a,round(perc.se[i],4))
a<-table.element(a,round(perf.pe[i],4))
a<-table.element(a,round(perf.mape[i],4))
a<-table.element(a,round(perf.se[i],4))
a<-table.element(a,round(perf.mse[i],4))
a<-table.element(a,round(perf.rmse[i],4))
a<-table.row.end(a)
}
a<-table.end(a)
table.save(a,file='mytable1.tab')