Free Statistics

of Irreproducible Research!

Author's title

Author*Unverified author*
R Software Modulerwasp_arimabackwardselection.wasp
Title produced by softwareARIMA Backward Selection
Date of computationTue, 09 Dec 2008 11:05:59 -0700
Cite this page as followsStatistical Computations at FreeStatistics.org, Office for Research Development and Education, URL https://freestatistics.org/blog/index.php?v=date/2008/Dec/09/t1228846512qsyj8vjzbmvewgr.htm/, Retrieved Sat, 18 May 2024 22:17:06 +0000
Statistical Computations at FreeStatistics.org, Office for Research Development and Education, URL https://freestatistics.org/blog/index.php?pk=31660, Retrieved Sat, 18 May 2024 22:17:06 +0000
QR Codes:

Original text written by user:
IsPrivate?No (this computation is public)
User-defined keywords
Estimated Impact187
Family? (F = Feedback message, R = changed R code, M = changed R Module, P = changed Parameters, D = changed Data)
-     [ARIMA Backward Selection] [ARIMA model: doll...] [2007-12-13 16:53:58] [707a919fab5d6f3020ea3c395672cd86]
F R  D    [ARIMA Backward Selection] [Stefan Temmerman] [2008-12-09 18:05:59] [d41d8cd98f00b204e9800998ecf8427e] [Current]
-   P       [ARIMA Backward Selection] [] [2008-12-16 15:29:54] [74be16979710d4c4e7c6647856088456]
Feedback Forum
2008-12-15 17:37:35 [Gert-Jan Geudens] [reply
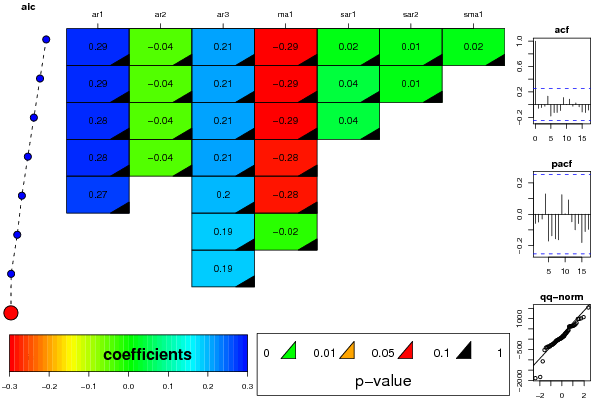
Ons vermoeden uit stap 4 is nu heel duidelijk correct. We hadden daar -mits een beetje goede wil- een AR proces gevonden, maar de p was gelijk aan nul en dus lijkt er toch geen AR proces te zijn. Er was ook geen SAR, MA en SMA.
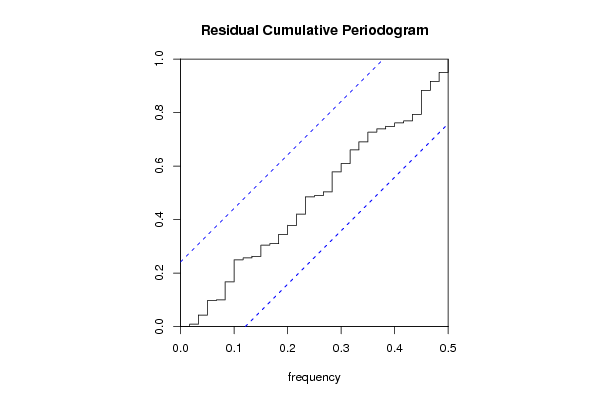
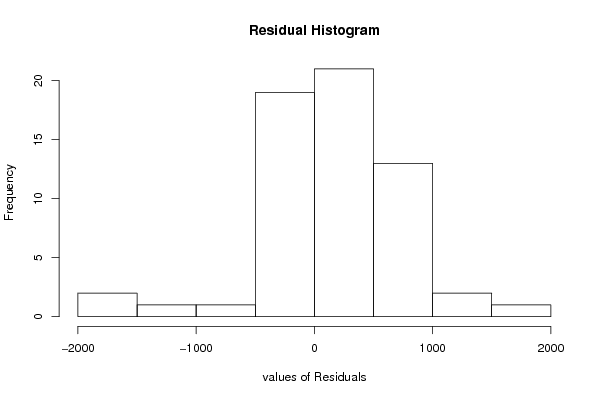
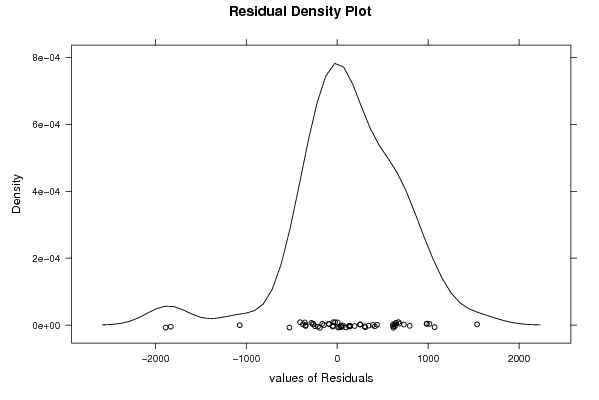
De software is er toch in geslaagd om een AR(3) te vinden. Het driehoekje is wel zwart en dus ligt de p-waarde tussen 0.1 en 1. Deze is dus veel te groot. Ook de software is er dus niet in geslaagd om een gepast SAR, AR, MA en SMA proces te vinden. We kunnen ook aan de residu's zien, dat het model nog niet adequaat is.

Post a new message
Dataseries X:
10709
10662
10570
10297
10635
10872
10296
10383
10431
10574
10653
10805
10872
10625
10407
10463
10556
10646
10702
11353
11346
11451
11964
12574
13031
13812
14544
14931
14886
16005
17064
15168
16050
15839
15137
14954
15648
15305
15579
16348
15928
16171
15937
15713
15594
15683
16438
17032
17696
17745
19394
20148
20108
18584
18441
18391
19178
18079
18483
19644


Summary of computational transaction
Raw Inputview raw input (R code)
Raw Outputview raw output of R engine
Computing time8 seconds
R Server'Sir Ronald Aylmer Fisher' @ 193.190.124.24

\begin{tabular}{lllllllll}
\hline
Summary of computational transaction \tabularnewline
Raw Input & view raw input (R code)  \tabularnewline
Raw Output & view raw output of R engine  \tabularnewline
Computing time & 8 seconds \tabularnewline
R Server & 'Sir Ronald Aylmer Fisher' @ 193.190.124.24 \tabularnewline
\hline
\end{tabular}
%Source: https://freestatistics.org/blog/index.php?pk=31660&T=0

[TABLE]
[ROW][C]Summary of computational transaction[/C][/ROW]
[ROW][C]Raw Input[/C][C]view raw input (R code) [/C][/ROW]
[ROW][C]Raw Output[/C][C]view raw output of R engine [/C][/ROW]
[ROW][C]Computing time[/C][C]8 seconds[/C][/ROW]
[ROW][C]R Server[/C][C]'Sir Ronald Aylmer Fisher' @ 193.190.124.24[/C][/ROW]
[/TABLE]
Source: https://freestatistics.org/blog/index.php?pk=31660&T=0

Globally Unique Identifier (entire table): ba.freestatistics.org/blog/index.php?pk=31660&T=0

As an alternative you can also use a QR Code:  

The GUIDs for individual cells are displayed in the table below:

Summary of computational transaction
Raw Inputview raw input (R code)
Raw Outputview raw output of R engine
Computing time8 seconds
R Server'Sir Ronald Aylmer Fisher' @ 193.190.124.24


ARIMA Parameter Estimation and Backward Selection
Iterationar1ar2ar3ma1sar1sar2sma1
Estimates ( 1 )0.2867-0.0420.2093-0.29240.02150.01390.02
(p-val)(0.4294 )(0.7734 )(0.1156 )(0.4088 )(0.9961 )(0.9554 )(0.9964 )
Estimates ( 2 )0.2867-0.04190.2093-0.29240.04140.0130
(p-val)(0.4293 )(0.7732 )(0.1153 )(0.4086 )(0.7929 )(0.9366 )(NA )
Estimates ( 3 )0.285-0.03760.2094-0.29130.040300
(p-val)(0.4297 )(0.7803 )(0.1154 )(0.4082 )(0.7986 )(NA )(NA )
Estimates ( 4 )0.277-0.03740.2091-0.2781000
(p-val)(0.4497 )(0.7813 )(0.1167 )(0.4348 )(NA )(NA )(NA )
Estimates ( 5 )0.266900.1991-0.278000
(p-val)(0.4526 )(NA )(0.1251 )(0.4374 )(NA )(NA )(NA )
Estimates ( 6 )000.19-0.0209000
(p-val)(NA )(NA )(0.1629 )(0.8778 )(NA )(NA )(NA )
Estimates ( 7 )000.18640000
(p-val)(NA )(NA )(0.1653 )(NA )(NA )(NA )(NA )
Estimates ( 8 )0000000
(p-val)(NA )(NA )(NA )(NA )(NA )(NA )(NA )
Estimates ( 9 )NANANANANANANA
(p-val)(NA )(NA )(NA )(NA )(NA )(NA )(NA )
Estimates ( 10 )NANANANANANANA
(p-val)(NA )(NA )(NA )(NA )(NA )(NA )(NA )
Estimates ( 11 )NANANANANANANA
(p-val)(NA )(NA )(NA )(NA )(NA )(NA )(NA )
Estimates ( 12 )NANANANANANANA
(p-val)(NA )(NA )(NA )(NA )(NA )(NA )(NA )
Estimates ( 13 )NANANANANANANA
(p-val)(NA )(NA )(NA )(NA )(NA )(NA )(NA )

\begin{tabular}{lllllllll}
\hline
ARIMA Parameter Estimation and Backward Selection \tabularnewline
Iteration & ar1 & ar2 & ar3 & ma1 & sar1 & sar2 & sma1 \tabularnewline
Estimates ( 1 ) & 0.2867 & -0.042 & 0.2093 & -0.2924 & 0.0215 & 0.0139 & 0.02 \tabularnewline
(p-val) & (0.4294 ) & (0.7734 ) & (0.1156 ) & (0.4088 ) & (0.9961 ) & (0.9554 ) & (0.9964 ) \tabularnewline
Estimates ( 2 ) & 0.2867 & -0.0419 & 0.2093 & -0.2924 & 0.0414 & 0.013 & 0 \tabularnewline
(p-val) & (0.4293 ) & (0.7732 ) & (0.1153 ) & (0.4086 ) & (0.7929 ) & (0.9366 ) & (NA ) \tabularnewline
Estimates ( 3 ) & 0.285 & -0.0376 & 0.2094 & -0.2913 & 0.0403 & 0 & 0 \tabularnewline
(p-val) & (0.4297 ) & (0.7803 ) & (0.1154 ) & (0.4082 ) & (0.7986 ) & (NA ) & (NA ) \tabularnewline
Estimates ( 4 ) & 0.277 & -0.0374 & 0.2091 & -0.2781 & 0 & 0 & 0 \tabularnewline
(p-val) & (0.4497 ) & (0.7813 ) & (0.1167 ) & (0.4348 ) & (NA ) & (NA ) & (NA ) \tabularnewline
Estimates ( 5 ) & 0.2669 & 0 & 0.1991 & -0.278 & 0 & 0 & 0 \tabularnewline
(p-val) & (0.4526 ) & (NA ) & (0.1251 ) & (0.4374 ) & (NA ) & (NA ) & (NA ) \tabularnewline
Estimates ( 6 ) & 0 & 0 & 0.19 & -0.0209 & 0 & 0 & 0 \tabularnewline
(p-val) & (NA ) & (NA ) & (0.1629 ) & (0.8778 ) & (NA ) & (NA ) & (NA ) \tabularnewline
Estimates ( 7 ) & 0 & 0 & 0.1864 & 0 & 0 & 0 & 0 \tabularnewline
(p-val) & (NA ) & (NA ) & (0.1653 ) & (NA ) & (NA ) & (NA ) & (NA ) \tabularnewline
Estimates ( 8 ) & 0 & 0 & 0 & 0 & 0 & 0 & 0 \tabularnewline
(p-val) & (NA ) & (NA ) & (NA ) & (NA ) & (NA ) & (NA ) & (NA ) \tabularnewline
Estimates ( 9 ) & NA & NA & NA & NA & NA & NA & NA \tabularnewline
(p-val) & (NA ) & (NA ) & (NA ) & (NA ) & (NA ) & (NA ) & (NA ) \tabularnewline
Estimates ( 10 ) & NA & NA & NA & NA & NA & NA & NA \tabularnewline
(p-val) & (NA ) & (NA ) & (NA ) & (NA ) & (NA ) & (NA ) & (NA ) \tabularnewline
Estimates ( 11 ) & NA & NA & NA & NA & NA & NA & NA \tabularnewline
(p-val) & (NA ) & (NA ) & (NA ) & (NA ) & (NA ) & (NA ) & (NA ) \tabularnewline
Estimates ( 12 ) & NA & NA & NA & NA & NA & NA & NA \tabularnewline
(p-val) & (NA ) & (NA ) & (NA ) & (NA ) & (NA ) & (NA ) & (NA ) \tabularnewline
Estimates ( 13 ) & NA & NA & NA & NA & NA & NA & NA \tabularnewline
(p-val) & (NA ) & (NA ) & (NA ) & (NA ) & (NA ) & (NA ) & (NA ) \tabularnewline
\hline
\end{tabular}
%Source: https://freestatistics.org/blog/index.php?pk=31660&T=1

[TABLE]
[ROW][C]ARIMA Parameter Estimation and Backward Selection[/C][/ROW]
[ROW][C]Iteration[/C][C]ar1[/C][C]ar2[/C][C]ar3[/C][C]ma1[/C][C]sar1[/C][C]sar2[/C][C]sma1[/C][/ROW]
[ROW][C]Estimates ( 1 )[/C][C]0.2867[/C][C]-0.042[/C][C]0.2093[/C][C]-0.2924[/C][C]0.0215[/C][C]0.0139[/C][C]0.02[/C][/ROW]
[ROW][C](p-val)[/C][C](0.4294 )[/C][C](0.7734 )[/C][C](0.1156 )[/C][C](0.4088 )[/C][C](0.9961 )[/C][C](0.9554 )[/C][C](0.9964 )[/C][/ROW]
[ROW][C]Estimates ( 2 )[/C][C]0.2867[/C][C]-0.0419[/C][C]0.2093[/C][C]-0.2924[/C][C]0.0414[/C][C]0.013[/C][C]0[/C][/ROW]
[ROW][C](p-val)[/C][C](0.4293 )[/C][C](0.7732 )[/C][C](0.1153 )[/C][C](0.4086 )[/C][C](0.7929 )[/C][C](0.9366 )[/C][C](NA )[/C][/ROW]
[ROW][C]Estimates ( 3 )[/C][C]0.285[/C][C]-0.0376[/C][C]0.2094[/C][C]-0.2913[/C][C]0.0403[/C][C]0[/C][C]0[/C][/ROW]
[ROW][C](p-val)[/C][C](0.4297 )[/C][C](0.7803 )[/C][C](0.1154 )[/C][C](0.4082 )[/C][C](0.7986 )[/C][C](NA )[/C][C](NA )[/C][/ROW]
[ROW][C]Estimates ( 4 )[/C][C]0.277[/C][C]-0.0374[/C][C]0.2091[/C][C]-0.2781[/C][C]0[/C][C]0[/C][C]0[/C][/ROW]
[ROW][C](p-val)[/C][C](0.4497 )[/C][C](0.7813 )[/C][C](0.1167 )[/C][C](0.4348 )[/C][C](NA )[/C][C](NA )[/C][C](NA )[/C][/ROW]
[ROW][C]Estimates ( 5 )[/C][C]0.2669[/C][C]0[/C][C]0.1991[/C][C]-0.278[/C][C]0[/C][C]0[/C][C]0[/C][/ROW]
[ROW][C](p-val)[/C][C](0.4526 )[/C][C](NA )[/C][C](0.1251 )[/C][C](0.4374 )[/C][C](NA )[/C][C](NA )[/C][C](NA )[/C][/ROW]
[ROW][C]Estimates ( 6 )[/C][C]0[/C][C]0[/C][C]0.19[/C][C]-0.0209[/C][C]0[/C][C]0[/C][C]0[/C][/ROW]
[ROW][C](p-val)[/C][C](NA )[/C][C](NA )[/C][C](0.1629 )[/C][C](0.8778 )[/C][C](NA )[/C][C](NA )[/C][C](NA )[/C][/ROW]
[ROW][C]Estimates ( 7 )[/C][C]0[/C][C]0[/C][C]0.1864[/C][C]0[/C][C]0[/C][C]0[/C][C]0[/C][/ROW]
[ROW][C](p-val)[/C][C](NA )[/C][C](NA )[/C][C](0.1653 )[/C][C](NA )[/C][C](NA )[/C][C](NA )[/C][C](NA )[/C][/ROW]
[ROW][C]Estimates ( 8 )[/C][C]0[/C][C]0[/C][C]0[/C][C]0[/C][C]0[/C][C]0[/C][C]0[/C][/ROW]
[ROW][C](p-val)[/C][C](NA )[/C][C](NA )[/C][C](NA )[/C][C](NA )[/C][C](NA )[/C][C](NA )[/C][C](NA )[/C][/ROW]
[ROW][C]Estimates ( 9 )[/C][C]NA[/C][C]NA[/C][C]NA[/C][C]NA[/C][C]NA[/C][C]NA[/C][C]NA[/C][/ROW]
[ROW][C](p-val)[/C][C](NA )[/C][C](NA )[/C][C](NA )[/C][C](NA )[/C][C](NA )[/C][C](NA )[/C][C](NA )[/C][/ROW]
[ROW][C]Estimates ( 10 )[/C][C]NA[/C][C]NA[/C][C]NA[/C][C]NA[/C][C]NA[/C][C]NA[/C][C]NA[/C][/ROW]
[ROW][C](p-val)[/C][C](NA )[/C][C](NA )[/C][C](NA )[/C][C](NA )[/C][C](NA )[/C][C](NA )[/C][C](NA )[/C][/ROW]
[ROW][C]Estimates ( 11 )[/C][C]NA[/C][C]NA[/C][C]NA[/C][C]NA[/C][C]NA[/C][C]NA[/C][C]NA[/C][/ROW]
[ROW][C](p-val)[/C][C](NA )[/C][C](NA )[/C][C](NA )[/C][C](NA )[/C][C](NA )[/C][C](NA )[/C][C](NA )[/C][/ROW]
[ROW][C]Estimates ( 12 )[/C][C]NA[/C][C]NA[/C][C]NA[/C][C]NA[/C][C]NA[/C][C]NA[/C][C]NA[/C][/ROW]
[ROW][C](p-val)[/C][C](NA )[/C][C](NA )[/C][C](NA )[/C][C](NA )[/C][C](NA )[/C][C](NA )[/C][C](NA )[/C][/ROW]
[ROW][C]Estimates ( 13 )[/C][C]NA[/C][C]NA[/C][C]NA[/C][C]NA[/C][C]NA[/C][C]NA[/C][C]NA[/C][/ROW]
[ROW][C](p-val)[/C][C](NA )[/C][C](NA )[/C][C](NA )[/C][C](NA )[/C][C](NA )[/C][C](NA )[/C][C](NA )[/C][/ROW]
[/TABLE]
Source: https://freestatistics.org/blog/index.php?pk=31660&T=1

Globally Unique Identifier (entire table): ba.freestatistics.org/blog/index.php?pk=31660&T=1

As an alternative you can also use a QR Code:  

The GUIDs for individual cells are displayed in the table below:

ARIMA Parameter Estimation and Backward Selection
Iterationar1ar2ar3ma1sar1sar2sma1
Estimates ( 1 )0.2867-0.0420.2093-0.29240.02150.01390.02
(p-val)(0.4294 )(0.7734 )(0.1156 )(0.4088 )(0.9961 )(0.9554 )(0.9964 )
Estimates ( 2 )0.2867-0.04190.2093-0.29240.04140.0130
(p-val)(0.4293 )(0.7732 )(0.1153 )(0.4086 )(0.7929 )(0.9366 )(NA )
Estimates ( 3 )0.285-0.03760.2094-0.29130.040300
(p-val)(0.4297 )(0.7803 )(0.1154 )(0.4082 )(0.7986 )(NA )(NA )
Estimates ( 4 )0.277-0.03740.2091-0.2781000
(p-val)(0.4497 )(0.7813 )(0.1167 )(0.4348 )(NA )(NA )(NA )
Estimates ( 5 )0.266900.1991-0.278000
(p-val)(0.4526 )(NA )(0.1251 )(0.4374 )(NA )(NA )(NA )
Estimates ( 6 )000.19-0.0209000
(p-val)(NA )(NA )(0.1629 )(0.8778 )(NA )(NA )(NA )
Estimates ( 7 )000.18640000
(p-val)(NA )(NA )(0.1653 )(NA )(NA )(NA )(NA )
Estimates ( 8 )0000000
(p-val)(NA )(NA )(NA )(NA )(NA )(NA )(NA )
Estimates ( 9 )NANANANANANANA
(p-val)(NA )(NA )(NA )(NA )(NA )(NA )(NA )
Estimates ( 10 )NANANANANANANA
(p-val)(NA )(NA )(NA )(NA )(NA )(NA )(NA )
Estimates ( 11 )NANANANANANANA
(p-val)(NA )(NA )(NA )(NA )(NA )(NA )(NA )
Estimates ( 12 )NANANANANANANA
(p-val)(NA )(NA )(NA )(NA )(NA )(NA )(NA )
Estimates ( 13 )NANANANANANANA
(p-val)(NA )(NA )(NA )(NA )(NA )(NA )(NA )


Estimated ARIMA Residuals
Value
10.7089944527796
-46.17633279093
-90.3877152503308
-268.217756771997
346.760495989458
254.148204915533
-525.114565848473
23.998986288585
3.82473298933292
250.362674253773
62.7837627429199
143.053110478852
40.3457249682469
-261.725089003556
-246.331816816968
43.511633376731
139.039202327573
130.633789908547
45.5619622253271
633.665401552777
-23.7754178521518
94.561962225327
391.657810869434
611.304754721834
437.42867917249
685.380118242734
618.299945668748
301.818156017405
-190.573348250342
982.559934802497
986.865703235748
-1887.61229107392
673.425638038243
-408.390750060322
-348.597863914665
-347.39909495109
733.329035186713
-212.151740753216
308.110016299375
639.64288900674
-356.067018630132
191.928172316782
-377.336625870053
-145.714716689958
-164.293628200810
132.616086415595
796.752151098688
616.18083027118
647.410975679537
-91.7271164263875
1538.28224217580
630.234694957457
-49.1332830528372
-1831.36293375776
-283.540722894697
-42.5442587323778
1071.06374229644
-1072.34572496825
413.319676584528
1014.30829055951

\begin{tabular}{lllllllll}
\hline
Estimated ARIMA Residuals \tabularnewline
Value \tabularnewline
10.7089944527796 \tabularnewline
-46.17633279093 \tabularnewline
-90.3877152503308 \tabularnewline
-268.217756771997 \tabularnewline
346.760495989458 \tabularnewline
254.148204915533 \tabularnewline
-525.114565848473 \tabularnewline
23.998986288585 \tabularnewline
3.82473298933292 \tabularnewline
250.362674253773 \tabularnewline
62.7837627429199 \tabularnewline
143.053110478852 \tabularnewline
40.3457249682469 \tabularnewline
-261.725089003556 \tabularnewline
-246.331816816968 \tabularnewline
43.511633376731 \tabularnewline
139.039202327573 \tabularnewline
130.633789908547 \tabularnewline
45.5619622253271 \tabularnewline
633.665401552777 \tabularnewline
-23.7754178521518 \tabularnewline
94.561962225327 \tabularnewline
391.657810869434 \tabularnewline
611.304754721834 \tabularnewline
437.42867917249 \tabularnewline
685.380118242734 \tabularnewline
618.299945668748 \tabularnewline
301.818156017405 \tabularnewline
-190.573348250342 \tabularnewline
982.559934802497 \tabularnewline
986.865703235748 \tabularnewline
-1887.61229107392 \tabularnewline
673.425638038243 \tabularnewline
-408.390750060322 \tabularnewline
-348.597863914665 \tabularnewline
-347.39909495109 \tabularnewline
733.329035186713 \tabularnewline
-212.151740753216 \tabularnewline
308.110016299375 \tabularnewline
639.64288900674 \tabularnewline
-356.067018630132 \tabularnewline
191.928172316782 \tabularnewline
-377.336625870053 \tabularnewline
-145.714716689958 \tabularnewline
-164.293628200810 \tabularnewline
132.616086415595 \tabularnewline
796.752151098688 \tabularnewline
616.18083027118 \tabularnewline
647.410975679537 \tabularnewline
-91.7271164263875 \tabularnewline
1538.28224217580 \tabularnewline
630.234694957457 \tabularnewline
-49.1332830528372 \tabularnewline
-1831.36293375776 \tabularnewline
-283.540722894697 \tabularnewline
-42.5442587323778 \tabularnewline
1071.06374229644 \tabularnewline
-1072.34572496825 \tabularnewline
413.319676584528 \tabularnewline
1014.30829055951 \tabularnewline
\hline
\end{tabular}
%Source: https://freestatistics.org/blog/index.php?pk=31660&T=2

[TABLE]
[ROW][C]Estimated ARIMA Residuals[/C][/ROW]
[ROW][C]Value[/C][/ROW]
[ROW][C]10.7089944527796[/C][/ROW]
[ROW][C]-46.17633279093[/C][/ROW]
[ROW][C]-90.3877152503308[/C][/ROW]
[ROW][C]-268.217756771997[/C][/ROW]
[ROW][C]346.760495989458[/C][/ROW]
[ROW][C]254.148204915533[/C][/ROW]
[ROW][C]-525.114565848473[/C][/ROW]
[ROW][C]23.998986288585[/C][/ROW]
[ROW][C]3.82473298933292[/C][/ROW]
[ROW][C]250.362674253773[/C][/ROW]
[ROW][C]62.7837627429199[/C][/ROW]
[ROW][C]143.053110478852[/C][/ROW]
[ROW][C]40.3457249682469[/C][/ROW]
[ROW][C]-261.725089003556[/C][/ROW]
[ROW][C]-246.331816816968[/C][/ROW]
[ROW][C]43.511633376731[/C][/ROW]
[ROW][C]139.039202327573[/C][/ROW]
[ROW][C]130.633789908547[/C][/ROW]
[ROW][C]45.5619622253271[/C][/ROW]
[ROW][C]633.665401552777[/C][/ROW]
[ROW][C]-23.7754178521518[/C][/ROW]
[ROW][C]94.561962225327[/C][/ROW]
[ROW][C]391.657810869434[/C][/ROW]
[ROW][C]611.304754721834[/C][/ROW]
[ROW][C]437.42867917249[/C][/ROW]
[ROW][C]685.380118242734[/C][/ROW]
[ROW][C]618.299945668748[/C][/ROW]
[ROW][C]301.818156017405[/C][/ROW]
[ROW][C]-190.573348250342[/C][/ROW]
[ROW][C]982.559934802497[/C][/ROW]
[ROW][C]986.865703235748[/C][/ROW]
[ROW][C]-1887.61229107392[/C][/ROW]
[ROW][C]673.425638038243[/C][/ROW]
[ROW][C]-408.390750060322[/C][/ROW]
[ROW][C]-348.597863914665[/C][/ROW]
[ROW][C]-347.39909495109[/C][/ROW]
[ROW][C]733.329035186713[/C][/ROW]
[ROW][C]-212.151740753216[/C][/ROW]
[ROW][C]308.110016299375[/C][/ROW]
[ROW][C]639.64288900674[/C][/ROW]
[ROW][C]-356.067018630132[/C][/ROW]
[ROW][C]191.928172316782[/C][/ROW]
[ROW][C]-377.336625870053[/C][/ROW]
[ROW][C]-145.714716689958[/C][/ROW]
[ROW][C]-164.293628200810[/C][/ROW]
[ROW][C]132.616086415595[/C][/ROW]
[ROW][C]796.752151098688[/C][/ROW]
[ROW][C]616.18083027118[/C][/ROW]
[ROW][C]647.410975679537[/C][/ROW]
[ROW][C]-91.7271164263875[/C][/ROW]
[ROW][C]1538.28224217580[/C][/ROW]
[ROW][C]630.234694957457[/C][/ROW]
[ROW][C]-49.1332830528372[/C][/ROW]
[ROW][C]-1831.36293375776[/C][/ROW]
[ROW][C]-283.540722894697[/C][/ROW]
[ROW][C]-42.5442587323778[/C][/ROW]
[ROW][C]1071.06374229644[/C][/ROW]
[ROW][C]-1072.34572496825[/C][/ROW]
[ROW][C]413.319676584528[/C][/ROW]
[ROW][C]1014.30829055951[/C][/ROW]
[/TABLE]
Source: https://freestatistics.org/blog/index.php?pk=31660&T=2

Globally Unique Identifier (entire table): ba.freestatistics.org/blog/index.php?pk=31660&T=2

As an alternative you can also use a QR Code:  

The GUIDs for individual cells are displayed in the table below:

Estimated ARIMA Residuals
Value
10.7089944527796
-46.17633279093
-90.3877152503308
-268.217756771997
346.760495989458
254.148204915533
-525.114565848473
23.998986288585
3.82473298933292
250.362674253773
62.7837627429199
143.053110478852
40.3457249682469
-261.725089003556
-246.331816816968
43.511633376731
139.039202327573
130.633789908547
45.5619622253271
633.665401552777
-23.7754178521518
94.561962225327
391.657810869434
611.304754721834
437.42867917249
685.380118242734
618.299945668748
301.818156017405
-190.573348250342
982.559934802497
986.865703235748
-1887.61229107392
673.425638038243
-408.390750060322
-348.597863914665
-347.39909495109
733.329035186713
-212.151740753216
308.110016299375
639.64288900674
-356.067018630132
191.928172316782
-377.336625870053
-145.714716689958
-164.293628200810
132.616086415595
796.752151098688
616.18083027118
647.410975679537
-91.7271164263875
1538.28224217580
630.234694957457
-49.1332830528372
-1831.36293375776
-283.540722894697
-42.5442587323778
1071.06374229644
-1072.34572496825
413.319676584528
1014.30829055951


Parameters (Session):
par1 = FALSE ; par2 = 1 ; par3 = 1 ; par4 = 0 ; par5 = 12 ; par6 = 3 ; par7 = 1 ; par8 = 2 ; par9 = 1 ;
Parameters (R input):
par1 = FALSE ; par2 = 1 ; par3 = 1 ; par4 = 0 ; par5 = 12 ; par6 = 3 ; par7 = 1 ; par8 = 2 ; par9 = 1 ;
R code (references can be found in the software module):
library(lattice)
if (par1 == 'TRUE') par1 <- TRUE
if (par1 == 'FALSE') par1 <- FALSE
par2 <- as.numeric(par2) #Box-Cox lambda transformation parameter
par3 <- as.numeric(par3) #degree of non-seasonal differencing
par4 <- as.numeric(par4) #degree of seasonal differencing
par5 <- as.numeric(par5) #seasonal period
par6 <- as.numeric(par6) #degree (p) of the non-seasonal AR(p) polynomial
par7 <- as.numeric(par7) #degree (q) of the non-seasonal MA(q) polynomial
par8 <- as.numeric(par8) #degree (P) of the seasonal AR(P) polynomial
par9 <- as.numeric(par9) #degree (Q) of the seasonal MA(Q) polynomial
armaGR <- function(arima.out, names, n){
try1 <- arima.out$coef
try2 <- sqrt(diag(arima.out$var.coef))
try.data.frame <- data.frame(matrix(NA,ncol=4,nrow=length(names)))
dimnames(try.data.frame) <- list(names,c('coef','std','tstat','pv'))
try.data.frame[,1] <- try1
for(i in 1:length(try2)) try.data.frame[which(rownames(try.data.frame)==names(try2)[i]),2] <- try2[i]
try.data.frame[,3] <- try.data.frame[,1] / try.data.frame[,2]
try.data.frame[,4] <- round((1-pt(abs(try.data.frame[,3]),df=n-(length(try2)+1)))*2,5)
vector <- rep(NA,length(names))
vector[is.na(try.data.frame[,4])] <- 0
maxi <- which.max(try.data.frame[,4])
continue <- max(try.data.frame[,4],na.rm=TRUE) > .05
vector[maxi] <- 0
list(summary=try.data.frame,next.vector=vector,continue=continue)
}
arimaSelect <- function(series, order=c(13,0,0), seasonal=list(order=c(2,0,0),period=12), include.mean=F){
nrc <- order[1]+order[3]+seasonal$order[1]+seasonal$order[3]
coeff <- matrix(NA, nrow=nrc*2, ncol=nrc)
pval <- matrix(NA, nrow=nrc*2, ncol=nrc)
mylist <- rep(list(NULL), nrc)
names <- NULL
if(order[1] > 0) names <- paste('ar',1:order[1],sep='')
if(order[3] > 0) names <- c( names , paste('ma',1:order[3],sep='') )
if(seasonal$order[1] > 0) names <- c(names, paste('sar',1:seasonal$order[1],sep=''))
if(seasonal$order[3] > 0) names <- c(names, paste('sma',1:seasonal$order[3],sep=''))
arima.out <- arima(series, order=order, seasonal=seasonal, include.mean=include.mean, method='ML')
mylist[[1]] <- arima.out
last.arma <- armaGR(arima.out, names, length(series))
mystop <- FALSE
i <- 1
coeff[i,] <- last.arma[[1]][,1]
pval [i,] <- last.arma[[1]][,4]
i <- 2
aic <- arima.out$aic
while(!mystop){
mylist[[i]] <- arima.out
arima.out <- arima(series, order=order, seasonal=seasonal, include.mean=include.mean, method='ML', fixed=last.arma$next.vector)
aic <- c(aic, arima.out$aic)
last.arma <- armaGR(arima.out, names, length(series))
mystop <- !last.arma$continue
coeff[i,] <- last.arma[[1]][,1]
pval [i,] <- last.arma[[1]][,4]
i <- i+1
}
list(coeff, pval, mylist, aic=aic)
}
arimaSelectplot <- function(arimaSelect.out,noms,choix){
noms <- names(arimaSelect.out[[3]][[1]]$coef)
coeff <- arimaSelect.out[[1]]
k <- min(which(is.na(coeff[,1])))-1
coeff <- coeff[1:k,]
pval <- arimaSelect.out[[2]][1:k,]
aic <- arimaSelect.out$aic[1:k]
coeff[coeff==0] <- NA
n <- ncol(coeff)
if(missing(choix)) choix <- k
layout(matrix(c(1,1,1,2,
3,3,3,2,
3,3,3,4,
5,6,7,7),nr=4),
widths=c(10,35,45,15),
heights=c(30,30,15,15))
couleurs <- rainbow(75)[1:50]#(50)
ticks <- pretty(coeff)
par(mar=c(1,1,3,1))
plot(aic,k:1-.5,type='o',pch=21,bg='blue',cex=2,axes=F,lty=2,xpd=NA)
points(aic[choix],k-choix+.5,pch=21,cex=4,bg=2,xpd=NA)
title('aic',line=2)
par(mar=c(3,0,0,0))
plot(0,axes=F,xlab='',ylab='',xlim=range(ticks),ylim=c(.1,1))
rect(xleft = min(ticks) + (0:49)/50*(max(ticks)-min(ticks)),
xright = min(ticks) + (1:50)/50*(max(ticks)-min(ticks)),
ytop = rep(1,50),
ybottom= rep(0,50),col=couleurs,border=NA)
axis(1,ticks)
rect(xleft=min(ticks),xright=max(ticks),ytop=1,ybottom=0)
text(mean(coeff,na.rm=T),.5,'coefficients',cex=2,font=2)
par(mar=c(1,1,3,1))
image(1:n,1:k,t(coeff[k:1,]),axes=F,col=couleurs,zlim=range(ticks))
for(i in 1:n) for(j in 1:k) if(!is.na(coeff[j,i])) {
if(pval[j,i]<.01) symb = 'green'
else if( (pval[j,i]<.05) & (pval[j,i]>=.01)) symb = 'orange'
else if( (pval[j,i]<.1) & (pval[j,i]>=.05)) symb = 'red'
else symb = 'black'
polygon(c(i+.5 ,i+.2 ,i+.5 ,i+.5),
c(k-j+0.5,k-j+0.5,k-j+0.8,k-j+0.5),
col=symb)
if(j==choix) {
rect(xleft=i-.5,
xright=i+.5,
ybottom=k-j+1.5,
ytop=k-j+.5,
lwd=4)
text(i,
k-j+1,
round(coeff[j,i],2),
cex=1.2,
font=2)
}
else{
rect(xleft=i-.5,xright=i+.5,ybottom=k-j+1.5,ytop=k-j+.5)
text(i,k-j+1,round(coeff[j,i],2),cex=1.2,font=1)
}
}
axis(3,1:n,noms)
par(mar=c(0.5,0,0,0.5))
plot(0,axes=F,xlab='',ylab='',type='n',xlim=c(0,8),ylim=c(-.2,.8))
cols <- c('green','orange','red','black')
niv <- c('0','0.01','0.05','0.1')
for(i in 0:3){
polygon(c(1+2*i ,1+2*i ,1+2*i-.5 ,1+2*i),
c(.4 ,.7 , .4 , .4),
col=cols[i+1])
text(2*i,0.5,niv[i+1],cex=1.5)
}
text(8,.5,1,cex=1.5)
text(4,0,'p-value',cex=2)
box()
residus <- arimaSelect.out[[3]][[choix]]$res
par(mar=c(1,2,4,1))
acf(residus,main='')
title('acf',line=.5)
par(mar=c(1,2,4,1))
pacf(residus,main='')
title('pacf',line=.5)
par(mar=c(2,2,4,1))
qqnorm(residus,main='')
title('qq-norm',line=.5)
qqline(residus)
residus
}
if (par2 == 0) x <- log(x)
if (par2 != 0) x <- x^par2
(selection <- arimaSelect(x, order=c(par6,par3,par7), seasonal=list(order=c(par8,par4,par9), period=par5)))
bitmap(file='test1.png')
resid <- arimaSelectplot(selection)
dev.off()
resid
bitmap(file='test2.png')
acf(resid,length(resid)/2, main='Residual Autocorrelation Function')
dev.off()
bitmap(file='test3.png')
pacf(resid,length(resid)/2, main='Residual Partial Autocorrelation Function')
dev.off()
bitmap(file='test4.png')
cpgram(resid, main='Residual Cumulative Periodogram')
dev.off()
bitmap(file='test5.png')
hist(resid, main='Residual Histogram', xlab='values of Residuals')
dev.off()
bitmap(file='test6.png')
densityplot(~resid,col='black',main='Residual Density Plot', xlab='values of Residuals')
dev.off()
bitmap(file='test7.png')
qqnorm(resid, main='Residual Normal Q-Q Plot')
qqline(resid)
dev.off()
ncols <- length(selection[[1]][1,])
nrows <- length(selection[[2]][,1])-1
load(file='createtable')
a<-table.start()
a<-table.row.start(a)
a<-table.element(a,'ARIMA Parameter Estimation and Backward Selection', ncols+1,TRUE)
a<-table.row.end(a)
a<-table.row.start(a)
a<-table.element(a,'Iteration', header=TRUE)
for (i in 1:ncols) {
a<-table.element(a,names(selection[[3]][[1]]$coef)[i],header=TRUE)
}
a<-table.row.end(a)
for (j in 1:nrows) {
a<-table.row.start(a)
mydum <- 'Estimates ('
mydum <- paste(mydum,j)
mydum <- paste(mydum,')')
a<-table.element(a,mydum, header=TRUE)
for (i in 1:ncols) {
a<-table.element(a,round(selection[[1]][j,i],4))
}
a<-table.row.end(a)
a<-table.row.start(a)
a<-table.element(a,'(p-val)', header=TRUE)
for (i in 1:ncols) {
mydum <- '('
mydum <- paste(mydum,round(selection[[2]][j,i],4),sep='')
mydum <- paste(mydum,')')
a<-table.element(a,mydum)
}
a<-table.row.end(a)
}
a<-table.end(a)
table.save(a,file='mytable.tab')
a<-table.start()
a<-table.row.start(a)
a<-table.element(a,'Estimated ARIMA Residuals', 1,TRUE)
a<-table.row.end(a)
a<-table.row.start(a)
a<-table.element(a,'Value', 1,TRUE)
a<-table.row.end(a)
for (i in (par4*par5+par3):length(resid)) {
a<-table.row.start(a)
a<-table.element(a,resid[i])
a<-table.row.end(a)
}
a<-table.end(a)
table.save(a,file='mytable1.tab')