Free Statistics

of Irreproducible Research!

Author's title

Author*Unverified author*
R Software Modulerwasp_arimabackwardselection.wasp
Title produced by softwareARIMA Backward Selection
Date of computationTue, 09 Dec 2008 08:38:56 -0700
Cite this page as followsStatistical Computations at FreeStatistics.org, Office for Research Development and Education, URL https://freestatistics.org/blog/index.php?v=date/2008/Dec/09/t1228837460bt2czpbwp4fwm2x.htm/, Retrieved Tue, 14 May 2024 16:41:42 +0000
Statistical Computations at FreeStatistics.org, Office for Research Development and Education, URL https://freestatistics.org/blog/index.php?pk=31529, Retrieved Tue, 14 May 2024 16:41:42 +0000
QR Codes:

Original text written by user:
IsPrivate?No (this computation is public)
User-defined keywords
Estimated Impact190
Family? (F = Feedback message, R = changed R code, M = changed R Module, P = changed Parameters, D = changed Data)
-     [ARIMA Backward Selection] [ARIMA Backward Se...] [2008-12-05 14:57:10] [74be16979710d4c4e7c6647856088456]
F   PD    [ARIMA Backward Selection] [ARIMA Backward Se...] [2008-12-09 15:38:56] [d41d8cd98f00b204e9800998ecf8427e] [Current]
-  MPD      [ARIMA Backward Selection] [paper arima backw...] [2010-12-25 14:04:20] [df61ce38492c371f14c407a12b3bb2eb]
-   PD        [ARIMA Backward Selection] [ARIMA Backward se...] [2010-12-26 11:54:47] [c4f608d390ad7371b1365a9b84541edb]
-    D        [ARIMA Backward Selection] [ARIMA Backward se...] [2010-12-28 10:15:06] [c4f608d390ad7371b1365a9b84541edb]
-    D        [ARIMA Backward Selection] [ARIMA backward se...] [2010-12-29 20:00:31] [7c2d060fd17a41a80970d273bf259e67]
-             [ARIMA Backward Selection] [] [2010-12-29 20:11:48] [a2638725f7f7c6bd63902ba17eba666b]
-   PD        [ARIMA Backward Selection] [arima] [2011-12-22 17:31:51] [a2638725f7f7c6bd63902ba17eba666b]
Feedback Forum
2008-12-13 12:54:58 [Maarten Van Gucht] [reply
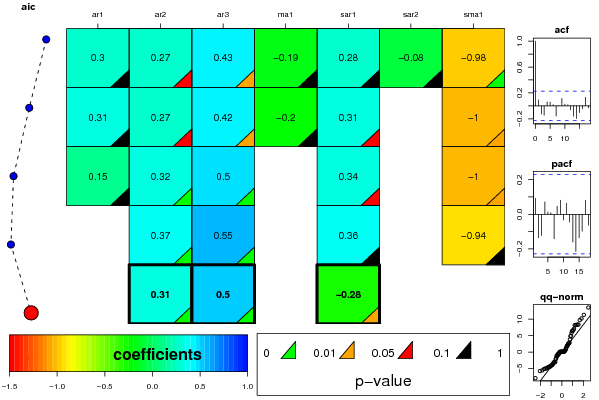
de eerdere uitleg over deze software heb ik uitvoerig besproken in de ARIMA backward selection met de unemployment data. de student heeft door deze software kunnen nakijken of de voorspelde analyses ook kloppen. er is inderdaad een AR(2) en AR(3) proces aanwezig, maar geen AR(1) prcoes. de SAR(1) proces zoals de student eerder had beschreven is wel degelijk aanwezig, maar de SMA(1) proces is niet aanwezig. de p-waarde was te groot.

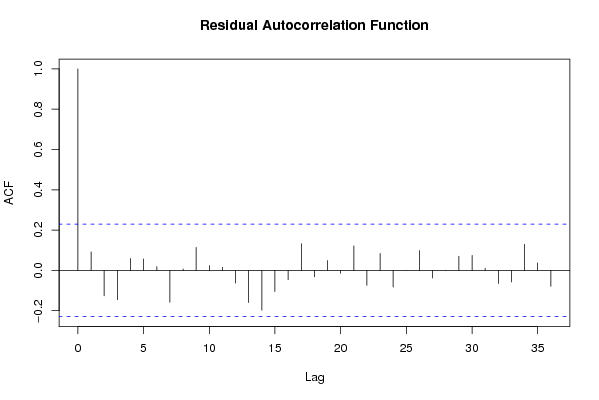
in de acf en pacf van de residuen kun je zien dat geen enkele lijn buiten het betrouwbaarheidsinterval ligt, er is dus een zeer grote betrouwbaarheid. Dit is een indicatie van het feit dat de tijdreeks toch wel goed stationair is gemaakt.

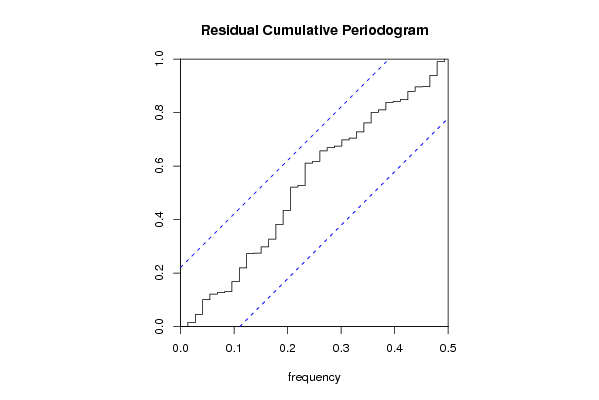
bij de residuele cumulatieve grafiek zien we dat ze volledig binnen het betrouwbaarheidsinterval ligt, maar er nog steeds een kleine aanwezigheid is van seizoenaliteit.

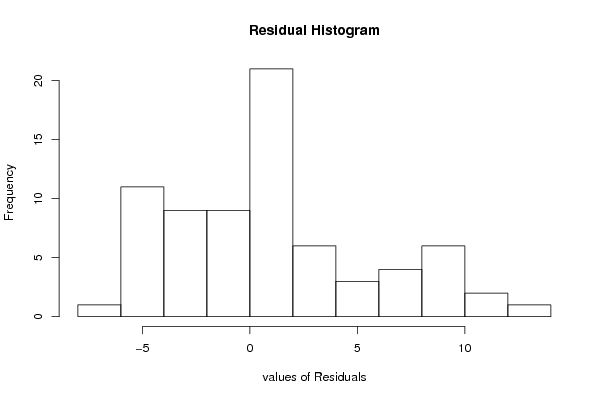
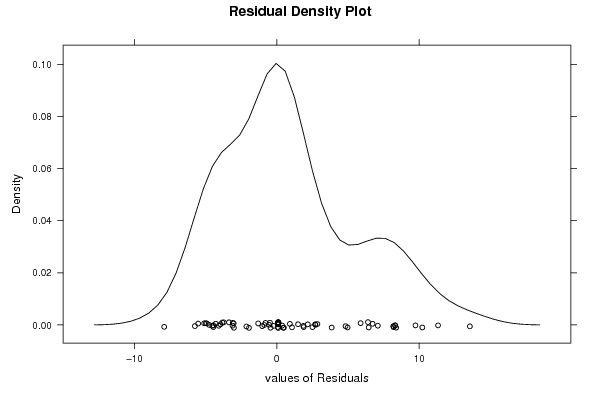
Het histogram en de density plot van de Residu’s zouden normaal verdeeld moeten zijn. hier kan je dat zoals de student ook vermeld wel in herkennen, maar toch niet optimaal.

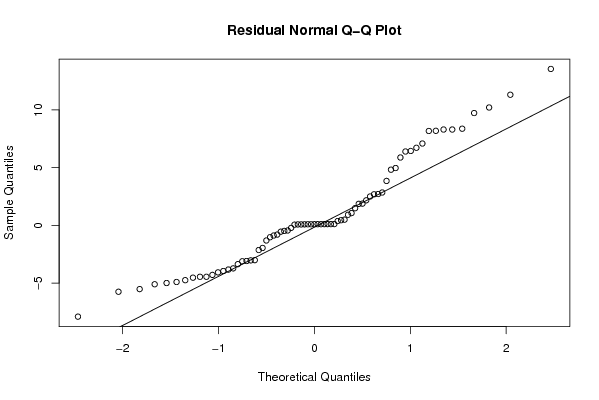
zoals de student het ook vermeld : Ook de Normal Q-Q plot van de Residu’s is niet optimaal gelegen rond de regressierechte en vertoont vooral inconsistentie aan de staarten.

de student heeft deze taak 5 tot een goed einde gebracht en heeft de zaak begrepen. zeer goede conclusies en berekeningen gegeven

Post a new message
Dataseries X:
92
95.9
108.8
103.4
102.1
110.1
83.2
82.7
106.8
113.7
102.5
96.6
92.1
95.6
102.3
98.6
98.2
104.5
84
73.8
103.9
106
97.2
102.6
89
93.8
116.7
106.8
98.5
118.7
90
91.9
113.3
113.1
104.1
108.7
96.7
101
116.9
105.8
99
129.4
83
88.9
115.9
104.2
113.4
112.2
100.8
107.3
126.6
102.9
117.9
128.8
87.5
93.8
122.7
126.2
124.6
116.7
115.2
111.1
129.9
113.3
118.5
137.9
103.6
101.7
127.4
137.5
128.3
118.2
117.1


Summary of computational transaction
Raw Inputview raw input (R code)
Raw Outputview raw output of R engine
Computing time12 seconds
R Server'George Udny Yule' @ 72.249.76.132

\begin{tabular}{lllllllll}
\hline
Summary of computational transaction \tabularnewline
Raw Input & view raw input (R code)  \tabularnewline
Raw Output & view raw output of R engine  \tabularnewline
Computing time & 12 seconds \tabularnewline
R Server & 'George Udny Yule' @ 72.249.76.132 \tabularnewline
\hline
\end{tabular}
%Source: https://freestatistics.org/blog/index.php?pk=31529&T=0

[TABLE]
[ROW][C]Summary of computational transaction[/C][/ROW]
[ROW][C]Raw Input[/C][C]view raw input (R code) [/C][/ROW]
[ROW][C]Raw Output[/C][C]view raw output of R engine [/C][/ROW]
[ROW][C]Computing time[/C][C]12 seconds[/C][/ROW]
[ROW][C]R Server[/C][C]'George Udny Yule' @ 72.249.76.132[/C][/ROW]
[/TABLE]
Source: https://freestatistics.org/blog/index.php?pk=31529&T=0

Globally Unique Identifier (entire table): ba.freestatistics.org/blog/index.php?pk=31529&T=0

As an alternative you can also use a QR Code:  

The GUIDs for individual cells are displayed in the table below:

Summary of computational transaction
Raw Inputview raw input (R code)
Raw Outputview raw output of R engine
Computing time12 seconds
R Server'George Udny Yule' @ 72.249.76.132


ARIMA Parameter Estimation and Backward Selection
Iterationar1ar2ar3ma1sar1sar2sma1
Estimates ( 1 )0.29960.27190.427-0.18630.2841-0.0796-0.977
(p-val)(0.2976 )(0.0859 )(0.0316 )(0.5892 )(0.1161 )(0.6712 )(0.0026 )
Estimates ( 2 )0.30630.26550.4239-0.20420.30860-1.0002
(p-val)(0.3168 )(0.0794 )(0.0305 )(0.5573 )(0.0853 )(NA )(0.011 )
Estimates ( 3 )0.14680.32060.495600.33950-1.0001
(p-val)(0.193 )(0.0042 )(1e-04 )(NA )(0.0544 )(NA )(0.0268 )
Estimates ( 4 )00.37280.553300.35910-0.9359
(p-val)(NA )(7e-04 )(0 )(NA )(0.1452 )(NA )(0.1815 )
Estimates ( 5 )00.31360.5040-0.281400
(p-val)(NA )(0.0025 )(0 )(NA )(0.0274 )(NA )(NA )
Estimates ( 6 )NANANANANANANA
(p-val)(NA )(NA )(NA )(NA )(NA )(NA )(NA )
Estimates ( 7 )NANANANANANANA
(p-val)(NA )(NA )(NA )(NA )(NA )(NA )(NA )
Estimates ( 8 )NANANANANANANA
(p-val)(NA )(NA )(NA )(NA )(NA )(NA )(NA )
Estimates ( 9 )NANANANANANANA
(p-val)(NA )(NA )(NA )(NA )(NA )(NA )(NA )
Estimates ( 10 )NANANANANANANA
(p-val)(NA )(NA )(NA )(NA )(NA )(NA )(NA )
Estimates ( 11 )NANANANANANANA
(p-val)(NA )(NA )(NA )(NA )(NA )(NA )(NA )
Estimates ( 12 )NANANANANANANA
(p-val)(NA )(NA )(NA )(NA )(NA )(NA )(NA )
Estimates ( 13 )NANANANANANANA
(p-val)(NA )(NA )(NA )(NA )(NA )(NA )(NA )

\begin{tabular}{lllllllll}
\hline
ARIMA Parameter Estimation and Backward Selection \tabularnewline
Iteration & ar1 & ar2 & ar3 & ma1 & sar1 & sar2 & sma1 \tabularnewline
Estimates ( 1 ) & 0.2996 & 0.2719 & 0.427 & -0.1863 & 0.2841 & -0.0796 & -0.977 \tabularnewline
(p-val) & (0.2976 ) & (0.0859 ) & (0.0316 ) & (0.5892 ) & (0.1161 ) & (0.6712 ) & (0.0026 ) \tabularnewline
Estimates ( 2 ) & 0.3063 & 0.2655 & 0.4239 & -0.2042 & 0.3086 & 0 & -1.0002 \tabularnewline
(p-val) & (0.3168 ) & (0.0794 ) & (0.0305 ) & (0.5573 ) & (0.0853 ) & (NA ) & (0.011 ) \tabularnewline
Estimates ( 3 ) & 0.1468 & 0.3206 & 0.4956 & 0 & 0.3395 & 0 & -1.0001 \tabularnewline
(p-val) & (0.193 ) & (0.0042 ) & (1e-04 ) & (NA ) & (0.0544 ) & (NA ) & (0.0268 ) \tabularnewline
Estimates ( 4 ) & 0 & 0.3728 & 0.5533 & 0 & 0.3591 & 0 & -0.9359 \tabularnewline
(p-val) & (NA ) & (7e-04 ) & (0 ) & (NA ) & (0.1452 ) & (NA ) & (0.1815 ) \tabularnewline
Estimates ( 5 ) & 0 & 0.3136 & 0.504 & 0 & -0.2814 & 0 & 0 \tabularnewline
(p-val) & (NA ) & (0.0025 ) & (0 ) & (NA ) & (0.0274 ) & (NA ) & (NA ) \tabularnewline
Estimates ( 6 ) & NA & NA & NA & NA & NA & NA & NA \tabularnewline
(p-val) & (NA ) & (NA ) & (NA ) & (NA ) & (NA ) & (NA ) & (NA ) \tabularnewline
Estimates ( 7 ) & NA & NA & NA & NA & NA & NA & NA \tabularnewline
(p-val) & (NA ) & (NA ) & (NA ) & (NA ) & (NA ) & (NA ) & (NA ) \tabularnewline
Estimates ( 8 ) & NA & NA & NA & NA & NA & NA & NA \tabularnewline
(p-val) & (NA ) & (NA ) & (NA ) & (NA ) & (NA ) & (NA ) & (NA ) \tabularnewline
Estimates ( 9 ) & NA & NA & NA & NA & NA & NA & NA \tabularnewline
(p-val) & (NA ) & (NA ) & (NA ) & (NA ) & (NA ) & (NA ) & (NA ) \tabularnewline
Estimates ( 10 ) & NA & NA & NA & NA & NA & NA & NA \tabularnewline
(p-val) & (NA ) & (NA ) & (NA ) & (NA ) & (NA ) & (NA ) & (NA ) \tabularnewline
Estimates ( 11 ) & NA & NA & NA & NA & NA & NA & NA \tabularnewline
(p-val) & (NA ) & (NA ) & (NA ) & (NA ) & (NA ) & (NA ) & (NA ) \tabularnewline
Estimates ( 12 ) & NA & NA & NA & NA & NA & NA & NA \tabularnewline
(p-val) & (NA ) & (NA ) & (NA ) & (NA ) & (NA ) & (NA ) & (NA ) \tabularnewline
Estimates ( 13 ) & NA & NA & NA & NA & NA & NA & NA \tabularnewline
(p-val) & (NA ) & (NA ) & (NA ) & (NA ) & (NA ) & (NA ) & (NA ) \tabularnewline
\hline
\end{tabular}
%Source: https://freestatistics.org/blog/index.php?pk=31529&T=1

[TABLE]
[ROW][C]ARIMA Parameter Estimation and Backward Selection[/C][/ROW]
[ROW][C]Iteration[/C][C]ar1[/C][C]ar2[/C][C]ar3[/C][C]ma1[/C][C]sar1[/C][C]sar2[/C][C]sma1[/C][/ROW]
[ROW][C]Estimates ( 1 )[/C][C]0.2996[/C][C]0.2719[/C][C]0.427[/C][C]-0.1863[/C][C]0.2841[/C][C]-0.0796[/C][C]-0.977[/C][/ROW]
[ROW][C](p-val)[/C][C](0.2976 )[/C][C](0.0859 )[/C][C](0.0316 )[/C][C](0.5892 )[/C][C](0.1161 )[/C][C](0.6712 )[/C][C](0.0026 )[/C][/ROW]
[ROW][C]Estimates ( 2 )[/C][C]0.3063[/C][C]0.2655[/C][C]0.4239[/C][C]-0.2042[/C][C]0.3086[/C][C]0[/C][C]-1.0002[/C][/ROW]
[ROW][C](p-val)[/C][C](0.3168 )[/C][C](0.0794 )[/C][C](0.0305 )[/C][C](0.5573 )[/C][C](0.0853 )[/C][C](NA )[/C][C](0.011 )[/C][/ROW]
[ROW][C]Estimates ( 3 )[/C][C]0.1468[/C][C]0.3206[/C][C]0.4956[/C][C]0[/C][C]0.3395[/C][C]0[/C][C]-1.0001[/C][/ROW]
[ROW][C](p-val)[/C][C](0.193 )[/C][C](0.0042 )[/C][C](1e-04 )[/C][C](NA )[/C][C](0.0544 )[/C][C](NA )[/C][C](0.0268 )[/C][/ROW]
[ROW][C]Estimates ( 4 )[/C][C]0[/C][C]0.3728[/C][C]0.5533[/C][C]0[/C][C]0.3591[/C][C]0[/C][C]-0.9359[/C][/ROW]
[ROW][C](p-val)[/C][C](NA )[/C][C](7e-04 )[/C][C](0 )[/C][C](NA )[/C][C](0.1452 )[/C][C](NA )[/C][C](0.1815 )[/C][/ROW]
[ROW][C]Estimates ( 5 )[/C][C]0[/C][C]0.3136[/C][C]0.504[/C][C]0[/C][C]-0.2814[/C][C]0[/C][C]0[/C][/ROW]
[ROW][C](p-val)[/C][C](NA )[/C][C](0.0025 )[/C][C](0 )[/C][C](NA )[/C][C](0.0274 )[/C][C](NA )[/C][C](NA )[/C][/ROW]
[ROW][C]Estimates ( 6 )[/C][C]NA[/C][C]NA[/C][C]NA[/C][C]NA[/C][C]NA[/C][C]NA[/C][C]NA[/C][/ROW]
[ROW][C](p-val)[/C][C](NA )[/C][C](NA )[/C][C](NA )[/C][C](NA )[/C][C](NA )[/C][C](NA )[/C][C](NA )[/C][/ROW]
[ROW][C]Estimates ( 7 )[/C][C]NA[/C][C]NA[/C][C]NA[/C][C]NA[/C][C]NA[/C][C]NA[/C][C]NA[/C][/ROW]
[ROW][C](p-val)[/C][C](NA )[/C][C](NA )[/C][C](NA )[/C][C](NA )[/C][C](NA )[/C][C](NA )[/C][C](NA )[/C][/ROW]
[ROW][C]Estimates ( 8 )[/C][C]NA[/C][C]NA[/C][C]NA[/C][C]NA[/C][C]NA[/C][C]NA[/C][C]NA[/C][/ROW]
[ROW][C](p-val)[/C][C](NA )[/C][C](NA )[/C][C](NA )[/C][C](NA )[/C][C](NA )[/C][C](NA )[/C][C](NA )[/C][/ROW]
[ROW][C]Estimates ( 9 )[/C][C]NA[/C][C]NA[/C][C]NA[/C][C]NA[/C][C]NA[/C][C]NA[/C][C]NA[/C][/ROW]
[ROW][C](p-val)[/C][C](NA )[/C][C](NA )[/C][C](NA )[/C][C](NA )[/C][C](NA )[/C][C](NA )[/C][C](NA )[/C][/ROW]
[ROW][C]Estimates ( 10 )[/C][C]NA[/C][C]NA[/C][C]NA[/C][C]NA[/C][C]NA[/C][C]NA[/C][C]NA[/C][/ROW]
[ROW][C](p-val)[/C][C](NA )[/C][C](NA )[/C][C](NA )[/C][C](NA )[/C][C](NA )[/C][C](NA )[/C][C](NA )[/C][/ROW]
[ROW][C]Estimates ( 11 )[/C][C]NA[/C][C]NA[/C][C]NA[/C][C]NA[/C][C]NA[/C][C]NA[/C][C]NA[/C][/ROW]
[ROW][C](p-val)[/C][C](NA )[/C][C](NA )[/C][C](NA )[/C][C](NA )[/C][C](NA )[/C][C](NA )[/C][C](NA )[/C][/ROW]
[ROW][C]Estimates ( 12 )[/C][C]NA[/C][C]NA[/C][C]NA[/C][C]NA[/C][C]NA[/C][C]NA[/C][C]NA[/C][/ROW]
[ROW][C](p-val)[/C][C](NA )[/C][C](NA )[/C][C](NA )[/C][C](NA )[/C][C](NA )[/C][C](NA )[/C][C](NA )[/C][/ROW]
[ROW][C]Estimates ( 13 )[/C][C]NA[/C][C]NA[/C][C]NA[/C][C]NA[/C][C]NA[/C][C]NA[/C][C]NA[/C][/ROW]
[ROW][C](p-val)[/C][C](NA )[/C][C](NA )[/C][C](NA )[/C][C](NA )[/C][C](NA )[/C][C](NA )[/C][C](NA )[/C][/ROW]
[/TABLE]
Source: https://freestatistics.org/blog/index.php?pk=31529&T=1

Globally Unique Identifier (entire table): ba.freestatistics.org/blog/index.php?pk=31529&T=1

As an alternative you can also use a QR Code:  

The GUIDs for individual cells are displayed in the table below:

ARIMA Parameter Estimation and Backward Selection
Iterationar1ar2ar3ma1sar1sar2sma1
Estimates ( 1 )0.29960.27190.427-0.18630.2841-0.0796-0.977
(p-val)(0.2976 )(0.0859 )(0.0316 )(0.5892 )(0.1161 )(0.6712 )(0.0026 )
Estimates ( 2 )0.30630.26550.4239-0.20420.30860-1.0002
(p-val)(0.3168 )(0.0794 )(0.0305 )(0.5573 )(0.0853 )(NA )(0.011 )
Estimates ( 3 )0.14680.32060.495600.33950-1.0001
(p-val)(0.193 )(0.0042 )(1e-04 )(NA )(0.0544 )(NA )(0.0268 )
Estimates ( 4 )00.37280.553300.35910-0.9359
(p-val)(NA )(7e-04 )(0 )(NA )(0.1452 )(NA )(0.1815 )
Estimates ( 5 )00.31360.5040-0.281400
(p-val)(NA )(0.0025 )(0 )(NA )(0.0274 )(NA )(NA )
Estimates ( 6 )NANANANANANANA
(p-val)(NA )(NA )(NA )(NA )(NA )(NA )(NA )
Estimates ( 7 )NANANANANANANA
(p-val)(NA )(NA )(NA )(NA )(NA )(NA )(NA )
Estimates ( 8 )NANANANANANANA
(p-val)(NA )(NA )(NA )(NA )(NA )(NA )(NA )
Estimates ( 9 )NANANANANANANA
(p-val)(NA )(NA )(NA )(NA )(NA )(NA )(NA )
Estimates ( 10 )NANANANANANANA
(p-val)(NA )(NA )(NA )(NA )(NA )(NA )(NA )
Estimates ( 11 )NANANANANANANA
(p-val)(NA )(NA )(NA )(NA )(NA )(NA )(NA )
Estimates ( 12 )NANANANANANANA
(p-val)(NA )(NA )(NA )(NA )(NA )(NA )(NA )
Estimates ( 13 )NANANANANANANA
(p-val)(NA )(NA )(NA )(NA )(NA )(NA )(NA )


Estimated ARIMA Residuals
Value
0.0965989431882873
0.0620093143913463
-0.219931472153532
-4.74976085868849
-4.29085902701984
-1.30943535095461
-0.480026801472911
3.85105903419582
-4.07539796433118
-0.547724310907359
-4.53360769180311
0.448602496365617
8.19602559257001
2.50333538927331
-0.796272064649943
9.73554492428469
8.18101099312659
-3.95617405625487
2.84819101894589
2.69311092723855
10.2159992174719
-0.443180513056213
-3.83019370112459
-5.52287554350554
1.48973571284374
2.17119715252881
0.917069543247352
-1.95696324360512
-4.45616592582524
-4.99598169604288
11.3211688977738
-4.45729650940722
-3.03228887733801
-0.87952644255591
-5.7533045307126
7.09396791487272
6.72455222843288
6.44933820428229
0.37558039029298
6.40172625656276
-7.91115018859856
8.37809740156442
1.06495222236119
-2.13719150325100
-4.90677855729284
4.8248040246809
13.5572175341666
8.3083180383935
-3.09045067716956
1.88324110050288
-3.36126157758378
-1.02511380154552
-3.01379402980950
0.494210429816775
5.88232991606756
8.30665761719365
1.86499314245167
-3.72658589711752
4.96909471512788
2.71546784817318
-5.10305023319549
-3.11170470307742

\begin{tabular}{lllllllll}
\hline
Estimated ARIMA Residuals \tabularnewline
Value \tabularnewline
0.0965989431882873 \tabularnewline
0.0620093143913463 \tabularnewline
-0.219931472153532 \tabularnewline
-4.74976085868849 \tabularnewline
-4.29085902701984 \tabularnewline
-1.30943535095461 \tabularnewline
-0.480026801472911 \tabularnewline
3.85105903419582 \tabularnewline
-4.07539796433118 \tabularnewline
-0.547724310907359 \tabularnewline
-4.53360769180311 \tabularnewline
0.448602496365617 \tabularnewline
8.19602559257001 \tabularnewline
2.50333538927331 \tabularnewline
-0.796272064649943 \tabularnewline
9.73554492428469 \tabularnewline
8.18101099312659 \tabularnewline
-3.95617405625487 \tabularnewline
2.84819101894589 \tabularnewline
2.69311092723855 \tabularnewline
10.2159992174719 \tabularnewline
-0.443180513056213 \tabularnewline
-3.83019370112459 \tabularnewline
-5.52287554350554 \tabularnewline
1.48973571284374 \tabularnewline
2.17119715252881 \tabularnewline
0.917069543247352 \tabularnewline
-1.95696324360512 \tabularnewline
-4.45616592582524 \tabularnewline
-4.99598169604288 \tabularnewline
11.3211688977738 \tabularnewline
-4.45729650940722 \tabularnewline
-3.03228887733801 \tabularnewline
-0.87952644255591 \tabularnewline
-5.7533045307126 \tabularnewline
7.09396791487272 \tabularnewline
6.72455222843288 \tabularnewline
6.44933820428229 \tabularnewline
0.37558039029298 \tabularnewline
6.40172625656276 \tabularnewline
-7.91115018859856 \tabularnewline
8.37809740156442 \tabularnewline
1.06495222236119 \tabularnewline
-2.13719150325100 \tabularnewline
-4.90677855729284 \tabularnewline
4.8248040246809 \tabularnewline
13.5572175341666 \tabularnewline
8.3083180383935 \tabularnewline
-3.09045067716956 \tabularnewline
1.88324110050288 \tabularnewline
-3.36126157758378 \tabularnewline
-1.02511380154552 \tabularnewline
-3.01379402980950 \tabularnewline
0.494210429816775 \tabularnewline
5.88232991606756 \tabularnewline
8.30665761719365 \tabularnewline
1.86499314245167 \tabularnewline
-3.72658589711752 \tabularnewline
4.96909471512788 \tabularnewline
2.71546784817318 \tabularnewline
-5.10305023319549 \tabularnewline
-3.11170470307742 \tabularnewline
\hline
\end{tabular}
%Source: https://freestatistics.org/blog/index.php?pk=31529&T=2

[TABLE]
[ROW][C]Estimated ARIMA Residuals[/C][/ROW]
[ROW][C]Value[/C][/ROW]
[ROW][C]0.0965989431882873[/C][/ROW]
[ROW][C]0.0620093143913463[/C][/ROW]
[ROW][C]-0.219931472153532[/C][/ROW]
[ROW][C]-4.74976085868849[/C][/ROW]
[ROW][C]-4.29085902701984[/C][/ROW]
[ROW][C]-1.30943535095461[/C][/ROW]
[ROW][C]-0.480026801472911[/C][/ROW]
[ROW][C]3.85105903419582[/C][/ROW]
[ROW][C]-4.07539796433118[/C][/ROW]
[ROW][C]-0.547724310907359[/C][/ROW]
[ROW][C]-4.53360769180311[/C][/ROW]
[ROW][C]0.448602496365617[/C][/ROW]
[ROW][C]8.19602559257001[/C][/ROW]
[ROW][C]2.50333538927331[/C][/ROW]
[ROW][C]-0.796272064649943[/C][/ROW]
[ROW][C]9.73554492428469[/C][/ROW]
[ROW][C]8.18101099312659[/C][/ROW]
[ROW][C]-3.95617405625487[/C][/ROW]
[ROW][C]2.84819101894589[/C][/ROW]
[ROW][C]2.69311092723855[/C][/ROW]
[ROW][C]10.2159992174719[/C][/ROW]
[ROW][C]-0.443180513056213[/C][/ROW]
[ROW][C]-3.83019370112459[/C][/ROW]
[ROW][C]-5.52287554350554[/C][/ROW]
[ROW][C]1.48973571284374[/C][/ROW]
[ROW][C]2.17119715252881[/C][/ROW]
[ROW][C]0.917069543247352[/C][/ROW]
[ROW][C]-1.95696324360512[/C][/ROW]
[ROW][C]-4.45616592582524[/C][/ROW]
[ROW][C]-4.99598169604288[/C][/ROW]
[ROW][C]11.3211688977738[/C][/ROW]
[ROW][C]-4.45729650940722[/C][/ROW]
[ROW][C]-3.03228887733801[/C][/ROW]
[ROW][C]-0.87952644255591[/C][/ROW]
[ROW][C]-5.7533045307126[/C][/ROW]
[ROW][C]7.09396791487272[/C][/ROW]
[ROW][C]6.72455222843288[/C][/ROW]
[ROW][C]6.44933820428229[/C][/ROW]
[ROW][C]0.37558039029298[/C][/ROW]
[ROW][C]6.40172625656276[/C][/ROW]
[ROW][C]-7.91115018859856[/C][/ROW]
[ROW][C]8.37809740156442[/C][/ROW]
[ROW][C]1.06495222236119[/C][/ROW]
[ROW][C]-2.13719150325100[/C][/ROW]
[ROW][C]-4.90677855729284[/C][/ROW]
[ROW][C]4.8248040246809[/C][/ROW]
[ROW][C]13.5572175341666[/C][/ROW]
[ROW][C]8.3083180383935[/C][/ROW]
[ROW][C]-3.09045067716956[/C][/ROW]
[ROW][C]1.88324110050288[/C][/ROW]
[ROW][C]-3.36126157758378[/C][/ROW]
[ROW][C]-1.02511380154552[/C][/ROW]
[ROW][C]-3.01379402980950[/C][/ROW]
[ROW][C]0.494210429816775[/C][/ROW]
[ROW][C]5.88232991606756[/C][/ROW]
[ROW][C]8.30665761719365[/C][/ROW]
[ROW][C]1.86499314245167[/C][/ROW]
[ROW][C]-3.72658589711752[/C][/ROW]
[ROW][C]4.96909471512788[/C][/ROW]
[ROW][C]2.71546784817318[/C][/ROW]
[ROW][C]-5.10305023319549[/C][/ROW]
[ROW][C]-3.11170470307742[/C][/ROW]
[/TABLE]
Source: https://freestatistics.org/blog/index.php?pk=31529&T=2

Globally Unique Identifier (entire table): ba.freestatistics.org/blog/index.php?pk=31529&T=2

As an alternative you can also use a QR Code:  

The GUIDs for individual cells are displayed in the table below:

Estimated ARIMA Residuals
Value
0.0965989431882873
0.0620093143913463
-0.219931472153532
-4.74976085868849
-4.29085902701984
-1.30943535095461
-0.480026801472911
3.85105903419582
-4.07539796433118
-0.547724310907359
-4.53360769180311
0.448602496365617
8.19602559257001
2.50333538927331
-0.796272064649943
9.73554492428469
8.18101099312659
-3.95617405625487
2.84819101894589
2.69311092723855
10.2159992174719
-0.443180513056213
-3.83019370112459
-5.52287554350554
1.48973571284374
2.17119715252881
0.917069543247352
-1.95696324360512
-4.45616592582524
-4.99598169604288
11.3211688977738
-4.45729650940722
-3.03228887733801
-0.87952644255591
-5.7533045307126
7.09396791487272
6.72455222843288
6.44933820428229
0.37558039029298
6.40172625656276
-7.91115018859856
8.37809740156442
1.06495222236119
-2.13719150325100
-4.90677855729284
4.8248040246809
13.5572175341666
8.3083180383935
-3.09045067716956
1.88324110050288
-3.36126157758378
-1.02511380154552
-3.01379402980950
0.494210429816775
5.88232991606756
8.30665761719365
1.86499314245167
-3.72658589711752
4.96909471512788
2.71546784817318
-5.10305023319549
-3.11170470307742


Parameters (Session):
par1 = FALSE ; par2 = 1 ; par3 = 0 ; par4 = 1 ; par5 = 12 ; par6 = 3 ; par7 = 1 ; par8 = 2 ; par9 = 1 ;
Parameters (R input):
par1 = FALSE ; par2 = 1 ; par3 = 0 ; par4 = 1 ; par5 = 12 ; par6 = 3 ; par7 = 1 ; par8 = 2 ; par9 = 1 ;
R code (references can be found in the software module):
library(lattice)
if (par1 == 'TRUE') par1 <- TRUE
if (par1 == 'FALSE') par1 <- FALSE
par2 <- as.numeric(par2) #Box-Cox lambda transformation parameter
par3 <- as.numeric(par3) #degree of non-seasonal differencing
par4 <- as.numeric(par4) #degree of seasonal differencing
par5 <- as.numeric(par5) #seasonal period
par6 <- as.numeric(par6) #degree (p) of the non-seasonal AR(p) polynomial
par7 <- as.numeric(par7) #degree (q) of the non-seasonal MA(q) polynomial
par8 <- as.numeric(par8) #degree (P) of the seasonal AR(P) polynomial
par9 <- as.numeric(par9) #degree (Q) of the seasonal MA(Q) polynomial
armaGR <- function(arima.out, names, n){
try1 <- arima.out$coef
try2 <- sqrt(diag(arima.out$var.coef))
try.data.frame <- data.frame(matrix(NA,ncol=4,nrow=length(names)))
dimnames(try.data.frame) <- list(names,c('coef','std','tstat','pv'))
try.data.frame[,1] <- try1
for(i in 1:length(try2)) try.data.frame[which(rownames(try.data.frame)==names(try2)[i]),2] <- try2[i]
try.data.frame[,3] <- try.data.frame[,1] / try.data.frame[,2]
try.data.frame[,4] <- round((1-pt(abs(try.data.frame[,3]),df=n-(length(try2)+1)))*2,5)
vector <- rep(NA,length(names))
vector[is.na(try.data.frame[,4])] <- 0
maxi <- which.max(try.data.frame[,4])
continue <- max(try.data.frame[,4],na.rm=TRUE) > .05
vector[maxi] <- 0
list(summary=try.data.frame,next.vector=vector,continue=continue)
}
arimaSelect <- function(series, order=c(13,0,0), seasonal=list(order=c(2,0,0),period=12), include.mean=F){
nrc <- order[1]+order[3]+seasonal$order[1]+seasonal$order[3]
coeff <- matrix(NA, nrow=nrc*2, ncol=nrc)
pval <- matrix(NA, nrow=nrc*2, ncol=nrc)
mylist <- rep(list(NULL), nrc)
names <- NULL
if(order[1] > 0) names <- paste('ar',1:order[1],sep='')
if(order[3] > 0) names <- c( names , paste('ma',1:order[3],sep='') )
if(seasonal$order[1] > 0) names <- c(names, paste('sar',1:seasonal$order[1],sep=''))
if(seasonal$order[3] > 0) names <- c(names, paste('sma',1:seasonal$order[3],sep=''))
arima.out <- arima(series, order=order, seasonal=seasonal, include.mean=include.mean, method='ML')
mylist[[1]] <- arima.out
last.arma <- armaGR(arima.out, names, length(series))
mystop <- FALSE
i <- 1
coeff[i,] <- last.arma[[1]][,1]
pval [i,] <- last.arma[[1]][,4]
i <- 2
aic <- arima.out$aic
while(!mystop){
mylist[[i]] <- arima.out
arima.out <- arima(series, order=order, seasonal=seasonal, include.mean=include.mean, method='ML', fixed=last.arma$next.vector)
aic <- c(aic, arima.out$aic)
last.arma <- armaGR(arima.out, names, length(series))
mystop <- !last.arma$continue
coeff[i,] <- last.arma[[1]][,1]
pval [i,] <- last.arma[[1]][,4]
i <- i+1
}
list(coeff, pval, mylist, aic=aic)
}
arimaSelectplot <- function(arimaSelect.out,noms,choix){
noms <- names(arimaSelect.out[[3]][[1]]$coef)
coeff <- arimaSelect.out[[1]]
k <- min(which(is.na(coeff[,1])))-1
coeff <- coeff[1:k,]
pval <- arimaSelect.out[[2]][1:k,]
aic <- arimaSelect.out$aic[1:k]
coeff[coeff==0] <- NA
n <- ncol(coeff)
if(missing(choix)) choix <- k
layout(matrix(c(1,1,1,2,
3,3,3,2,
3,3,3,4,
5,6,7,7),nr=4),
widths=c(10,35,45,15),
heights=c(30,30,15,15))
couleurs <- rainbow(75)[1:50]#(50)
ticks <- pretty(coeff)
par(mar=c(1,1,3,1))
plot(aic,k:1-.5,type='o',pch=21,bg='blue',cex=2,axes=F,lty=2,xpd=NA)
points(aic[choix],k-choix+.5,pch=21,cex=4,bg=2,xpd=NA)
title('aic',line=2)
par(mar=c(3,0,0,0))
plot(0,axes=F,xlab='',ylab='',xlim=range(ticks),ylim=c(.1,1))
rect(xleft = min(ticks) + (0:49)/50*(max(ticks)-min(ticks)),
xright = min(ticks) + (1:50)/50*(max(ticks)-min(ticks)),
ytop = rep(1,50),
ybottom= rep(0,50),col=couleurs,border=NA)
axis(1,ticks)
rect(xleft=min(ticks),xright=max(ticks),ytop=1,ybottom=0)
text(mean(coeff,na.rm=T),.5,'coefficients',cex=2,font=2)
par(mar=c(1,1,3,1))
image(1:n,1:k,t(coeff[k:1,]),axes=F,col=couleurs,zlim=range(ticks))
for(i in 1:n) for(j in 1:k) if(!is.na(coeff[j,i])) {
if(pval[j,i]<.01) symb = 'green'
else if( (pval[j,i]<.05) & (pval[j,i]>=.01)) symb = 'orange'
else if( (pval[j,i]<.1) & (pval[j,i]>=.05)) symb = 'red'
else symb = 'black'
polygon(c(i+.5 ,i+.2 ,i+.5 ,i+.5),
c(k-j+0.5,k-j+0.5,k-j+0.8,k-j+0.5),
col=symb)
if(j==choix) {
rect(xleft=i-.5,
xright=i+.5,
ybottom=k-j+1.5,
ytop=k-j+.5,
lwd=4)
text(i,
k-j+1,
round(coeff[j,i],2),
cex=1.2,
font=2)
}
else{
rect(xleft=i-.5,xright=i+.5,ybottom=k-j+1.5,ytop=k-j+.5)
text(i,k-j+1,round(coeff[j,i],2),cex=1.2,font=1)
}
}
axis(3,1:n,noms)
par(mar=c(0.5,0,0,0.5))
plot(0,axes=F,xlab='',ylab='',type='n',xlim=c(0,8),ylim=c(-.2,.8))
cols <- c('green','orange','red','black')
niv <- c('0','0.01','0.05','0.1')
for(i in 0:3){
polygon(c(1+2*i ,1+2*i ,1+2*i-.5 ,1+2*i),
c(.4 ,.7 , .4 , .4),
col=cols[i+1])
text(2*i,0.5,niv[i+1],cex=1.5)
}
text(8,.5,1,cex=1.5)
text(4,0,'p-value',cex=2)
box()
residus <- arimaSelect.out[[3]][[choix]]$res
par(mar=c(1,2,4,1))
acf(residus,main='')
title('acf',line=.5)
par(mar=c(1,2,4,1))
pacf(residus,main='')
title('pacf',line=.5)
par(mar=c(2,2,4,1))
qqnorm(residus,main='')
title('qq-norm',line=.5)
qqline(residus)
residus
}
if (par2 == 0) x <- log(x)
if (par2 != 0) x <- x^par2
(selection <- arimaSelect(x, order=c(par6,par3,par7), seasonal=list(order=c(par8,par4,par9), period=par5)))
bitmap(file='test1.png')
resid <- arimaSelectplot(selection)
dev.off()
resid
bitmap(file='test2.png')
acf(resid,length(resid)/2, main='Residual Autocorrelation Function')
dev.off()
bitmap(file='test3.png')
pacf(resid,length(resid)/2, main='Residual Partial Autocorrelation Function')
dev.off()
bitmap(file='test4.png')
cpgram(resid, main='Residual Cumulative Periodogram')
dev.off()
bitmap(file='test5.png')
hist(resid, main='Residual Histogram', xlab='values of Residuals')
dev.off()
bitmap(file='test6.png')
densityplot(~resid,col='black',main='Residual Density Plot', xlab='values of Residuals')
dev.off()
bitmap(file='test7.png')
qqnorm(resid, main='Residual Normal Q-Q Plot')
qqline(resid)
dev.off()
ncols <- length(selection[[1]][1,])
nrows <- length(selection[[2]][,1])-1
load(file='createtable')
a<-table.start()
a<-table.row.start(a)
a<-table.element(a,'ARIMA Parameter Estimation and Backward Selection', ncols+1,TRUE)
a<-table.row.end(a)
a<-table.row.start(a)
a<-table.element(a,'Iteration', header=TRUE)
for (i in 1:ncols) {
a<-table.element(a,names(selection[[3]][[1]]$coef)[i],header=TRUE)
}
a<-table.row.end(a)
for (j in 1:nrows) {
a<-table.row.start(a)
mydum <- 'Estimates ('
mydum <- paste(mydum,j)
mydum <- paste(mydum,')')
a<-table.element(a,mydum, header=TRUE)
for (i in 1:ncols) {
a<-table.element(a,round(selection[[1]][j,i],4))
}
a<-table.row.end(a)
a<-table.row.start(a)
a<-table.element(a,'(p-val)', header=TRUE)
for (i in 1:ncols) {
mydum <- '('
mydum <- paste(mydum,round(selection[[2]][j,i],4),sep='')
mydum <- paste(mydum,')')
a<-table.element(a,mydum)
}
a<-table.row.end(a)
}
a<-table.end(a)
table.save(a,file='mytable.tab')
a<-table.start()
a<-table.row.start(a)
a<-table.element(a,'Estimated ARIMA Residuals', 1,TRUE)
a<-table.row.end(a)
a<-table.row.start(a)
a<-table.element(a,'Value', 1,TRUE)
a<-table.row.end(a)
for (i in (par4*par5+par3):length(resid)) {
a<-table.row.start(a)
a<-table.element(a,resid[i])
a<-table.row.end(a)
}
a<-table.end(a)
table.save(a,file='mytable1.tab')