Free Statistics
of Irreproducible Research!
Description of Statistical Computation | |||||||||||||||||||||
|---|---|---|---|---|---|---|---|---|---|---|---|---|---|---|---|---|---|---|---|---|---|
| Author's title | |||||||||||||||||||||
| Author | *The author of this computation has been verified* | ||||||||||||||||||||
| R Software Module | rwasp_backtobackhist.wasp | ||||||||||||||||||||
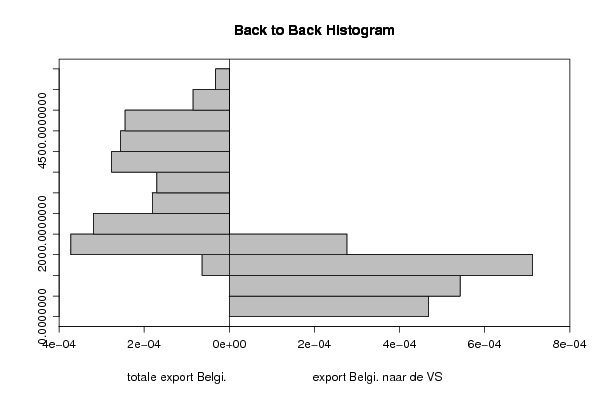
| Title produced by software | Back to Back Histogram | ||||||||||||||||||||
| Date of computation | Tue, 02 Dec 2008 09:45:23 -0700 | ||||||||||||||||||||
| Cite this page as follows | Statistical Computations at FreeStatistics.org, Office for Research Development and Education, URL https://freestatistics.org/blog/index.php?v=date/2008/Dec/02/t12282364070goidcg9v2yinno.htm/, Retrieved Wed, 15 May 2024 15:53:56 +0000 | ||||||||||||||||||||
| Statistical Computations at FreeStatistics.org, Office for Research Development and Education, URL https://freestatistics.org/blog/index.php?pk=28065, Retrieved Wed, 15 May 2024 15:53:56 +0000 | |||||||||||||||||||||
| QR Codes: | |||||||||||||||||||||
|
| |||||||||||||||||||||
| Original text written by user: | |||||||||||||||||||||
| IsPrivate? | No (this computation is public) | ||||||||||||||||||||
| User-defined keywords | |||||||||||||||||||||
| Estimated Impact | 201 | ||||||||||||||||||||
Tree of Dependent Computations | |||||||||||||||||||||
| Family? (F = Feedback message, R = changed R code, M = changed R Module, P = changed Parameters, D = changed Data) | |||||||||||||||||||||
| F [Central Tendency] [Q1 central tenden...] [2007-10-18 09:35:57] [b731da8b544846036771bbf9bf2f34ce] - RMPD [Back to Back Histogram] [Similar distribut...] [2008-10-17 10:19:03] [1df53680523b3d683eb04eb09d7bca8b] F [Back to Back Histogram] [] [2008-10-20 14:16:17] [4c8dfb519edec2da3492d7e6be9a5685] - PD [Back to Back Histogram] [] [2008-12-02 16:45:23] [c60a842d48931bd392d024d8e9ef4583] [Current] | |||||||||||||||||||||
| Feedback Forum | |||||||||||||||||||||
Post a new message | |||||||||||||||||||||
Dataset | |||||||||||||||||||||
| Dataseries X: | |||||||||||||||||||||
1160.9 1470.1 1653 1390 1550.7 1852.1 1797.9 1256.4 1835.5 1793.2 1874.8 1948.6 1819.9 1823.6 2042.7 1705.9 1876.8 1919.5 1803.4 1380.4 1812.1 1856.4 1934.3 1977.5 1813.7 1937.1 2178.7 1699.9 1943.8 2151 1927.7 1418.2 1899.8 1974.9 1918.7 1818.3 1751 1888 1947.7 1818.1 2110.8 2009 2124.2 1542.5 2044.1 2324.3 2055.6 2137.9 2140.7 2301.5 2412.6 2477 2311.8 2326.6 2745.3 1937.2 2668.7 2636.1 2327.6 2584.6 2282.8 2337 2499.3 2389.6 2327.1 2556.6 2580 1831.4 2382.1 2237.9 2117.7 2240.9 1946.1 2149.6 2690 2171.1 2358.6 2841.4 3064.6 2037.3 2799.9 2852.3 2541.2 2910 2694.6 3081.7 3648.2 2823.3 3670.1 3027.6 3578.5 2655.1 3835.3 3766 3716 3531.7 3194 3442.2 3610 3105.5 3428.4 3489.7 3679 2596.1 3110.7 3401.7 3431.8 3383.1 3797.5 3860.5 4054.1 4044.9 4402.4 4046.4 4329.7 3204.2 4037.2 4678.4 4174.6 4151.4 3874.7 3568 3431 3733.2 3278.3 3583.7 4060.3 2979 4078.4 4002.1 3542.4 3928.2 3626 3998.4 4413.5 3853.1 3920.5 4616.2 4332.7 3362.7 3855.4 4087.1 3860.2 4018.1 3627.7 3996 4420.7 4386.5 4631.8 4875.3 4549.3 3933 4963.3 4419.7 4646.7 5000.2 4302.2 4432.1 5125.5 4299.9 5145.6 4537.8 4880.9 4136.9 4668.8 4818.5 4933.9 4524.4 4676.1 4911 5745 4483.7 4772.7 5021.4 5535.6 4736 5001.7 5486.3 4958.5 4756.4 4763.3 4951.2 4692.8 5301.2 4929.7 5223.3 5708.3 4018 | |||||||||||||||||||||
| Dataseries Y: | |||||||||||||||||||||
283.9 340.5 383 335.4 356 431 441.9 262.3 481.1 442.8 458.4 472.7 498.8 463.3 538.3 494.2 446.2 497.5 433.2 359.4 455.9 483 469.7 423.8 371 435.7 438.1 364.5 392.7 405.1 391.4 282.8 408 480.9 416.9 350.7 399.9 438.1 454.9 407.7 485 494 521.2 333 520.3 570.5 501.8 408.4 512.7 596.9 581.5 605.7 581.1 538.3 731.4 457.7 706.3 708.5 683.5 722.1 727.7 674.4 675.3 628.7 658.3 786 736.9 567.3 736.3 719.6 676.8 589.5 596.5 661 840.9 683.1 677.4 780.2 928.8 557.5 760.6 847 719 699.8 745.4 871.5 1199.8 795.4 1054.4 753.7 1093.8 768.4 1405.7 1149.2 1086.8 994.4 958.8 1096.3 1107.4 862.4 983 1021.1 1036.3 684.5 874.1 1031.6 1126.3 1041.9 1419.4 1402.2 1503.6 1503.6 1571.2 1351.2 1448.3 1292.9 1293.7 1824.7 1641.4 1529.1 1417 1060 1117 1226.2 1124 1246 1398.1 1095.2 1507.1 1467 1262.1 1262.9 1184.9 1412.9 1581.8 1348.8 1443.7 1628.7 1393.2 1108.1 1074.8 1323.5 1367 1190.7 1149.2 1281.9 1406.8 1392.4 1674.5 1529.8 1180.9 1282.8 1524.2 1524.6 1520.1 1881.9 1375.2 1336.5 1653.9 1404.3 1731.4 1330.8 1616.3 1503.7 1476.7 1565.6 1581.8 1407.7 1393.7 1662.4 1929 1352.8 1339.8 1251.2 1491.7 1540.7 1383.7 1827.5 1591.3 1289.2 1291.9 1368.3 1264.6 1448.8 1239.2 1280.9 1269.4 1068.5 | |||||||||||||||||||||
Tables (Output of Computation) | |||||||||||||||||||||
| |||||||||||||||||||||
Figures (Output of Computation) | |||||||||||||||||||||
Input Parameters & R Code | |||||||||||||||||||||
| Parameters (Session): | |||||||||||||||||||||
| par1 = grey ; par2 = grey ; par3 = TRUE ; par4 = totale export Belgi� ; par5 = export Belgi� naar de VS ; | |||||||||||||||||||||
| Parameters (R input): | |||||||||||||||||||||
| par1 = grey ; par2 = grey ; par3 = TRUE ; par4 = totale export Belgi� ; par5 = export Belgi� naar de VS ; | |||||||||||||||||||||
| R code (references can be found in the software module): | |||||||||||||||||||||
if (par3 == 'TRUE') par3 <- TRUE | |||||||||||||||||||||