Free Statistics

of Irreproducible Research!

Author's title

Author*Unverified author*
R Software Modulerwasp_exponentialsmoothing.wasp
Title produced by softwareExponential Smoothing
Date of computationMon, 29 Nov 2021 08:08:50 +0100
Cite this page as followsStatistical Computations at FreeStatistics.org, Office for Research Development and Education, URL https://freestatistics.org/blog/index.php?v=date/2021/Nov/29/t16381698529hu1fiffzk92hj5.htm/, Retrieved Sat, 11 May 2024 17:43:19 +0000
Statistical Computations at FreeStatistics.org, Office for Research Development and Education, URL https://freestatistics.org/blog/index.php?pk=319568, Retrieved Sat, 11 May 2024 17:43:19 +0000
QR Codes:

Original text written by user:
IsPrivate?No (this computation is public)
User-defined keywords
Estimated Impact54
Family? (F = Feedback message, R = changed R code, M = changed R Module, P = changed Parameters, D = changed Data)
-       [Exponential Smoothing] [Turistas] [2021-11-29 07:08:50] [d41d8cd98f00b204e9800998ecf8427e] [Current]
Feedback Forum

Post a new message
Dataseries X:
500
350
250
400
450
350
200
300
350
200
150
400
550
350
250
550
550
400
350
600
750
500
400
650
850


Summary of computational transaction
Raw Input view raw input (R code)
Raw Outputview raw output of R engine
Computing time1 seconds
R ServerBig Analytics Cloud Computing Center

\begin{tabular}{lllllllll}
\hline
Summary of computational transaction \tabularnewline
Raw Input view raw input (R code)  \tabularnewline
Raw Outputview raw output of R engine  \tabularnewline
Computing time1 seconds \tabularnewline
R ServerBig Analytics Cloud Computing Center \tabularnewline
\hline
\end{tabular}
%Source: https://freestatistics.org/blog/index.php?pk=319568&T=0

[TABLE]
[ROW]
Summary of computational transaction[/C][/ROW] [ROW]Raw Input[/C] view raw input (R code) [/C][/ROW] [ROW]Raw Output[/C]view raw output of R engine [/C][/ROW] [ROW]Computing time[/C]1 seconds[/C][/ROW] [ROW]R Server[/C]Big Analytics Cloud Computing Center[/C][/ROW] [/TABLE] Source: https://freestatistics.org/blog/index.php?pk=319568&T=0

Globally Unique Identifier (entire table): ba.freestatistics.org/blog/index.php?pk=319568&T=0

As an alternative you can also use a QR Code:  

The GUIDs for individual cells are displayed in the table below:

Summary of computational transaction
Raw Input view raw input (R code)
Raw Outputview raw output of R engine
Computing time1 seconds
R ServerBig Analytics Cloud Computing Center


Estimated Parameters of Exponential Smoothing
ParameterValue
alpha0.376043555995014
betaFALSE
gammaFALSE

\begin{tabular}{lllllllll}
\hline
Estimated Parameters of Exponential Smoothing \tabularnewline
Parameter & Value \tabularnewline
alpha & 0.376043555995014 \tabularnewline
beta & FALSE \tabularnewline
gamma & FALSE \tabularnewline
\hline
\end{tabular}
%Source: https://freestatistics.org/blog/index.php?pk=319568&T=1

[TABLE]
[ROW][C]Estimated Parameters of Exponential Smoothing[/C][/ROW]
[ROW][C]Parameter[/C][C]Value[/C][/ROW]
[ROW][C]alpha[/C][C]0.376043555995014[/C][/ROW]
[ROW][C]beta[/C][C]FALSE[/C][/ROW]
[ROW][C]gamma[/C][C]FALSE[/C][/ROW]
[/TABLE]
Source: https://freestatistics.org/blog/index.php?pk=319568&T=1

Globally Unique Identifier (entire table): ba.freestatistics.org/blog/index.php?pk=319568&T=1

As an alternative you can also use a QR Code:  

The GUIDs for individual cells are displayed in the table below:

Estimated Parameters of Exponential Smoothing
ParameterValue
alpha0.376043555995014
betaFALSE
gammaFALSE


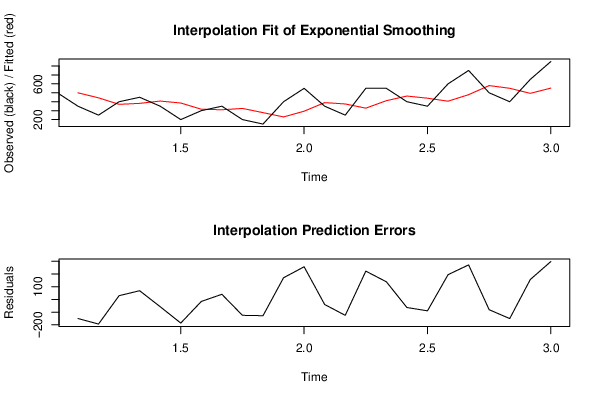
Interpolation Forecasts of Exponential Smoothing
tObservedFittedResiduals
2350500-150
3250443.593466600748-193.593466600748
4400370.79389100280129.2061089971992
5450381.77666008688668.2233399131144
6350407.43160742967-57.4316074296697
7200385.834821545307-185.834821545307
8300315.952834423711-15.952834423711
9350309.95387383881940.046126161181
10200325.012961524294-125.012961524294
11150278.002642927231-128.002642927231
12400229.868073904115170.131926095885
13550293.845088381492256.154911618508
14350390.170492232105-40.1704922321046
15250375.064637487074-125.064637487074
16550328.034886477207221.965113522793
17550411.503437073155138.496562926845
18400463.584177089253-63.5841770892532
19350439.673757031594-89.6737570315937
20600405.952518558194.047481442
21750478.922823511326271.077176488674
22500580.859648907215-80.8596489072152
23400550.452898995638-150.452898995638
24650493.876055847559156.123944152441
25850552.58545898261297.41454101739

\begin{tabular}{lllllllll}
\hline
Interpolation Forecasts of Exponential Smoothing \tabularnewline
t & Observed & Fitted & Residuals \tabularnewline
2 & 350 & 500 & -150 \tabularnewline
3 & 250 & 443.593466600748 & -193.593466600748 \tabularnewline
4 & 400 & 370.793891002801 & 29.2061089971992 \tabularnewline
5 & 450 & 381.776660086886 & 68.2233399131144 \tabularnewline
6 & 350 & 407.43160742967 & -57.4316074296697 \tabularnewline
7 & 200 & 385.834821545307 & -185.834821545307 \tabularnewline
8 & 300 & 315.952834423711 & -15.952834423711 \tabularnewline
9 & 350 & 309.953873838819 & 40.046126161181 \tabularnewline
10 & 200 & 325.012961524294 & -125.012961524294 \tabularnewline
11 & 150 & 278.002642927231 & -128.002642927231 \tabularnewline
12 & 400 & 229.868073904115 & 170.131926095885 \tabularnewline
13 & 550 & 293.845088381492 & 256.154911618508 \tabularnewline
14 & 350 & 390.170492232105 & -40.1704922321046 \tabularnewline
15 & 250 & 375.064637487074 & -125.064637487074 \tabularnewline
16 & 550 & 328.034886477207 & 221.965113522793 \tabularnewline
17 & 550 & 411.503437073155 & 138.496562926845 \tabularnewline
18 & 400 & 463.584177089253 & -63.5841770892532 \tabularnewline
19 & 350 & 439.673757031594 & -89.6737570315937 \tabularnewline
20 & 600 & 405.952518558 & 194.047481442 \tabularnewline
21 & 750 & 478.922823511326 & 271.077176488674 \tabularnewline
22 & 500 & 580.859648907215 & -80.8596489072152 \tabularnewline
23 & 400 & 550.452898995638 & -150.452898995638 \tabularnewline
24 & 650 & 493.876055847559 & 156.123944152441 \tabularnewline
25 & 850 & 552.58545898261 & 297.41454101739 \tabularnewline
\hline
\end{tabular}
%Source: https://freestatistics.org/blog/index.php?pk=319568&T=2

[TABLE]
[ROW][C]Interpolation Forecasts of Exponential Smoothing[/C][/ROW]
[ROW][C]t[/C][C]Observed[/C][C]Fitted[/C][C]Residuals[/C][/ROW]
[ROW][C]2[/C][C]350[/C][C]500[/C][C]-150[/C][/ROW]
[ROW][C]3[/C][C]250[/C][C]443.593466600748[/C][C]-193.593466600748[/C][/ROW]
[ROW][C]4[/C][C]400[/C][C]370.793891002801[/C][C]29.2061089971992[/C][/ROW]
[ROW][C]5[/C][C]450[/C][C]381.776660086886[/C][C]68.2233399131144[/C][/ROW]
[ROW][C]6[/C][C]350[/C][C]407.43160742967[/C][C]-57.4316074296697[/C][/ROW]
[ROW][C]7[/C][C]200[/C][C]385.834821545307[/C][C]-185.834821545307[/C][/ROW]
[ROW][C]8[/C][C]300[/C][C]315.952834423711[/C][C]-15.952834423711[/C][/ROW]
[ROW][C]9[/C][C]350[/C][C]309.953873838819[/C][C]40.046126161181[/C][/ROW]
[ROW][C]10[/C][C]200[/C][C]325.012961524294[/C][C]-125.012961524294[/C][/ROW]
[ROW][C]11[/C][C]150[/C][C]278.002642927231[/C][C]-128.002642927231[/C][/ROW]
[ROW][C]12[/C][C]400[/C][C]229.868073904115[/C][C]170.131926095885[/C][/ROW]
[ROW][C]13[/C][C]550[/C][C]293.845088381492[/C][C]256.154911618508[/C][/ROW]
[ROW][C]14[/C][C]350[/C][C]390.170492232105[/C][C]-40.1704922321046[/C][/ROW]
[ROW][C]15[/C][C]250[/C][C]375.064637487074[/C][C]-125.064637487074[/C][/ROW]
[ROW][C]16[/C][C]550[/C][C]328.034886477207[/C][C]221.965113522793[/C][/ROW]
[ROW][C]17[/C][C]550[/C][C]411.503437073155[/C][C]138.496562926845[/C][/ROW]
[ROW][C]18[/C][C]400[/C][C]463.584177089253[/C][C]-63.5841770892532[/C][/ROW]
[ROW][C]19[/C][C]350[/C][C]439.673757031594[/C][C]-89.6737570315937[/C][/ROW]
[ROW][C]20[/C][C]600[/C][C]405.952518558[/C][C]194.047481442[/C][/ROW]
[ROW][C]21[/C][C]750[/C][C]478.922823511326[/C][C]271.077176488674[/C][/ROW]
[ROW][C]22[/C][C]500[/C][C]580.859648907215[/C][C]-80.8596489072152[/C][/ROW]
[ROW][C]23[/C][C]400[/C][C]550.452898995638[/C][C]-150.452898995638[/C][/ROW]
[ROW][C]24[/C][C]650[/C][C]493.876055847559[/C][C]156.123944152441[/C][/ROW]
[ROW][C]25[/C][C]850[/C][C]552.58545898261[/C][C]297.41454101739[/C][/ROW]
[/TABLE]
Source: https://freestatistics.org/blog/index.php?pk=319568&T=2

Globally Unique Identifier (entire table): ba.freestatistics.org/blog/index.php?pk=319568&T=2

As an alternative you can also use a QR Code:  

The GUIDs for individual cells are displayed in the table below:

Interpolation Forecasts of Exponential Smoothing
tObservedFittedResiduals
2350500-150
3250443.593466600748-193.593466600748
4400370.79389100280129.2061089971992
5450381.77666008688668.2233399131144
6350407.43160742967-57.4316074296697
7200385.834821545307-185.834821545307
8300315.952834423711-15.952834423711
9350309.95387383881940.046126161181
10200325.012961524294-125.012961524294
11150278.002642927231-128.002642927231
12400229.868073904115170.131926095885
13550293.845088381492256.154911618508
14350390.170492232105-40.1704922321046
15250375.064637487074-125.064637487074
16550328.034886477207221.965113522793
17550411.503437073155138.496562926845
18400463.584177089253-63.5841770892532
19350439.673757031594-89.6737570315937
20600405.952518558194.047481442
21750478.922823511326271.077176488674
22500580.859648907215-80.8596489072152
23400550.452898995638-150.452898995638
24650493.876055847559156.123944152441
25850552.58545898261297.41454101739


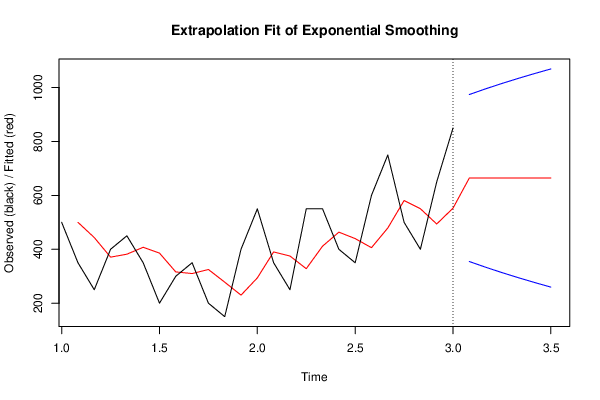
Extrapolation Forecasts of Exponential Smoothing
tForecast95% Lower Bound95% Upper Bound
26664.426280591414354.605695380971974.246865801858
27664.426280591414333.42408858297995.428472599858
28664.426280591414313.5187326408921015.33382854194
29664.426280591414294.6834465798531034.16911460298
30664.426280591414276.7622257744191052.09033540841
31664.426280591414259.6336478874491069.21891329538

\begin{tabular}{lllllllll}
\hline
Extrapolation Forecasts of Exponential Smoothing \tabularnewline
t & Forecast & 95% Lower Bound & 95% Upper Bound \tabularnewline
26 & 664.426280591414 & 354.605695380971 & 974.246865801858 \tabularnewline
27 & 664.426280591414 & 333.42408858297 & 995.428472599858 \tabularnewline
28 & 664.426280591414 & 313.518732640892 & 1015.33382854194 \tabularnewline
29 & 664.426280591414 & 294.683446579853 & 1034.16911460298 \tabularnewline
30 & 664.426280591414 & 276.762225774419 & 1052.09033540841 \tabularnewline
31 & 664.426280591414 & 259.633647887449 & 1069.21891329538 \tabularnewline
\hline
\end{tabular}
%Source: https://freestatistics.org/blog/index.php?pk=319568&T=3

[TABLE]
[ROW][C]Extrapolation Forecasts of Exponential Smoothing[/C][/ROW]
[ROW][C]t[/C][C]Forecast[/C][C]95% Lower Bound[/C][C]95% Upper Bound[/C][/ROW]
[ROW][C]26[/C][C]664.426280591414[/C][C]354.605695380971[/C][C]974.246865801858[/C][/ROW]
[ROW][C]27[/C][C]664.426280591414[/C][C]333.42408858297[/C][C]995.428472599858[/C][/ROW]
[ROW][C]28[/C][C]664.426280591414[/C][C]313.518732640892[/C][C]1015.33382854194[/C][/ROW]
[ROW][C]29[/C][C]664.426280591414[/C][C]294.683446579853[/C][C]1034.16911460298[/C][/ROW]
[ROW][C]30[/C][C]664.426280591414[/C][C]276.762225774419[/C][C]1052.09033540841[/C][/ROW]
[ROW][C]31[/C][C]664.426280591414[/C][C]259.633647887449[/C][C]1069.21891329538[/C][/ROW]
[/TABLE]
Source: https://freestatistics.org/blog/index.php?pk=319568&T=3

Globally Unique Identifier (entire table): ba.freestatistics.org/blog/index.php?pk=319568&T=3

As an alternative you can also use a QR Code:  

The GUIDs for individual cells are displayed in the table below:

Extrapolation Forecasts of Exponential Smoothing
tForecast95% Lower Bound95% Upper Bound
26664.426280591414354.605695380971974.246865801858
27664.426280591414333.42408858297995.428472599858
28664.426280591414313.5187326408921015.33382854194
29664.426280591414294.6834465798531034.16911460298
30664.426280591414276.7622257744191052.09033540841
31664.426280591414259.6336478874491069.21891329538


Parameters (Session):
par1 = 12 ; par2 = Single ; par3 = additive ; par4 = 6 ;
Parameters (R input):
par1 = 12 ; par2 = Single ; par3 = additive ; par4 = 6 ;
R code (references can be found in the software module):
par4 <- '12'
par3 <- 'additive'
par2 <- 'Single'
par1 <- '12'
par1 <- as.numeric(par1)
par4 <- as.numeric(par4)
if (par2 == 'Single') K <- 1
if (par2 == 'Double') K <- 2
if (par2 == 'Triple') K <- par1
nx <- length(x)
nxmK <- nx - K
x <- ts(x, frequency = par1)
if (par2 == 'Single') fit <- HoltWinters(x, gamma=F, beta=F)
if (par2 == 'Double') fit <- HoltWinters(x, gamma=F)
if (par2 == 'Triple') fit <- HoltWinters(x, seasonal=par3)
fit
myresid <- x - fit$fitted[,'xhat']
bitmap(file='test1.png')
op <- par(mfrow=c(2,1))
plot(fit,ylab='Observed (black) / Fitted (red)',main='Interpolation Fit of Exponential Smoothing')
plot(myresid,ylab='Residuals',main='Interpolation Prediction Errors')
par(op)
dev.off()
bitmap(file='test2.png')
p <- predict(fit, par4, prediction.interval=TRUE)
np <- length(p[,1])
plot(fit,p,ylab='Observed (black) / Fitted (red)',main='Extrapolation Fit of Exponential Smoothing')
dev.off()
bitmap(file='test3.png')
op <- par(mfrow = c(2,2))
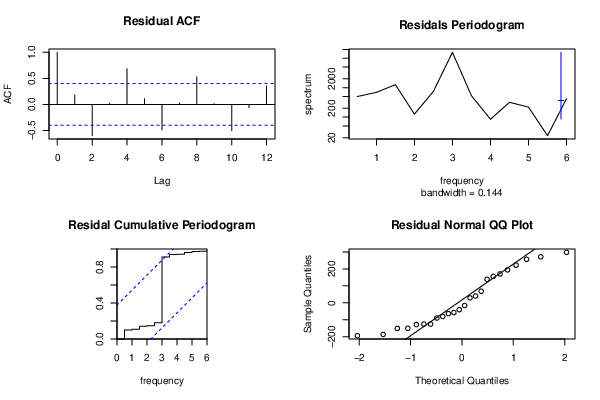
acf(as.numeric(myresid),lag.max = nx/2,main='Residual ACF')
spectrum(myresid,main='Residals Periodogram')
cpgram(myresid,main='Residal Cumulative Periodogram')
qqnorm(myresid,main='Residual Normal QQ Plot')
qqline(myresid)
par(op)
dev.off()
load(file='createtable')
a<-table.start()
a<-table.row.start(a)
a<-table.element(a,'Estimated Parameters of Exponential Smoothing',2,TRUE)
a<-table.row.end(a)
a<-table.row.start(a)
a<-table.element(a,'Parameter',header=TRUE)
a<-table.element(a,'Value',header=TRUE)
a<-table.row.end(a)
a<-table.row.start(a)
a<-table.element(a,'alpha',header=TRUE)
a<-table.element(a,fit$alpha)
a<-table.row.end(a)
a<-table.row.start(a)
a<-table.element(a,'beta',header=TRUE)
a<-table.element(a,fit$beta)
a<-table.row.end(a)
a<-table.row.start(a)
a<-table.element(a,'gamma',header=TRUE)
a<-table.element(a,fit$gamma)
a<-table.row.end(a)
a<-table.end(a)
table.save(a,file='mytable.tab')
a<-table.start()
a<-table.row.start(a)
a<-table.element(a,'Interpolation Forecasts of Exponential Smoothing',4,TRUE)
a<-table.row.end(a)
a<-table.row.start(a)
a<-table.element(a,'t',header=TRUE)
a<-table.element(a,'Observed',header=TRUE)
a<-table.element(a,'Fitted',header=TRUE)
a<-table.element(a,'Residuals',header=TRUE)
a<-table.row.end(a)
for (i in 1:nxmK) {
a<-table.row.start(a)
a<-table.element(a,i+K,header=TRUE)
a<-table.element(a,x[i+K])
a<-table.element(a,fit$fitted[i,'xhat'])
a<-table.element(a,myresid[i])
a<-table.row.end(a)
}
a<-table.end(a)
table.save(a,file='mytable1.tab')
a<-table.start()
a<-table.row.start(a)
a<-table.element(a,'Extrapolation Forecasts of Exponential Smoothing',4,TRUE)
a<-table.row.end(a)
a<-table.row.start(a)
a<-table.element(a,'t',header=TRUE)
a<-table.element(a,'Forecast',header=TRUE)
a<-table.element(a,'95% Lower Bound',header=TRUE)
a<-table.element(a,'95% Upper Bound',header=TRUE)
a<-table.row.end(a)
for (i in 1:np) {
a<-table.row.start(a)
a<-table.element(a,nx+i,header=TRUE)
a<-table.element(a,p[i,'fit'])
a<-table.element(a,p[i,'lwr'])
a<-table.element(a,p[i,'upr'])
a<-table.row.end(a)
}
a<-table.end(a)
table.save(a,file='mytable2.tab')