Free Statistics

of Irreproducible Research!

Author's title

Author*Unverified author*
R Software Modulerwasp_autocorrelation.wasp
Title produced by software(Partial) Autocorrelation Function
Date of computationSun, 28 Nov 2021 21:37:39 +0100
Cite this page as followsStatistical Computations at FreeStatistics.org, Office for Research Development and Education, URL https://freestatistics.org/blog/index.php?v=date/2021/Nov/28/t1638131944a9cl0s2xl1y57zl.htm/, Retrieved Sun, 12 May 2024 20:44:35 +0000
Statistical Computations at FreeStatistics.org, Office for Research Development and Education, URL https://freestatistics.org/blog/index.php?pk=319567, Retrieved Sun, 12 May 2024 20:44:35 +0000
QR Codes:

Original text written by user:
IsPrivate?No (this computation is public)
User-defined keywords
Estimated Impact70
Family? (F = Feedback message, R = changed R code, M = changed R Module, P = changed Parameters, D = changed Data)
-       [(Partial) Autocorrelation Function] [] [2021-11-28 20:37:39] [d41d8cd98f00b204e9800998ecf8427e] [Current]
Feedback Forum

Post a new message
Dataseries X:
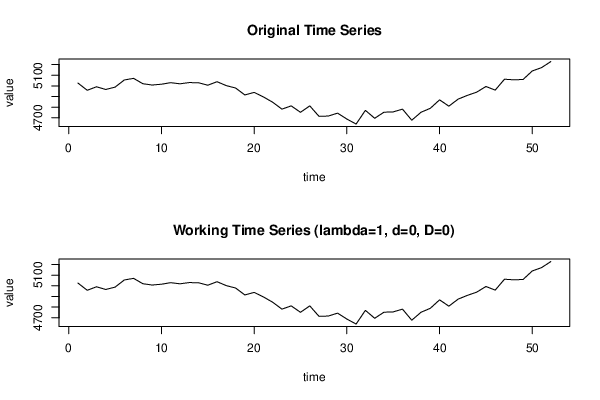
5026.7
4959.0
4991.8
4966.4
4988.4
5055.7
5070.8
5020.4
5008.4
5015.7
5030.4
5019.8
5031.2
5029.7
5006.4
5039.5
5002.6
4980.3
4915.1
4939.1
4896.5
4846.7
4782.1
4812.5
4752.1
4812.5
4714.0
4717.1
4744.4
4688.9
4641.9
4770.7
4696.2
4753.0
4756.2
4781.9
4678.1
4752.7
4789.8
4869.2
4809.8
4876.0
4911.2
4941.3
4994.4
4960.6
5062.7
5057.2
5060.2
5140.4
5171.6
5228.7


Summary of computational transaction
Raw Input view raw input (R code)
Raw Outputview raw output of R engine
Computing time0 seconds
R ServerBig Analytics Cloud Computing Center

\begin{tabular}{lllllllll}
\hline
Summary of computational transaction \tabularnewline
Raw Input view raw input (R code)  \tabularnewline
Raw Outputview raw output of R engine  \tabularnewline
Computing time0 seconds \tabularnewline
R ServerBig Analytics Cloud Computing Center \tabularnewline
\hline
\end{tabular}
%Source: https://freestatistics.org/blog/index.php?pk=319567&T=0

[TABLE]
[ROW]
Summary of computational transaction[/C][/ROW] [ROW]Raw Input[/C] view raw input (R code) [/C][/ROW] [ROW]Raw Output[/C]view raw output of R engine [/C][/ROW] [ROW]Computing time[/C]0 seconds[/C][/ROW] [ROW]R Server[/C]Big Analytics Cloud Computing Center[/C][/ROW] [/TABLE] Source: https://freestatistics.org/blog/index.php?pk=319567&T=0

Globally Unique Identifier (entire table): ba.freestatistics.org/blog/index.php?pk=319567&T=0

As an alternative you can also use a QR Code:  

The GUIDs for individual cells are displayed in the table below:

Summary of computational transaction
Raw Input view raw input (R code)
Raw Outputview raw output of R engine
Computing time0 seconds
R ServerBig Analytics Cloud Computing Center


Autocorrelation Function
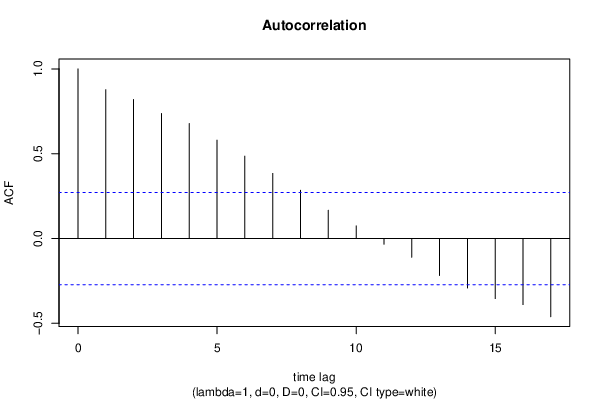
Time lag kACF(k)T-STATP-value
10.8780416.33160
20.8198045.91170
30.7367135.31251e-06
40.6777284.88725e-06
50.5802434.18425.5e-05
60.4855033.5010.00048
70.3839562.76870.00389
80.2846532.05270.022577
90.1669291.20370.117071
100.0744350.53680.296861
11-0.033167-0.23920.405956
12-0.110269-0.79520.215068
13-0.218059-1.57240.060956
14-0.291014-2.09850.020366
15-0.353934-2.55230.00684
16-0.389658-2.80990.003484
17-0.460648-3.32180.000821

\begin{tabular}{lllllllll}
\hline
Autocorrelation Function \tabularnewline
Time lag k & ACF(k) & T-STAT & P-value \tabularnewline
1 & 0.878041 & 6.3316 & 0 \tabularnewline
2 & 0.819804 & 5.9117 & 0 \tabularnewline
3 & 0.736713 & 5.3125 & 1e-06 \tabularnewline
4 & 0.677728 & 4.8872 & 5e-06 \tabularnewline
5 & 0.580243 & 4.1842 & 5.5e-05 \tabularnewline
6 & 0.485503 & 3.501 & 0.00048 \tabularnewline
7 & 0.383956 & 2.7687 & 0.00389 \tabularnewline
8 & 0.284653 & 2.0527 & 0.022577 \tabularnewline
9 & 0.166929 & 1.2037 & 0.117071 \tabularnewline
10 & 0.074435 & 0.5368 & 0.296861 \tabularnewline
11 & -0.033167 & -0.2392 & 0.405956 \tabularnewline
12 & -0.110269 & -0.7952 & 0.215068 \tabularnewline
13 & -0.218059 & -1.5724 & 0.060956 \tabularnewline
14 & -0.291014 & -2.0985 & 0.020366 \tabularnewline
15 & -0.353934 & -2.5523 & 0.00684 \tabularnewline
16 & -0.389658 & -2.8099 & 0.003484 \tabularnewline
17 & -0.460648 & -3.3218 & 0.000821 \tabularnewline
\hline
\end{tabular}
%Source: https://freestatistics.org/blog/index.php?pk=319567&T=1

[TABLE]
[ROW][C]Autocorrelation Function[/C][/ROW]
[ROW][C]Time lag k[/C][C]ACF(k)[/C][C]T-STAT[/C][C]P-value[/C][/ROW]
[ROW][C]1[/C][C]0.878041[/C][C]6.3316[/C][C]0[/C][/ROW]
[ROW][C]2[/C][C]0.819804[/C][C]5.9117[/C][C]0[/C][/ROW]
[ROW][C]3[/C][C]0.736713[/C][C]5.3125[/C][C]1e-06[/C][/ROW]
[ROW][C]4[/C][C]0.677728[/C][C]4.8872[/C][C]5e-06[/C][/ROW]
[ROW][C]5[/C][C]0.580243[/C][C]4.1842[/C][C]5.5e-05[/C][/ROW]
[ROW][C]6[/C][C]0.485503[/C][C]3.501[/C][C]0.00048[/C][/ROW]
[ROW][C]7[/C][C]0.383956[/C][C]2.7687[/C][C]0.00389[/C][/ROW]
[ROW][C]8[/C][C]0.284653[/C][C]2.0527[/C][C]0.022577[/C][/ROW]
[ROW][C]9[/C][C]0.166929[/C][C]1.2037[/C][C]0.117071[/C][/ROW]
[ROW][C]10[/C][C]0.074435[/C][C]0.5368[/C][C]0.296861[/C][/ROW]
[ROW][C]11[/C][C]-0.033167[/C][C]-0.2392[/C][C]0.405956[/C][/ROW]
[ROW][C]12[/C][C]-0.110269[/C][C]-0.7952[/C][C]0.215068[/C][/ROW]
[ROW][C]13[/C][C]-0.218059[/C][C]-1.5724[/C][C]0.060956[/C][/ROW]
[ROW][C]14[/C][C]-0.291014[/C][C]-2.0985[/C][C]0.020366[/C][/ROW]
[ROW][C]15[/C][C]-0.353934[/C][C]-2.5523[/C][C]0.00684[/C][/ROW]
[ROW][C]16[/C][C]-0.389658[/C][C]-2.8099[/C][C]0.003484[/C][/ROW]
[ROW][C]17[/C][C]-0.460648[/C][C]-3.3218[/C][C]0.000821[/C][/ROW]
[/TABLE]
Source: https://freestatistics.org/blog/index.php?pk=319567&T=1

Globally Unique Identifier (entire table): ba.freestatistics.org/blog/index.php?pk=319567&T=1

As an alternative you can also use a QR Code:  

The GUIDs for individual cells are displayed in the table below:

Autocorrelation Function
Time lag kACF(k)T-STATP-value
10.8780416.33160
20.8198045.91170
30.7367135.31251e-06
40.6777284.88725e-06
50.5802434.18425.5e-05
60.4855033.5010.00048
70.3839562.76870.00389
80.2846532.05270.022577
90.1669291.20370.117071
100.0744350.53680.296861
11-0.033167-0.23920.405956
12-0.110269-0.79520.215068
13-0.218059-1.57240.060956
14-0.291014-2.09850.020366
15-0.353934-2.55230.00684
16-0.389658-2.80990.003484
17-0.460648-3.32180.000821


Partial Autocorrelation Function
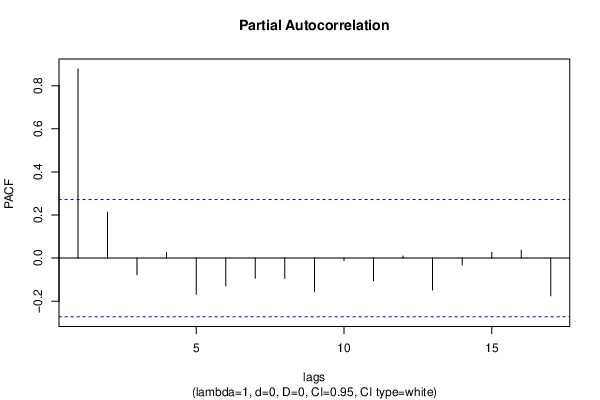
Time lag kPACF(k)T-STATP-value
10.8780416.33160
20.2132691.53790.065068
3-0.077083-0.55590.290348
40.0271450.19570.422786
5-0.167608-1.20860.116135
6-0.12855-0.9270.179109
7-0.092993-0.67060.252727
8-0.094759-0.68330.248721
9-0.155995-1.12490.1329
10-0.011952-0.08620.465826
11-0.104809-0.75580.226594
120.0093520.06740.473245
13-0.147725-1.06530.14584
14-0.031574-0.22770.410392
150.0269260.19420.4234
160.0367290.26490.396084
17-0.174977-1.26180.10633

\begin{tabular}{lllllllll}
\hline
Partial Autocorrelation Function \tabularnewline
Time lag k & PACF(k) & T-STAT & P-value \tabularnewline
1 & 0.878041 & 6.3316 & 0 \tabularnewline
2 & 0.213269 & 1.5379 & 0.065068 \tabularnewline
3 & -0.077083 & -0.5559 & 0.290348 \tabularnewline
4 & 0.027145 & 0.1957 & 0.422786 \tabularnewline
5 & -0.167608 & -1.2086 & 0.116135 \tabularnewline
6 & -0.12855 & -0.927 & 0.179109 \tabularnewline
7 & -0.092993 & -0.6706 & 0.252727 \tabularnewline
8 & -0.094759 & -0.6833 & 0.248721 \tabularnewline
9 & -0.155995 & -1.1249 & 0.1329 \tabularnewline
10 & -0.011952 & -0.0862 & 0.465826 \tabularnewline
11 & -0.104809 & -0.7558 & 0.226594 \tabularnewline
12 & 0.009352 & 0.0674 & 0.473245 \tabularnewline
13 & -0.147725 & -1.0653 & 0.14584 \tabularnewline
14 & -0.031574 & -0.2277 & 0.410392 \tabularnewline
15 & 0.026926 & 0.1942 & 0.4234 \tabularnewline
16 & 0.036729 & 0.2649 & 0.396084 \tabularnewline
17 & -0.174977 & -1.2618 & 0.10633 \tabularnewline
\hline
\end{tabular}
%Source: https://freestatistics.org/blog/index.php?pk=319567&T=2

[TABLE]
[ROW][C]Partial Autocorrelation Function[/C][/ROW]
[ROW][C]Time lag k[/C][C]PACF(k)[/C][C]T-STAT[/C][C]P-value[/C][/ROW]
[ROW][C]1[/C][C]0.878041[/C][C]6.3316[/C][C]0[/C][/ROW]
[ROW][C]2[/C][C]0.213269[/C][C]1.5379[/C][C]0.065068[/C][/ROW]
[ROW][C]3[/C][C]-0.077083[/C][C]-0.5559[/C][C]0.290348[/C][/ROW]
[ROW][C]4[/C][C]0.027145[/C][C]0.1957[/C][C]0.422786[/C][/ROW]
[ROW][C]5[/C][C]-0.167608[/C][C]-1.2086[/C][C]0.116135[/C][/ROW]
[ROW][C]6[/C][C]-0.12855[/C][C]-0.927[/C][C]0.179109[/C][/ROW]
[ROW][C]7[/C][C]-0.092993[/C][C]-0.6706[/C][C]0.252727[/C][/ROW]
[ROW][C]8[/C][C]-0.094759[/C][C]-0.6833[/C][C]0.248721[/C][/ROW]
[ROW][C]9[/C][C]-0.155995[/C][C]-1.1249[/C][C]0.1329[/C][/ROW]
[ROW][C]10[/C][C]-0.011952[/C][C]-0.0862[/C][C]0.465826[/C][/ROW]
[ROW][C]11[/C][C]-0.104809[/C][C]-0.7558[/C][C]0.226594[/C][/ROW]
[ROW][C]12[/C][C]0.009352[/C][C]0.0674[/C][C]0.473245[/C][/ROW]
[ROW][C]13[/C][C]-0.147725[/C][C]-1.0653[/C][C]0.14584[/C][/ROW]
[ROW][C]14[/C][C]-0.031574[/C][C]-0.2277[/C][C]0.410392[/C][/ROW]
[ROW][C]15[/C][C]0.026926[/C][C]0.1942[/C][C]0.4234[/C][/ROW]
[ROW][C]16[/C][C]0.036729[/C][C]0.2649[/C][C]0.396084[/C][/ROW]
[ROW][C]17[/C][C]-0.174977[/C][C]-1.2618[/C][C]0.10633[/C][/ROW]
[/TABLE]
Source: https://freestatistics.org/blog/index.php?pk=319567&T=2

Globally Unique Identifier (entire table): ba.freestatistics.org/blog/index.php?pk=319567&T=2

As an alternative you can also use a QR Code:  

The GUIDs for individual cells are displayed in the table below:

Partial Autocorrelation Function
Time lag kPACF(k)T-STATP-value
10.8780416.33160
20.2132691.53790.065068
3-0.077083-0.55590.290348
40.0271450.19570.422786
5-0.167608-1.20860.116135
6-0.12855-0.9270.179109
7-0.092993-0.67060.252727
8-0.094759-0.68330.248721
9-0.155995-1.12490.1329
10-0.011952-0.08620.465826
11-0.104809-0.75580.226594
120.0093520.06740.473245
13-0.147725-1.06530.14584
14-0.031574-0.22770.410392
150.0269260.19420.4234
160.0367290.26490.396084
17-0.174977-1.26180.10633


Parameters (Session):
Parameters (R input):
par1 = Default ; par2 = 1 ; par3 = 0 ; par4 = 0 ; par5 = 12 ; par6 = White Noise ; par7 = 0.95 ; par8 = ;
R code (references can be found in the software module):
par8 <- ''
par7 <- '0.95'
par6 <- 'White Noise'
par5 <- '12'
par4 <- '0'
par3 <- '0'
par2 <- '1'
par1 <- 'Default'
if (par1 == 'Default') {
par1 = 10*log10(length(x))
} else {
par1 <- as.numeric(par1)
}
par2 <- as.numeric(par2)
par3 <- as.numeric(par3)
par4 <- as.numeric(par4)
par5 <- as.numeric(par5)
if (par6 == 'White Noise') par6 <- 'white' else par6 <- 'ma'
par7 <- as.numeric(par7)
if (par8 != '') par8 <- as.numeric(par8)
x <- na.omit(x)
ox <- x
if (par8 == '') {
if (par2 == 0) {
x <- log(x)
} else {
x <- (x ^ par2 - 1) / par2
}
} else {
x <- log(x,base=par8)
}
if (par3 > 0) x <- diff(x,lag=1,difference=par3)
if (par4 > 0) x <- diff(x,lag=par5,difference=par4)
bitmap(file='picts.png')
op <- par(mfrow=c(2,1))
plot(ox,type='l',main='Original Time Series',xlab='time',ylab='value')
if (par8=='') {
mytitle <- paste('Working Time Series (lambda=',par2,', d=',par3,', D=',par4,')',sep='')
mysub <- paste('(lambda=',par2,', d=',par3,', D=',par4,', CI=', par7, ', CI type=',par6,')',sep='')
} else {
mytitle <- paste('Working Time Series (base=',par8,', d=',par3,', D=',par4,')',sep='')
mysub <- paste('(base=',par8,', d=',par3,', D=',par4,', CI=', par7, ', CI type=',par6,')',sep='')
}
plot(x,type='l', main=mytitle,xlab='time',ylab='value')
par(op)
dev.off()
bitmap(file='pic1.png')
racf <- acf(x, par1, main='Autocorrelation', xlab='time lag', ylab='ACF', ci.type=par6, ci=par7, sub=mysub)
dev.off()
bitmap(file='pic2.png')
rpacf <- pacf(x,par1,main='Partial Autocorrelation',xlab='lags',ylab='PACF',sub=mysub)
dev.off()
(myacf <- c(racf$acf))
(mypacf <- c(rpacf$acf))
lengthx <- length(x)
sqrtn <- sqrt(lengthx)
load(file='createtable')
a<-table.start()
a<-table.row.start(a)
a<-table.element(a,'Autocorrelation Function',4,TRUE)
a<-table.row.end(a)
a<-table.row.start(a)
a<-table.element(a,'Time lag k',header=TRUE)
a<-table.element(a,'ACF(k)',header=TRUE)
a<-table.element(a,'T-STAT',header=TRUE)
a<-table.element(a,'P-value',header=TRUE)
a<-table.row.end(a)
for (i in 2:(par1+1)) {
a<-table.row.start(a)
a<-table.element(a,i-1,header=TRUE)
a<-table.element(a,round(myacf[i],6))
mytstat <- myacf[i]*sqrtn
a<-table.element(a,round(mytstat,4))
a<-table.element(a,round(1-pt(abs(mytstat),lengthx),6))
a<-table.row.end(a)
}
a<-table.end(a)
table.save(a,file='mytable.tab')
a<-table.start()
a<-table.row.start(a)
a<-table.element(a,'Partial Autocorrelation Function',4,TRUE)
a<-table.row.end(a)
a<-table.row.start(a)
a<-table.element(a,'Time lag k',header=TRUE)
a<-table.element(a,'PACF(k)',header=TRUE)
a<-table.element(a,'T-STAT',header=TRUE)
a<-table.element(a,'P-value',header=TRUE)
a<-table.row.end(a)
for (i in 1:par1) {
a<-table.row.start(a)
a<-table.element(a,i,header=TRUE)
a<-table.element(a,round(mypacf[i],6))
mytstat <- mypacf[i]*sqrtn
a<-table.element(a,round(mytstat,4))
a<-table.element(a,round(1-pt(abs(mytstat),lengthx),6))
a<-table.row.end(a)
}
a<-table.end(a)
table.save(a,file='mytable1.tab')