Free Statistics

of Irreproducible Research!

Author's title

Author*Unverified author*
R Software Modulerwasp_autocorrelation.wasp
Title produced by software(Partial) Autocorrelation Function
Date of computationSat, 06 Nov 2021 23:36:34 +0100
Cite this page as followsStatistical Computations at FreeStatistics.org, Office for Research Development and Education, URL https://freestatistics.org/blog/index.php?v=date/2021/Nov/06/t1636238383t1mtlicybg572an.htm/, Retrieved Sat, 11 May 2024 16:40:44 +0000
Statistical Computations at FreeStatistics.org, Office for Research Development and Education, URL https://freestatistics.org/blog/index.php?pk=319551, Retrieved Sat, 11 May 2024 16:40:44 +0000
QR Codes:

Original text written by user:
IsPrivate?No (this computation is public)
User-defined keywords
Estimated Impact73
Family? (F = Feedback message, R = changed R code, M = changed R Module, P = changed Parameters, D = changed Data)
-       [(Partial) Autocorrelation Function] [] [2021-11-06 22:36:34] [d41d8cd98f00b204e9800998ecf8427e] [Current]
Feedback Forum

Post a new message
Dataseries X:
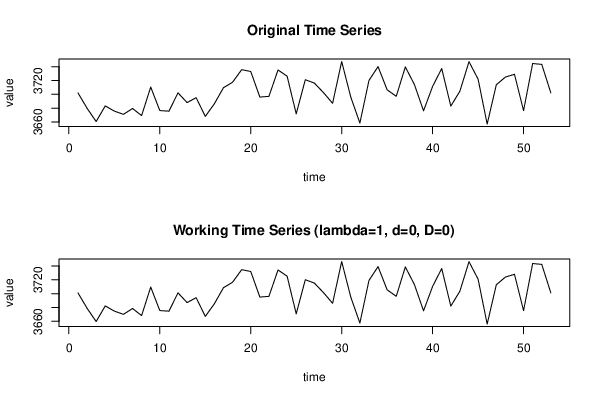
3702.151903
3679.887047
3660.505625
3683.252751
3675.697609
3670.973587
3679.486118
3669.205527
3710.558833
3676.490738
3675.543014
3702.151903
3688.035079
3695.144943
3667.973859
3686.339460
3709.639741
3717.554673
3735.740727
3733.152061
3696.058789
3697.074459
3735.355528
3726.344627
3671.748116
3721.194104
3716.300808
3702.471641
3687.004024
3747.558860
3696.031165
3658.376770
3720.073275
3740.201539
3706.516199
3697.171851
3739.768436
3714.100925
3676.095441
3711.520367
3737.422105
3682.913745
3704.649182
3747.365166
3722.028871
3656.899591
3713.751997
3725.051113
3729.029582
3676.347112
3744.705574
3743.417664
3702.151903


Summary of computational transaction
Raw Input view raw input (R code)
Raw Outputview raw output of R engine
Computing time0 seconds
R ServerBig Analytics Cloud Computing Center
R Framework error message
Warning: there are blank lines in the 'Data' field.
Please, use NA for missing data - blank lines are simply
 deleted and are NOT treated as missing values.

\begin{tabular}{lllllllll}
\hline
Summary of computational transaction \tabularnewline
Raw Input view raw input (R code)  \tabularnewline
Raw Outputview raw output of R engine  \tabularnewline
Computing time0 seconds \tabularnewline
R ServerBig Analytics Cloud Computing Center \tabularnewline
R Framework error message & 
Warning: there are blank lines in the 'Data' field.
Please, use NA for missing data - blank lines are simply
 deleted and are NOT treated as missing values.
\tabularnewline \hline \end{tabular} %Source: https://freestatistics.org/blog/index.php?pk=319551&T=0

[TABLE]
[ROW]
Summary of computational transaction[/C][/ROW] [ROW]Raw Input[/C] view raw input (R code) [/C][/ROW] [ROW]Raw Output[/C]view raw output of R engine [/C][/ROW] [ROW]Computing time[/C]0 seconds[/C][/ROW] [ROW]R Server[/C]Big Analytics Cloud Computing Center[/C][/ROW] [ROW]R Framework error message[/C][C]
Warning: there are blank lines in the 'Data' field.
Please, use NA for missing data - blank lines are simply
 deleted and are NOT treated as missing values.
[/C][/ROW] [/TABLE] Source: https://freestatistics.org/blog/index.php?pk=319551&T=0

Globally Unique Identifier (entire table): ba.freestatistics.org/blog/index.php?pk=319551&T=0

As an alternative you can also use a QR Code:  

The GUIDs for individual cells are displayed in the table below:

Summary of computational transaction
Raw Input view raw input (R code)
Raw Outputview raw output of R engine
Computing time0 seconds
R ServerBig Analytics Cloud Computing Center
R Framework error message
Warning: there are blank lines in the 'Data' field.
Please, use NA for missing data - blank lines are simply
 deleted and are NOT treated as missing values.


Autocorrelation Function
Time lag kACF(k)T-STATP-value
10.1614491.17540.122551
2-0.172189-1.25360.107752
30.3716982.7060.00457
40.4586413.3390.000772
5-0.172794-1.2580.10696
6-0.043373-0.31580.376712
70.4749723.45790.000541
80.0896420.65260.258415
9-0.264349-1.92450.029835
100.2355881.71510.046084
110.2758012.00790.024884
12-0.264465-1.92530.02978
13-0.176162-1.28250.102627
140.2736171.9920.025769
15-0.012019-0.08750.465302
16-0.279271-2.03310.023531
170.0849770.61860.269401
180.1513021.10150.137829
19-0.147492-1.07380.143898
20-0.220732-1.6070.057003
210.1796661.3080.098261
22-0.018438-0.13420.446863
23-0.161089-1.17270.123071
240.0152950.11140.455879
250.1331320.96920.16842
26-0.066189-0.48190.315944
27-0.139301-1.01410.157565
280.0275070.20030.421023
290.0283230.20620.418714
30-0.095712-0.69680.244488
31-0.040732-0.29650.38399
320.0143920.10480.458474
33-0.049002-0.35670.361353
34-0.084343-0.6140.270912
35-0.018437-0.13420.446867
36-0.069277-0.50430.308055
37-0.121045-0.88120.191089
38-0.106363-0.77430.221087
39-0.043109-0.31380.377439
40-0.023115-0.16830.433503
41-0.149302-1.08690.140992
42-0.068043-0.49540.311198
43-0.017599-0.12810.449267
44-0.058935-0.42910.334813
45-0.091714-0.66770.253614
46-0.101326-0.73770.231986
47-0.039955-0.29090.386141
48-0.056351-0.41020.341641
49-0.076275-0.55530.290515
50-0.02705-0.19690.422318
51-0.000485-0.00350.498599
522.8e-052e-040.499919
53NANANA
54NANANA
55NANANA
56NANANA
57NANANA
58NANANA
59NANANA
60NANANA

\begin{tabular}{lllllllll}
\hline
Autocorrelation Function \tabularnewline
Time lag k & ACF(k) & T-STAT & P-value \tabularnewline
1 & 0.161449 & 1.1754 & 0.122551 \tabularnewline
2 & -0.172189 & -1.2536 & 0.107752 \tabularnewline
3 & 0.371698 & 2.706 & 0.00457 \tabularnewline
4 & 0.458641 & 3.339 & 0.000772 \tabularnewline
5 & -0.172794 & -1.258 & 0.10696 \tabularnewline
6 & -0.043373 & -0.3158 & 0.376712 \tabularnewline
7 & 0.474972 & 3.4579 & 0.000541 \tabularnewline
8 & 0.089642 & 0.6526 & 0.258415 \tabularnewline
9 & -0.264349 & -1.9245 & 0.029835 \tabularnewline
10 & 0.235588 & 1.7151 & 0.046084 \tabularnewline
11 & 0.275801 & 2.0079 & 0.024884 \tabularnewline
12 & -0.264465 & -1.9253 & 0.02978 \tabularnewline
13 & -0.176162 & -1.2825 & 0.102627 \tabularnewline
14 & 0.273617 & 1.992 & 0.025769 \tabularnewline
15 & -0.012019 & -0.0875 & 0.465302 \tabularnewline
16 & -0.279271 & -2.0331 & 0.023531 \tabularnewline
17 & 0.084977 & 0.6186 & 0.269401 \tabularnewline
18 & 0.151302 & 1.1015 & 0.137829 \tabularnewline
19 & -0.147492 & -1.0738 & 0.143898 \tabularnewline
20 & -0.220732 & -1.607 & 0.057003 \tabularnewline
21 & 0.179666 & 1.308 & 0.098261 \tabularnewline
22 & -0.018438 & -0.1342 & 0.446863 \tabularnewline
23 & -0.161089 & -1.1727 & 0.123071 \tabularnewline
24 & 0.015295 & 0.1114 & 0.455879 \tabularnewline
25 & 0.133132 & 0.9692 & 0.16842 \tabularnewline
26 & -0.066189 & -0.4819 & 0.315944 \tabularnewline
27 & -0.139301 & -1.0141 & 0.157565 \tabularnewline
28 & 0.027507 & 0.2003 & 0.421023 \tabularnewline
29 & 0.028323 & 0.2062 & 0.418714 \tabularnewline
30 & -0.095712 & -0.6968 & 0.244488 \tabularnewline
31 & -0.040732 & -0.2965 & 0.38399 \tabularnewline
32 & 0.014392 & 0.1048 & 0.458474 \tabularnewline
33 & -0.049002 & -0.3567 & 0.361353 \tabularnewline
34 & -0.084343 & -0.614 & 0.270912 \tabularnewline
35 & -0.018437 & -0.1342 & 0.446867 \tabularnewline
36 & -0.069277 & -0.5043 & 0.308055 \tabularnewline
37 & -0.121045 & -0.8812 & 0.191089 \tabularnewline
38 & -0.106363 & -0.7743 & 0.221087 \tabularnewline
39 & -0.043109 & -0.3138 & 0.377439 \tabularnewline
40 & -0.023115 & -0.1683 & 0.433503 \tabularnewline
41 & -0.149302 & -1.0869 & 0.140992 \tabularnewline
42 & -0.068043 & -0.4954 & 0.311198 \tabularnewline
43 & -0.017599 & -0.1281 & 0.449267 \tabularnewline
44 & -0.058935 & -0.4291 & 0.334813 \tabularnewline
45 & -0.091714 & -0.6677 & 0.253614 \tabularnewline
46 & -0.101326 & -0.7377 & 0.231986 \tabularnewline
47 & -0.039955 & -0.2909 & 0.386141 \tabularnewline
48 & -0.056351 & -0.4102 & 0.341641 \tabularnewline
49 & -0.076275 & -0.5553 & 0.290515 \tabularnewline
50 & -0.02705 & -0.1969 & 0.422318 \tabularnewline
51 & -0.000485 & -0.0035 & 0.498599 \tabularnewline
52 & 2.8e-05 & 2e-04 & 0.499919 \tabularnewline
53 & NA & NA & NA \tabularnewline
54 & NA & NA & NA \tabularnewline
55 & NA & NA & NA \tabularnewline
56 & NA & NA & NA \tabularnewline
57 & NA & NA & NA \tabularnewline
58 & NA & NA & NA \tabularnewline
59 & NA & NA & NA \tabularnewline
60 & NA & NA & NA \tabularnewline
\hline
\end{tabular}
%Source: https://freestatistics.org/blog/index.php?pk=319551&T=1

[TABLE]
[ROW][C]Autocorrelation Function[/C][/ROW]
[ROW][C]Time lag k[/C][C]ACF(k)[/C][C]T-STAT[/C][C]P-value[/C][/ROW]
[ROW][C]1[/C][C]0.161449[/C][C]1.1754[/C][C]0.122551[/C][/ROW]
[ROW][C]2[/C][C]-0.172189[/C][C]-1.2536[/C][C]0.107752[/C][/ROW]
[ROW][C]3[/C][C]0.371698[/C][C]2.706[/C][C]0.00457[/C][/ROW]
[ROW][C]4[/C][C]0.458641[/C][C]3.339[/C][C]0.000772[/C][/ROW]
[ROW][C]5[/C][C]-0.172794[/C][C]-1.258[/C][C]0.10696[/C][/ROW]
[ROW][C]6[/C][C]-0.043373[/C][C]-0.3158[/C][C]0.376712[/C][/ROW]
[ROW][C]7[/C][C]0.474972[/C][C]3.4579[/C][C]0.000541[/C][/ROW]
[ROW][C]8[/C][C]0.089642[/C][C]0.6526[/C][C]0.258415[/C][/ROW]
[ROW][C]9[/C][C]-0.264349[/C][C]-1.9245[/C][C]0.029835[/C][/ROW]
[ROW][C]10[/C][C]0.235588[/C][C]1.7151[/C][C]0.046084[/C][/ROW]
[ROW][C]11[/C][C]0.275801[/C][C]2.0079[/C][C]0.024884[/C][/ROW]
[ROW][C]12[/C][C]-0.264465[/C][C]-1.9253[/C][C]0.02978[/C][/ROW]
[ROW][C]13[/C][C]-0.176162[/C][C]-1.2825[/C][C]0.102627[/C][/ROW]
[ROW][C]14[/C][C]0.273617[/C][C]1.992[/C][C]0.025769[/C][/ROW]
[ROW][C]15[/C][C]-0.012019[/C][C]-0.0875[/C][C]0.465302[/C][/ROW]
[ROW][C]16[/C][C]-0.279271[/C][C]-2.0331[/C][C]0.023531[/C][/ROW]
[ROW][C]17[/C][C]0.084977[/C][C]0.6186[/C][C]0.269401[/C][/ROW]
[ROW][C]18[/C][C]0.151302[/C][C]1.1015[/C][C]0.137829[/C][/ROW]
[ROW][C]19[/C][C]-0.147492[/C][C]-1.0738[/C][C]0.143898[/C][/ROW]
[ROW][C]20[/C][C]-0.220732[/C][C]-1.607[/C][C]0.057003[/C][/ROW]
[ROW][C]21[/C][C]0.179666[/C][C]1.308[/C][C]0.098261[/C][/ROW]
[ROW][C]22[/C][C]-0.018438[/C][C]-0.1342[/C][C]0.446863[/C][/ROW]
[ROW][C]23[/C][C]-0.161089[/C][C]-1.1727[/C][C]0.123071[/C][/ROW]
[ROW][C]24[/C][C]0.015295[/C][C]0.1114[/C][C]0.455879[/C][/ROW]
[ROW][C]25[/C][C]0.133132[/C][C]0.9692[/C][C]0.16842[/C][/ROW]
[ROW][C]26[/C][C]-0.066189[/C][C]-0.4819[/C][C]0.315944[/C][/ROW]
[ROW][C]27[/C][C]-0.139301[/C][C]-1.0141[/C][C]0.157565[/C][/ROW]
[ROW][C]28[/C][C]0.027507[/C][C]0.2003[/C][C]0.421023[/C][/ROW]
[ROW][C]29[/C][C]0.028323[/C][C]0.2062[/C][C]0.418714[/C][/ROW]
[ROW][C]30[/C][C]-0.095712[/C][C]-0.6968[/C][C]0.244488[/C][/ROW]
[ROW][C]31[/C][C]-0.040732[/C][C]-0.2965[/C][C]0.38399[/C][/ROW]
[ROW][C]32[/C][C]0.014392[/C][C]0.1048[/C][C]0.458474[/C][/ROW]
[ROW][C]33[/C][C]-0.049002[/C][C]-0.3567[/C][C]0.361353[/C][/ROW]
[ROW][C]34[/C][C]-0.084343[/C][C]-0.614[/C][C]0.270912[/C][/ROW]
[ROW][C]35[/C][C]-0.018437[/C][C]-0.1342[/C][C]0.446867[/C][/ROW]
[ROW][C]36[/C][C]-0.069277[/C][C]-0.5043[/C][C]0.308055[/C][/ROW]
[ROW][C]37[/C][C]-0.121045[/C][C]-0.8812[/C][C]0.191089[/C][/ROW]
[ROW][C]38[/C][C]-0.106363[/C][C]-0.7743[/C][C]0.221087[/C][/ROW]
[ROW][C]39[/C][C]-0.043109[/C][C]-0.3138[/C][C]0.377439[/C][/ROW]
[ROW][C]40[/C][C]-0.023115[/C][C]-0.1683[/C][C]0.433503[/C][/ROW]
[ROW][C]41[/C][C]-0.149302[/C][C]-1.0869[/C][C]0.140992[/C][/ROW]
[ROW][C]42[/C][C]-0.068043[/C][C]-0.4954[/C][C]0.311198[/C][/ROW]
[ROW][C]43[/C][C]-0.017599[/C][C]-0.1281[/C][C]0.449267[/C][/ROW]
[ROW][C]44[/C][C]-0.058935[/C][C]-0.4291[/C][C]0.334813[/C][/ROW]
[ROW][C]45[/C][C]-0.091714[/C][C]-0.6677[/C][C]0.253614[/C][/ROW]
[ROW][C]46[/C][C]-0.101326[/C][C]-0.7377[/C][C]0.231986[/C][/ROW]
[ROW][C]47[/C][C]-0.039955[/C][C]-0.2909[/C][C]0.386141[/C][/ROW]
[ROW][C]48[/C][C]-0.056351[/C][C]-0.4102[/C][C]0.341641[/C][/ROW]
[ROW][C]49[/C][C]-0.076275[/C][C]-0.5553[/C][C]0.290515[/C][/ROW]
[ROW][C]50[/C][C]-0.02705[/C][C]-0.1969[/C][C]0.422318[/C][/ROW]
[ROW][C]51[/C][C]-0.000485[/C][C]-0.0035[/C][C]0.498599[/C][/ROW]
[ROW][C]52[/C][C]2.8e-05[/C][C]2e-04[/C][C]0.499919[/C][/ROW]
[ROW][C]53[/C][C]NA[/C][C]NA[/C][C]NA[/C][/ROW]
[ROW][C]54[/C][C]NA[/C][C]NA[/C][C]NA[/C][/ROW]
[ROW][C]55[/C][C]NA[/C][C]NA[/C][C]NA[/C][/ROW]
[ROW][C]56[/C][C]NA[/C][C]NA[/C][C]NA[/C][/ROW]
[ROW][C]57[/C][C]NA[/C][C]NA[/C][C]NA[/C][/ROW]
[ROW][C]58[/C][C]NA[/C][C]NA[/C][C]NA[/C][/ROW]
[ROW][C]59[/C][C]NA[/C][C]NA[/C][C]NA[/C][/ROW]
[ROW][C]60[/C][C]NA[/C][C]NA[/C][C]NA[/C][/ROW]
[/TABLE]
Source: https://freestatistics.org/blog/index.php?pk=319551&T=1

Globally Unique Identifier (entire table): ba.freestatistics.org/blog/index.php?pk=319551&T=1

As an alternative you can also use a QR Code:  

The GUIDs for individual cells are displayed in the table below:

Autocorrelation Function
Time lag kACF(k)T-STATP-value
10.1614491.17540.122551
2-0.172189-1.25360.107752
30.3716982.7060.00457
40.4586413.3390.000772
5-0.172794-1.2580.10696
6-0.043373-0.31580.376712
70.4749723.45790.000541
80.0896420.65260.258415
9-0.264349-1.92450.029835
100.2355881.71510.046084
110.2758012.00790.024884
12-0.264465-1.92530.02978
13-0.176162-1.28250.102627
140.2736171.9920.025769
15-0.012019-0.08750.465302
16-0.279271-2.03310.023531
170.0849770.61860.269401
180.1513021.10150.137829
19-0.147492-1.07380.143898
20-0.220732-1.6070.057003
210.1796661.3080.098261
22-0.018438-0.13420.446863
23-0.161089-1.17270.123071
240.0152950.11140.455879
250.1331320.96920.16842
26-0.066189-0.48190.315944
27-0.139301-1.01410.157565
280.0275070.20030.421023
290.0283230.20620.418714
30-0.095712-0.69680.244488
31-0.040732-0.29650.38399
320.0143920.10480.458474
33-0.049002-0.35670.361353
34-0.084343-0.6140.270912
35-0.018437-0.13420.446867
36-0.069277-0.50430.308055
37-0.121045-0.88120.191089
38-0.106363-0.77430.221087
39-0.043109-0.31380.377439
40-0.023115-0.16830.433503
41-0.149302-1.08690.140992
42-0.068043-0.49540.311198
43-0.017599-0.12810.449267
44-0.058935-0.42910.334813
45-0.091714-0.66770.253614
46-0.101326-0.73770.231986
47-0.039955-0.29090.386141
48-0.056351-0.41020.341641
49-0.076275-0.55530.290515
50-0.02705-0.19690.422318
51-0.000485-0.00350.498599
522.8e-052e-040.499919
53NANANA
54NANANA
55NANANA
56NANANA
57NANANA
58NANANA
59NANANA
60NANANA


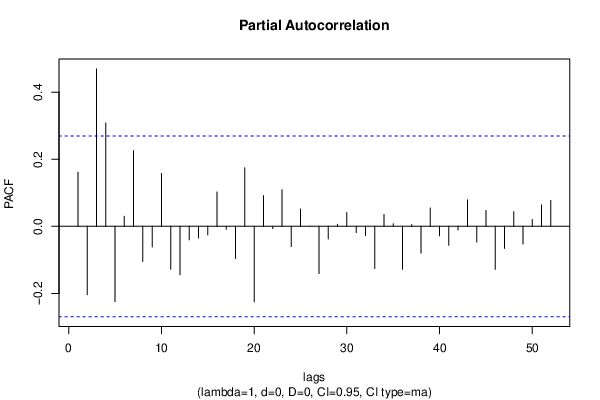
Partial Autocorrelation Function
Time lag kPACF(k)T-STATP-value
10.1614491.17540.122551
2-0.203561-1.48190.072138
30.4691863.41570.000614
40.3082362.2440.014517
5-0.224566-1.63490.054002
60.0301080.21920.413672
70.2256291.64260.053193
8-0.104774-0.76280.224492
9-0.061245-0.44590.328752
100.1574451.14620.128427
11-0.127904-0.93120.177998
12-0.143993-1.04830.149632
13-0.040083-0.29180.385787
14-0.034826-0.25350.400417
15-0.025355-0.18460.427129
160.1020920.74320.23031
17-0.008421-0.06130.475674
18-0.095641-0.69630.244649
190.17441.26970.104877
20-0.224768-1.63630.053848
210.0914830.6660.254148
22-0.006728-0.0490.480558
230.1091780.79480.21513
24-0.060375-0.43950.331031
250.0515450.37530.354484
261.1e-051e-040.499967
27-0.140944-1.02610.154756
28-0.037626-0.27390.392605
290.0059090.0430.482925
300.041080.29910.383028
31-0.018667-0.13590.446209
32-0.02698-0.19640.422517
33-0.125948-0.91690.181671
340.0350630.25530.399755
350.0074370.05410.478514
36-0.128187-0.93320.177471
370.0052280.03810.484892
38-0.079661-0.57990.282205
390.0544150.39610.346792
40-0.028271-0.20580.418862
41-0.056282-0.40970.341824
42-0.010551-0.07680.469531
430.0790350.57540.283733
44-0.046996-0.34210.366802
450.0469540.34180.366915
46-0.128257-0.93370.177341
47-0.065445-0.47640.317857
480.0434960.31670.376375
49-0.052677-0.38350.351444
500.0203210.14790.441477
510.0639670.46570.321674
520.0771810.56190.28828
53NANANA
54NANANA
55NANANA
56NANANA
57NANANA
58NANANA
59NANANA
60NANANA

\begin{tabular}{lllllllll}
\hline
Partial Autocorrelation Function \tabularnewline
Time lag k & PACF(k) & T-STAT & P-value \tabularnewline
1 & 0.161449 & 1.1754 & 0.122551 \tabularnewline
2 & -0.203561 & -1.4819 & 0.072138 \tabularnewline
3 & 0.469186 & 3.4157 & 0.000614 \tabularnewline
4 & 0.308236 & 2.244 & 0.014517 \tabularnewline
5 & -0.224566 & -1.6349 & 0.054002 \tabularnewline
6 & 0.030108 & 0.2192 & 0.413672 \tabularnewline
7 & 0.225629 & 1.6426 & 0.053193 \tabularnewline
8 & -0.104774 & -0.7628 & 0.224492 \tabularnewline
9 & -0.061245 & -0.4459 & 0.328752 \tabularnewline
10 & 0.157445 & 1.1462 & 0.128427 \tabularnewline
11 & -0.127904 & -0.9312 & 0.177998 \tabularnewline
12 & -0.143993 & -1.0483 & 0.149632 \tabularnewline
13 & -0.040083 & -0.2918 & 0.385787 \tabularnewline
14 & -0.034826 & -0.2535 & 0.400417 \tabularnewline
15 & -0.025355 & -0.1846 & 0.427129 \tabularnewline
16 & 0.102092 & 0.7432 & 0.23031 \tabularnewline
17 & -0.008421 & -0.0613 & 0.475674 \tabularnewline
18 & -0.095641 & -0.6963 & 0.244649 \tabularnewline
19 & 0.1744 & 1.2697 & 0.104877 \tabularnewline
20 & -0.224768 & -1.6363 & 0.053848 \tabularnewline
21 & 0.091483 & 0.666 & 0.254148 \tabularnewline
22 & -0.006728 & -0.049 & 0.480558 \tabularnewline
23 & 0.109178 & 0.7948 & 0.21513 \tabularnewline
24 & -0.060375 & -0.4395 & 0.331031 \tabularnewline
25 & 0.051545 & 0.3753 & 0.354484 \tabularnewline
26 & 1.1e-05 & 1e-04 & 0.499967 \tabularnewline
27 & -0.140944 & -1.0261 & 0.154756 \tabularnewline
28 & -0.037626 & -0.2739 & 0.392605 \tabularnewline
29 & 0.005909 & 0.043 & 0.482925 \tabularnewline
30 & 0.04108 & 0.2991 & 0.383028 \tabularnewline
31 & -0.018667 & -0.1359 & 0.446209 \tabularnewline
32 & -0.02698 & -0.1964 & 0.422517 \tabularnewline
33 & -0.125948 & -0.9169 & 0.181671 \tabularnewline
34 & 0.035063 & 0.2553 & 0.399755 \tabularnewline
35 & 0.007437 & 0.0541 & 0.478514 \tabularnewline
36 & -0.128187 & -0.9332 & 0.177471 \tabularnewline
37 & 0.005228 & 0.0381 & 0.484892 \tabularnewline
38 & -0.079661 & -0.5799 & 0.282205 \tabularnewline
39 & 0.054415 & 0.3961 & 0.346792 \tabularnewline
40 & -0.028271 & -0.2058 & 0.418862 \tabularnewline
41 & -0.056282 & -0.4097 & 0.341824 \tabularnewline
42 & -0.010551 & -0.0768 & 0.469531 \tabularnewline
43 & 0.079035 & 0.5754 & 0.283733 \tabularnewline
44 & -0.046996 & -0.3421 & 0.366802 \tabularnewline
45 & 0.046954 & 0.3418 & 0.366915 \tabularnewline
46 & -0.128257 & -0.9337 & 0.177341 \tabularnewline
47 & -0.065445 & -0.4764 & 0.317857 \tabularnewline
48 & 0.043496 & 0.3167 & 0.376375 \tabularnewline
49 & -0.052677 & -0.3835 & 0.351444 \tabularnewline
50 & 0.020321 & 0.1479 & 0.441477 \tabularnewline
51 & 0.063967 & 0.4657 & 0.321674 \tabularnewline
52 & 0.077181 & 0.5619 & 0.28828 \tabularnewline
53 & NA & NA & NA \tabularnewline
54 & NA & NA & NA \tabularnewline
55 & NA & NA & NA \tabularnewline
56 & NA & NA & NA \tabularnewline
57 & NA & NA & NA \tabularnewline
58 & NA & NA & NA \tabularnewline
59 & NA & NA & NA \tabularnewline
60 & NA & NA & NA \tabularnewline
\hline
\end{tabular}
%Source: https://freestatistics.org/blog/index.php?pk=319551&T=2

[TABLE]
[ROW][C]Partial Autocorrelation Function[/C][/ROW]
[ROW][C]Time lag k[/C][C]PACF(k)[/C][C]T-STAT[/C][C]P-value[/C][/ROW]
[ROW][C]1[/C][C]0.161449[/C][C]1.1754[/C][C]0.122551[/C][/ROW]
[ROW][C]2[/C][C]-0.203561[/C][C]-1.4819[/C][C]0.072138[/C][/ROW]
[ROW][C]3[/C][C]0.469186[/C][C]3.4157[/C][C]0.000614[/C][/ROW]
[ROW][C]4[/C][C]0.308236[/C][C]2.244[/C][C]0.014517[/C][/ROW]
[ROW][C]5[/C][C]-0.224566[/C][C]-1.6349[/C][C]0.054002[/C][/ROW]
[ROW][C]6[/C][C]0.030108[/C][C]0.2192[/C][C]0.413672[/C][/ROW]
[ROW][C]7[/C][C]0.225629[/C][C]1.6426[/C][C]0.053193[/C][/ROW]
[ROW][C]8[/C][C]-0.104774[/C][C]-0.7628[/C][C]0.224492[/C][/ROW]
[ROW][C]9[/C][C]-0.061245[/C][C]-0.4459[/C][C]0.328752[/C][/ROW]
[ROW][C]10[/C][C]0.157445[/C][C]1.1462[/C][C]0.128427[/C][/ROW]
[ROW][C]11[/C][C]-0.127904[/C][C]-0.9312[/C][C]0.177998[/C][/ROW]
[ROW][C]12[/C][C]-0.143993[/C][C]-1.0483[/C][C]0.149632[/C][/ROW]
[ROW][C]13[/C][C]-0.040083[/C][C]-0.2918[/C][C]0.385787[/C][/ROW]
[ROW][C]14[/C][C]-0.034826[/C][C]-0.2535[/C][C]0.400417[/C][/ROW]
[ROW][C]15[/C][C]-0.025355[/C][C]-0.1846[/C][C]0.427129[/C][/ROW]
[ROW][C]16[/C][C]0.102092[/C][C]0.7432[/C][C]0.23031[/C][/ROW]
[ROW][C]17[/C][C]-0.008421[/C][C]-0.0613[/C][C]0.475674[/C][/ROW]
[ROW][C]18[/C][C]-0.095641[/C][C]-0.6963[/C][C]0.244649[/C][/ROW]
[ROW][C]19[/C][C]0.1744[/C][C]1.2697[/C][C]0.104877[/C][/ROW]
[ROW][C]20[/C][C]-0.224768[/C][C]-1.6363[/C][C]0.053848[/C][/ROW]
[ROW][C]21[/C][C]0.091483[/C][C]0.666[/C][C]0.254148[/C][/ROW]
[ROW][C]22[/C][C]-0.006728[/C][C]-0.049[/C][C]0.480558[/C][/ROW]
[ROW][C]23[/C][C]0.109178[/C][C]0.7948[/C][C]0.21513[/C][/ROW]
[ROW][C]24[/C][C]-0.060375[/C][C]-0.4395[/C][C]0.331031[/C][/ROW]
[ROW][C]25[/C][C]0.051545[/C][C]0.3753[/C][C]0.354484[/C][/ROW]
[ROW][C]26[/C][C]1.1e-05[/C][C]1e-04[/C][C]0.499967[/C][/ROW]
[ROW][C]27[/C][C]-0.140944[/C][C]-1.0261[/C][C]0.154756[/C][/ROW]
[ROW][C]28[/C][C]-0.037626[/C][C]-0.2739[/C][C]0.392605[/C][/ROW]
[ROW][C]29[/C][C]0.005909[/C][C]0.043[/C][C]0.482925[/C][/ROW]
[ROW][C]30[/C][C]0.04108[/C][C]0.2991[/C][C]0.383028[/C][/ROW]
[ROW][C]31[/C][C]-0.018667[/C][C]-0.1359[/C][C]0.446209[/C][/ROW]
[ROW][C]32[/C][C]-0.02698[/C][C]-0.1964[/C][C]0.422517[/C][/ROW]
[ROW][C]33[/C][C]-0.125948[/C][C]-0.9169[/C][C]0.181671[/C][/ROW]
[ROW][C]34[/C][C]0.035063[/C][C]0.2553[/C][C]0.399755[/C][/ROW]
[ROW][C]35[/C][C]0.007437[/C][C]0.0541[/C][C]0.478514[/C][/ROW]
[ROW][C]36[/C][C]-0.128187[/C][C]-0.9332[/C][C]0.177471[/C][/ROW]
[ROW][C]37[/C][C]0.005228[/C][C]0.0381[/C][C]0.484892[/C][/ROW]
[ROW][C]38[/C][C]-0.079661[/C][C]-0.5799[/C][C]0.282205[/C][/ROW]
[ROW][C]39[/C][C]0.054415[/C][C]0.3961[/C][C]0.346792[/C][/ROW]
[ROW][C]40[/C][C]-0.028271[/C][C]-0.2058[/C][C]0.418862[/C][/ROW]
[ROW][C]41[/C][C]-0.056282[/C][C]-0.4097[/C][C]0.341824[/C][/ROW]
[ROW][C]42[/C][C]-0.010551[/C][C]-0.0768[/C][C]0.469531[/C][/ROW]
[ROW][C]43[/C][C]0.079035[/C][C]0.5754[/C][C]0.283733[/C][/ROW]
[ROW][C]44[/C][C]-0.046996[/C][C]-0.3421[/C][C]0.366802[/C][/ROW]
[ROW][C]45[/C][C]0.046954[/C][C]0.3418[/C][C]0.366915[/C][/ROW]
[ROW][C]46[/C][C]-0.128257[/C][C]-0.9337[/C][C]0.177341[/C][/ROW]
[ROW][C]47[/C][C]-0.065445[/C][C]-0.4764[/C][C]0.317857[/C][/ROW]
[ROW][C]48[/C][C]0.043496[/C][C]0.3167[/C][C]0.376375[/C][/ROW]
[ROW][C]49[/C][C]-0.052677[/C][C]-0.3835[/C][C]0.351444[/C][/ROW]
[ROW][C]50[/C][C]0.020321[/C][C]0.1479[/C][C]0.441477[/C][/ROW]
[ROW][C]51[/C][C]0.063967[/C][C]0.4657[/C][C]0.321674[/C][/ROW]
[ROW][C]52[/C][C]0.077181[/C][C]0.5619[/C][C]0.28828[/C][/ROW]
[ROW][C]53[/C][C]NA[/C][C]NA[/C][C]NA[/C][/ROW]
[ROW][C]54[/C][C]NA[/C][C]NA[/C][C]NA[/C][/ROW]
[ROW][C]55[/C][C]NA[/C][C]NA[/C][C]NA[/C][/ROW]
[ROW][C]56[/C][C]NA[/C][C]NA[/C][C]NA[/C][/ROW]
[ROW][C]57[/C][C]NA[/C][C]NA[/C][C]NA[/C][/ROW]
[ROW][C]58[/C][C]NA[/C][C]NA[/C][C]NA[/C][/ROW]
[ROW][C]59[/C][C]NA[/C][C]NA[/C][C]NA[/C][/ROW]
[ROW][C]60[/C][C]NA[/C][C]NA[/C][C]NA[/C][/ROW]
[/TABLE]
Source: https://freestatistics.org/blog/index.php?pk=319551&T=2

Globally Unique Identifier (entire table): ba.freestatistics.org/blog/index.php?pk=319551&T=2

As an alternative you can also use a QR Code:  

The GUIDs for individual cells are displayed in the table below:

Partial Autocorrelation Function
Time lag kPACF(k)T-STATP-value
10.1614491.17540.122551
2-0.203561-1.48190.072138
30.4691863.41570.000614
40.3082362.2440.014517
5-0.224566-1.63490.054002
60.0301080.21920.413672
70.2256291.64260.053193
8-0.104774-0.76280.224492
9-0.061245-0.44590.328752
100.1574451.14620.128427
11-0.127904-0.93120.177998
12-0.143993-1.04830.149632
13-0.040083-0.29180.385787
14-0.034826-0.25350.400417
15-0.025355-0.18460.427129
160.1020920.74320.23031
17-0.008421-0.06130.475674
18-0.095641-0.69630.244649
190.17441.26970.104877
20-0.224768-1.63630.053848
210.0914830.6660.254148
22-0.006728-0.0490.480558
230.1091780.79480.21513
24-0.060375-0.43950.331031
250.0515450.37530.354484
261.1e-051e-040.499967
27-0.140944-1.02610.154756
28-0.037626-0.27390.392605
290.0059090.0430.482925
300.041080.29910.383028
31-0.018667-0.13590.446209
32-0.02698-0.19640.422517
33-0.125948-0.91690.181671
340.0350630.25530.399755
350.0074370.05410.478514
36-0.128187-0.93320.177471
370.0052280.03810.484892
38-0.079661-0.57990.282205
390.0544150.39610.346792
40-0.028271-0.20580.418862
41-0.056282-0.40970.341824
42-0.010551-0.07680.469531
430.0790350.57540.283733
44-0.046996-0.34210.366802
450.0469540.34180.366915
46-0.128257-0.93370.177341
47-0.065445-0.47640.317857
480.0434960.31670.376375
49-0.052677-0.38350.351444
500.0203210.14790.441477
510.0639670.46570.321674
520.0771810.56190.28828
53NANANA
54NANANA
55NANANA
56NANANA
57NANANA
58NANANA
59NANANA
60NANANA


Parameters (Session):
Parameters (R input):
par1 = 60 ; par2 = 1 ; par3 = 0 ; par4 = 0 ; par5 = 12 ; par6 = MA ; par7 = 0.95 ; par8 = ;
R code (references can be found in the software module):
par8 <- ''
par7 <- '0.95'
par6 <- 'White Noise'
par5 <- '12'
par4 <- '0'
par3 <- '0'
par2 <- '1'
par1 <- '60'
if (par1 == 'Default') {
par1 = 10*log10(length(x))
} else {
par1 <- as.numeric(par1)
}
par2 <- as.numeric(par2)
par3 <- as.numeric(par3)
par4 <- as.numeric(par4)
par5 <- as.numeric(par5)
if (par6 == 'White Noise') par6 <- 'white' else par6 <- 'ma'
par7 <- as.numeric(par7)
if (par8 != '') par8 <- as.numeric(par8)
x <- na.omit(x)
ox <- x
if (par8 == '') {
if (par2 == 0) {
x <- log(x)
} else {
x <- (x ^ par2 - 1) / par2
}
} else {
x <- log(x,base=par8)
}
if (par3 > 0) x <- diff(x,lag=1,difference=par3)
if (par4 > 0) x <- diff(x,lag=par5,difference=par4)
bitmap(file='picts.png')
op <- par(mfrow=c(2,1))
plot(ox,type='l',main='Original Time Series',xlab='time',ylab='value')
if (par8=='') {
mytitle <- paste('Working Time Series (lambda=',par2,', d=',par3,', D=',par4,')',sep='')
mysub <- paste('(lambda=',par2,', d=',par3,', D=',par4,', CI=', par7, ', CI type=',par6,')',sep='')
} else {
mytitle <- paste('Working Time Series (base=',par8,', d=',par3,', D=',par4,')',sep='')
mysub <- paste('(base=',par8,', d=',par3,', D=',par4,', CI=', par7, ', CI type=',par6,')',sep='')
}
plot(x,type='l', main=mytitle,xlab='time',ylab='value')
par(op)
dev.off()
bitmap(file='pic1.png')
racf <- acf(x, par1, main='Autocorrelation', xlab='time lag', ylab='ACF', ci.type=par6, ci=par7, sub=mysub)
dev.off()
bitmap(file='pic2.png')
rpacf <- pacf(x,par1,main='Partial Autocorrelation',xlab='lags',ylab='PACF',sub=mysub)
dev.off()
(myacf <- c(racf$acf))
(mypacf <- c(rpacf$acf))
lengthx <- length(x)
sqrtn <- sqrt(lengthx)
load(file='createtable')
a<-table.start()
a<-table.row.start(a)
a<-table.element(a,'Autocorrelation Function',4,TRUE)
a<-table.row.end(a)
a<-table.row.start(a)
a<-table.element(a,'Time lag k',header=TRUE)
a<-table.element(a,'ACF(k)',header=TRUE)
a<-table.element(a,'T-STAT',header=TRUE)
a<-table.element(a,'P-value',header=TRUE)
a<-table.row.end(a)
for (i in 2:(par1+1)) {
a<-table.row.start(a)
a<-table.element(a,i-1,header=TRUE)
a<-table.element(a,round(myacf[i],6))
mytstat <- myacf[i]*sqrtn
a<-table.element(a,round(mytstat,4))
a<-table.element(a,round(1-pt(abs(mytstat),lengthx),6))
a<-table.row.end(a)
}
a<-table.end(a)
table.save(a,file='mytable.tab')
a<-table.start()
a<-table.row.start(a)
a<-table.element(a,'Partial Autocorrelation Function',4,TRUE)
a<-table.row.end(a)
a<-table.row.start(a)
a<-table.element(a,'Time lag k',header=TRUE)
a<-table.element(a,'PACF(k)',header=TRUE)
a<-table.element(a,'T-STAT',header=TRUE)
a<-table.element(a,'P-value',header=TRUE)
a<-table.row.end(a)
for (i in 1:par1) {
a<-table.row.start(a)
a<-table.element(a,i,header=TRUE)
a<-table.element(a,round(mypacf[i],6))
mytstat <- mypacf[i]*sqrtn
a<-table.element(a,round(mytstat,4))
a<-table.element(a,round(1-pt(abs(mytstat),lengthx),6))
a<-table.row.end(a)
}
a<-table.end(a)
table.save(a,file='mytable1.tab')