Free Statistics

of Irreproducible Research!

Author's title

Author*Unverified author*
R Software Modulerwasp_autocorrelation.wasp
Title produced by software(Partial) Autocorrelation Function
Date of computationFri, 05 Nov 2021 16:51:09 +0100
Cite this page as followsStatistical Computations at FreeStatistics.org, Office for Research Development and Education, URL https://freestatistics.org/blog/index.php?v=date/2021/Nov/05/t1636127657k6tos7y4zotmsh0.htm/, Retrieved Thu, 09 May 2024 04:43:27 +0200
Statistical Computations at FreeStatistics.org, Office for Research Development and Education, URL https://freestatistics.org/blog/index.php?pk=, Retrieved Thu, 09 May 2024 04:43:27 +0200
QR Codes:

Original text written by user:
IsPrivate?This computation is private
User-defined keywords
Estimated Impact0
Dataseries X:
0
0
0
0
0
0
0
0
0
0
0
0
0
0
0
0
0
0
0
0
0
0
0
0
0
0
0
0
0
0
0
0
0
0
0
0
1
0
0
0
0
0
0
0
0
0
1
0
0
0
0
0
0
0
1
5
0
4
10
8
10
4
7
14
5
19
22
20
4
39
10
26
4
18
6
16
22
12
17
13
5
20
30
34
35
51
49
85
38
0
208
108
114
87
91
64
195
196
204
238
218
170
244
148
195
381
386
239
248
242
146
184
191
288
171
338
216
226
276
339
245
265
313
229
276
389
182
387
553
307
416
241
347
350
328
389
253
315
663
409
681
627
501
403
573
490
587
745
667
661
436
675
452
649
594
684
779
490
566
561
790
626
454
603
544
575
503
460
499
575
664
571
595
463
643
595
600
653
556
562
576
543
604
591
438
555
648
624
404
481
462
386
304
288
304
457
354
443
453
437
290
423
453
373
329
325
298
417
410
593
476
340
601
322
321
252
221
296
160
250
138
143
239
216
125
155
162
100
155
296
176
197
188
160
79
132
90
126
131
221
189
97
195
176
111
125
213
136
126
136
187
201
153
126
160
58
120
118
155
103
151
111
163
164
225
179
148
212
113
133
118
72
37
138
77
48
62
119
113
147
150
170
162
111
72
137
155
180
223
59
300
94
152
180
212
156
112
152
157
152
236
146
143
246
155
56
168
198
169
246
110
82
145
281
122
343
324
310
318
390
550
474
675
796
617
418
199
758
930
1145
806
920
501
356
999
1133
1041
784
829
838
397
749
1016
1031
980
576
917
1271
1354
1664
1565
1544
1585
1024
1244
1270
1398
1479
1867
1598
1444
1617
1301
1386
1964
1483
2464
964
1430
1303
1861
864
1650
1883
685
676
1634
1138
1340
1624
1588
506
643
1056
1131
938
1005
1143
520
744
1368
1073
877
662
645
521
542
571
655
634
600
341
240
360
479
464
711
371
195
269
400


Summary of computational transaction
Raw Input view raw input (R code)
Raw Outputview raw output of R engine
Computing time1 seconds
R ServerBig Analytics Cloud Computing Center

\begin{tabular}{lllllllll}
\hline
Summary of computational transaction \tabularnewline
Raw Input view raw input (R code)  \tabularnewline
Raw Outputview raw output of R engine  \tabularnewline
Computing time1 seconds \tabularnewline
R ServerBig Analytics Cloud Computing Center \tabularnewline
\hline
\end{tabular}
%Source: https://freestatistics.org/blog/index.php?pk=&T=0

[TABLE]
[ROW]
Summary of computational transaction[/C][/ROW] [ROW]Raw Input[/C] view raw input (R code) [/C][/ROW] [ROW]Raw Output[/C]view raw output of R engine [/C][/ROW] [ROW]Computing time[/C]1 seconds[/C][/ROW] [ROW]R Server[/C]Big Analytics Cloud Computing Center[/C][/ROW] [/TABLE] Source: https://freestatistics.org/blog/index.php?pk=&T=0

Globally Unique Identifier (entire table): ba.freestatistics.org/blog/index.php?pk=&T=0

As an alternative you can also use a QR Code:  

The GUIDs for individual cells are displayed in the table below:

Summary of computational transaction
Raw Input view raw input (R code)
Raw Outputview raw output of R engine
Computing time1 seconds
R ServerBig Analytics Cloud Computing Center


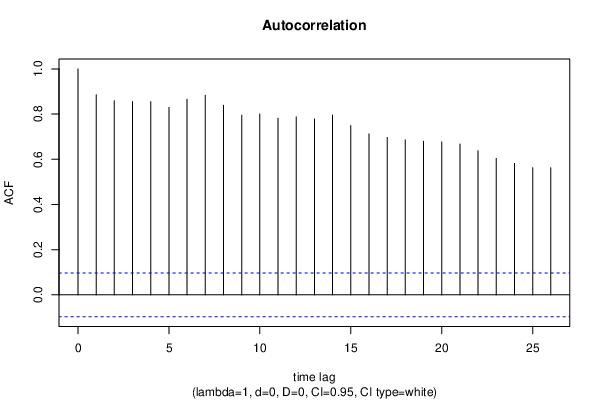
Autocorrelation Function
Time lag kACF(k)T-STATP-value
10.88539217.94970
20.85966817.42820
30.85575717.34890
40.85527817.33920
50.82949416.81650
60.86571217.55070
70.88321317.90550
80.83880217.00510
90.79498716.11690
100.80035516.22570
110.78134115.84020
120.7877515.97020
130.77812815.77510
140.79626416.14280
150.7491715.1880
160.71229314.44040
170.69682814.12690
180.68588513.9050
190.67972313.78010
200.67681613.72120
210.66778413.53810
220.63784112.9310
230.60387312.24240
240.58155111.78990
250.56207711.39510
260.56245511.40270

\begin{tabular}{lllllllll}
\hline
Autocorrelation Function \tabularnewline
Time lag k & ACF(k) & T-STAT & P-value \tabularnewline
1 & 0.885392 & 17.9497 & 0 \tabularnewline
2 & 0.859668 & 17.4282 & 0 \tabularnewline
3 & 0.855757 & 17.3489 & 0 \tabularnewline
4 & 0.855278 & 17.3392 & 0 \tabularnewline
5 & 0.829494 & 16.8165 & 0 \tabularnewline
6 & 0.865712 & 17.5507 & 0 \tabularnewline
7 & 0.883213 & 17.9055 & 0 \tabularnewline
8 & 0.838802 & 17.0051 & 0 \tabularnewline
9 & 0.794987 & 16.1169 & 0 \tabularnewline
10 & 0.800355 & 16.2257 & 0 \tabularnewline
11 & 0.781341 & 15.8402 & 0 \tabularnewline
12 & 0.78775 & 15.9702 & 0 \tabularnewline
13 & 0.778128 & 15.7751 & 0 \tabularnewline
14 & 0.796264 & 16.1428 & 0 \tabularnewline
15 & 0.74917 & 15.188 & 0 \tabularnewline
16 & 0.712293 & 14.4404 & 0 \tabularnewline
17 & 0.696828 & 14.1269 & 0 \tabularnewline
18 & 0.685885 & 13.905 & 0 \tabularnewline
19 & 0.679723 & 13.7801 & 0 \tabularnewline
20 & 0.676816 & 13.7212 & 0 \tabularnewline
21 & 0.667784 & 13.5381 & 0 \tabularnewline
22 & 0.637841 & 12.931 & 0 \tabularnewline
23 & 0.603873 & 12.2424 & 0 \tabularnewline
24 & 0.581551 & 11.7899 & 0 \tabularnewline
25 & 0.562077 & 11.3951 & 0 \tabularnewline
26 & 0.562455 & 11.4027 & 0 \tabularnewline
\hline
\end{tabular}
%Source: https://freestatistics.org/blog/index.php?pk=&T=1

[TABLE]
[ROW][C]Autocorrelation Function[/C][/ROW]
[ROW][C]Time lag k[/C][C]ACF(k)[/C][C]T-STAT[/C][C]P-value[/C][/ROW]
[ROW][C]1[/C][C]0.885392[/C][C]17.9497[/C][C]0[/C][/ROW]
[ROW][C]2[/C][C]0.859668[/C][C]17.4282[/C][C]0[/C][/ROW]
[ROW][C]3[/C][C]0.855757[/C][C]17.3489[/C][C]0[/C][/ROW]
[ROW][C]4[/C][C]0.855278[/C][C]17.3392[/C][C]0[/C][/ROW]
[ROW][C]5[/C][C]0.829494[/C][C]16.8165[/C][C]0[/C][/ROW]
[ROW][C]6[/C][C]0.865712[/C][C]17.5507[/C][C]0[/C][/ROW]
[ROW][C]7[/C][C]0.883213[/C][C]17.9055[/C][C]0[/C][/ROW]
[ROW][C]8[/C][C]0.838802[/C][C]17.0051[/C][C]0[/C][/ROW]
[ROW][C]9[/C][C]0.794987[/C][C]16.1169[/C][C]0[/C][/ROW]
[ROW][C]10[/C][C]0.800355[/C][C]16.2257[/C][C]0[/C][/ROW]
[ROW][C]11[/C][C]0.781341[/C][C]15.8402[/C][C]0[/C][/ROW]
[ROW][C]12[/C][C]0.78775[/C][C]15.9702[/C][C]0[/C][/ROW]
[ROW][C]13[/C][C]0.778128[/C][C]15.7751[/C][C]0[/C][/ROW]
[ROW][C]14[/C][C]0.796264[/C][C]16.1428[/C][C]0[/C][/ROW]
[ROW][C]15[/C][C]0.74917[/C][C]15.188[/C][C]0[/C][/ROW]
[ROW][C]16[/C][C]0.712293[/C][C]14.4404[/C][C]0[/C][/ROW]
[ROW][C]17[/C][C]0.696828[/C][C]14.1269[/C][C]0[/C][/ROW]
[ROW][C]18[/C][C]0.685885[/C][C]13.905[/C][C]0[/C][/ROW]
[ROW][C]19[/C][C]0.679723[/C][C]13.7801[/C][C]0[/C][/ROW]
[ROW][C]20[/C][C]0.676816[/C][C]13.7212[/C][C]0[/C][/ROW]
[ROW][C]21[/C][C]0.667784[/C][C]13.5381[/C][C]0[/C][/ROW]
[ROW][C]22[/C][C]0.637841[/C][C]12.931[/C][C]0[/C][/ROW]
[ROW][C]23[/C][C]0.603873[/C][C]12.2424[/C][C]0[/C][/ROW]
[ROW][C]24[/C][C]0.581551[/C][C]11.7899[/C][C]0[/C][/ROW]
[ROW][C]25[/C][C]0.562077[/C][C]11.3951[/C][C]0[/C][/ROW]
[ROW][C]26[/C][C]0.562455[/C][C]11.4027[/C][C]0[/C][/ROW]
[/TABLE]
Source: https://freestatistics.org/blog/index.php?pk=&T=1

Globally Unique Identifier (entire table): ba.freestatistics.org/blog/index.php?pk=&T=1

As an alternative you can also use a QR Code:  

The GUIDs for individual cells are displayed in the table below:

Autocorrelation Function
Time lag kACF(k)T-STATP-value
10.88539217.94970
20.85966817.42820
30.85575717.34890
40.85527817.33920
50.82949416.81650
60.86571217.55070
70.88321317.90550
80.83880217.00510
90.79498716.11690
100.80035516.22570
110.78134115.84020
120.7877515.97020
130.77812815.77510
140.79626416.14280
150.7491715.1880
160.71229314.44040
170.69682814.12690
180.68588513.9050
190.67972313.78010
200.67681613.72120
210.66778413.53810
220.63784112.9310
230.60387312.24240
240.58155111.78990
250.56207711.39510
260.56245511.40270


Partial Autocorrelation Function
Time lag kPACF(k)T-STATP-value
10.88539217.94970
20.350567.1070
30.2693935.46140
40.2122524.3031.1e-05
50.0217690.44130.329603
60.3304846.69990
70.2694755.46310
8-0.118328-2.39890.008445
9-0.246282-4.99290
10-0.051323-1.04050.149364
11-0.072132-1.46230.072206
120.1183762.39980.008423
13-0.120747-2.44790.007393
140.0580141.17610.120112
15-0.087213-1.76810.038895
16-0.138137-2.80050.002672
17-0.064797-1.31360.094852
18-0.113573-2.30250.010903
190.0216320.43850.330613
200.0010180.02060.491771
21-0.021756-0.44110.3297
22-0.014798-0.30.382162
230.0171380.34740.364219
24-0.07599-1.54060.062097
25-0.054972-1.11450.132866
26-0.009853-0.19980.420884

\begin{tabular}{lllllllll}
\hline
Partial Autocorrelation Function \tabularnewline
Time lag k & PACF(k) & T-STAT & P-value \tabularnewline
1 & 0.885392 & 17.9497 & 0 \tabularnewline
2 & 0.35056 & 7.107 & 0 \tabularnewline
3 & 0.269393 & 5.4614 & 0 \tabularnewline
4 & 0.212252 & 4.303 & 1.1e-05 \tabularnewline
5 & 0.021769 & 0.4413 & 0.329603 \tabularnewline
6 & 0.330484 & 6.6999 & 0 \tabularnewline
7 & 0.269475 & 5.4631 & 0 \tabularnewline
8 & -0.118328 & -2.3989 & 0.008445 \tabularnewline
9 & -0.246282 & -4.9929 & 0 \tabularnewline
10 & -0.051323 & -1.0405 & 0.149364 \tabularnewline
11 & -0.072132 & -1.4623 & 0.072206 \tabularnewline
12 & 0.118376 & 2.3998 & 0.008423 \tabularnewline
13 & -0.120747 & -2.4479 & 0.007393 \tabularnewline
14 & 0.058014 & 1.1761 & 0.120112 \tabularnewline
15 & -0.087213 & -1.7681 & 0.038895 \tabularnewline
16 & -0.138137 & -2.8005 & 0.002672 \tabularnewline
17 & -0.064797 & -1.3136 & 0.094852 \tabularnewline
18 & -0.113573 & -2.3025 & 0.010903 \tabularnewline
19 & 0.021632 & 0.4385 & 0.330613 \tabularnewline
20 & 0.001018 & 0.0206 & 0.491771 \tabularnewline
21 & -0.021756 & -0.4411 & 0.3297 \tabularnewline
22 & -0.014798 & -0.3 & 0.382162 \tabularnewline
23 & 0.017138 & 0.3474 & 0.364219 \tabularnewline
24 & -0.07599 & -1.5406 & 0.062097 \tabularnewline
25 & -0.054972 & -1.1145 & 0.132866 \tabularnewline
26 & -0.009853 & -0.1998 & 0.420884 \tabularnewline
\hline
\end{tabular}
%Source: https://freestatistics.org/blog/index.php?pk=&T=2

[TABLE]
[ROW][C]Partial Autocorrelation Function[/C][/ROW]
[ROW][C]Time lag k[/C][C]PACF(k)[/C][C]T-STAT[/C][C]P-value[/C][/ROW]
[ROW][C]1[/C][C]0.885392[/C][C]17.9497[/C][C]0[/C][/ROW]
[ROW][C]2[/C][C]0.35056[/C][C]7.107[/C][C]0[/C][/ROW]
[ROW][C]3[/C][C]0.269393[/C][C]5.4614[/C][C]0[/C][/ROW]
[ROW][C]4[/C][C]0.212252[/C][C]4.303[/C][C]1.1e-05[/C][/ROW]
[ROW][C]5[/C][C]0.021769[/C][C]0.4413[/C][C]0.329603[/C][/ROW]
[ROW][C]6[/C][C]0.330484[/C][C]6.6999[/C][C]0[/C][/ROW]
[ROW][C]7[/C][C]0.269475[/C][C]5.4631[/C][C]0[/C][/ROW]
[ROW][C]8[/C][C]-0.118328[/C][C]-2.3989[/C][C]0.008445[/C][/ROW]
[ROW][C]9[/C][C]-0.246282[/C][C]-4.9929[/C][C]0[/C][/ROW]
[ROW][C]10[/C][C]-0.051323[/C][C]-1.0405[/C][C]0.149364[/C][/ROW]
[ROW][C]11[/C][C]-0.072132[/C][C]-1.4623[/C][C]0.072206[/C][/ROW]
[ROW][C]12[/C][C]0.118376[/C][C]2.3998[/C][C]0.008423[/C][/ROW]
[ROW][C]13[/C][C]-0.120747[/C][C]-2.4479[/C][C]0.007393[/C][/ROW]
[ROW][C]14[/C][C]0.058014[/C][C]1.1761[/C][C]0.120112[/C][/ROW]
[ROW][C]15[/C][C]-0.087213[/C][C]-1.7681[/C][C]0.038895[/C][/ROW]
[ROW][C]16[/C][C]-0.138137[/C][C]-2.8005[/C][C]0.002672[/C][/ROW]
[ROW][C]17[/C][C]-0.064797[/C][C]-1.3136[/C][C]0.094852[/C][/ROW]
[ROW][C]18[/C][C]-0.113573[/C][C]-2.3025[/C][C]0.010903[/C][/ROW]
[ROW][C]19[/C][C]0.021632[/C][C]0.4385[/C][C]0.330613[/C][/ROW]
[ROW][C]20[/C][C]0.001018[/C][C]0.0206[/C][C]0.491771[/C][/ROW]
[ROW][C]21[/C][C]-0.021756[/C][C]-0.4411[/C][C]0.3297[/C][/ROW]
[ROW][C]22[/C][C]-0.014798[/C][C]-0.3[/C][C]0.382162[/C][/ROW]
[ROW][C]23[/C][C]0.017138[/C][C]0.3474[/C][C]0.364219[/C][/ROW]
[ROW][C]24[/C][C]-0.07599[/C][C]-1.5406[/C][C]0.062097[/C][/ROW]
[ROW][C]25[/C][C]-0.054972[/C][C]-1.1145[/C][C]0.132866[/C][/ROW]
[ROW][C]26[/C][C]-0.009853[/C][C]-0.1998[/C][C]0.420884[/C][/ROW]
[/TABLE]
Source: https://freestatistics.org/blog/index.php?pk=&T=2

Globally Unique Identifier (entire table): ba.freestatistics.org/blog/index.php?pk=&T=2

As an alternative you can also use a QR Code:  

The GUIDs for individual cells are displayed in the table below:

Partial Autocorrelation Function
Time lag kPACF(k)T-STATP-value
10.88539217.94970
20.350567.1070
30.2693935.46140
40.2122524.3031.1e-05
50.0217690.44130.329603
60.3304846.69990
70.2694755.46310
8-0.118328-2.39890.008445
9-0.246282-4.99290
10-0.051323-1.04050.149364
11-0.072132-1.46230.072206
120.1183762.39980.008423
13-0.120747-2.44790.007393
140.0580141.17610.120112
15-0.087213-1.76810.038895
16-0.138137-2.80050.002672
17-0.064797-1.31360.094852
18-0.113573-2.30250.010903
190.0216320.43850.330613
200.0010180.02060.491771
21-0.021756-0.44110.3297
22-0.014798-0.30.382162
230.0171380.34740.364219
24-0.07599-1.54060.062097
25-0.054972-1.11450.132866
26-0.009853-0.19980.420884


Parameters (Session):
par1 = Default ; par2 = 1 ; par3 = 0 ; par4 = 0 ; par5 = 12 ; par6 = White Noise ; par7 = 0.95 ;
Parameters (R input):
par1 = Default ; par2 = 1 ; par3 = 0 ; par4 = 0 ; par5 = 12 ; par6 = White Noise ; par7 = 0.95 ; par8 = ;
R code (references can be found in the software module):
if (par1 == 'Default') {
par1 = 10*log10(length(x))
} else {
par1 <- as.numeric(par1)
}
par2 <- as.numeric(par2)
par3 <- as.numeric(par3)
par4 <- as.numeric(par4)
par5 <- as.numeric(par5)
if (par6 == 'White Noise') par6 <- 'white' else par6 <- 'ma'
par7 <- as.numeric(par7)
if (par8 != '') par8 <- as.numeric(par8)
x <- na.omit(x)
ox <- x
if (par8 == '') {
if (par2 == 0) {
x <- log(x)
} else {
x <- (x ^ par2 - 1) / par2
}
} else {
x <- log(x,base=par8)
}
if (par3 > 0) x <- diff(x,lag=1,difference=par3)
if (par4 > 0) x <- diff(x,lag=par5,difference=par4)
bitmap(file='picts.png')
op <- par(mfrow=c(2,1))
plot(ox,type='l',main='Original Time Series',xlab='time',ylab='value')
if (par8=='') {
mytitle <- paste('Working Time Series (lambda=',par2,', d=',par3,', D=',par4,')',sep='')
mysub <- paste('(lambda=',par2,', d=',par3,', D=',par4,', CI=', par7, ', CI type=',par6,')',sep='')
} else {
mytitle <- paste('Working Time Series (base=',par8,', d=',par3,', D=',par4,')',sep='')
mysub <- paste('(base=',par8,', d=',par3,', D=',par4,', CI=', par7, ', CI type=',par6,')',sep='')
}
plot(x,type='l', main=mytitle,xlab='time',ylab='value')
par(op)
dev.off()
bitmap(file='pic1.png')
racf <- acf(x, par1, main='Autocorrelation', xlab='time lag', ylab='ACF', ci.type=par6, ci=par7, sub=mysub)
dev.off()
bitmap(file='pic2.png')
rpacf <- pacf(x,par1,main='Partial Autocorrelation',xlab='lags',ylab='PACF',sub=mysub)
dev.off()
(myacf <- c(racf$acf))
(mypacf <- c(rpacf$acf))
lengthx <- length(x)
sqrtn <- sqrt(lengthx)
load(file='createtable')
a<-table.start()
a<-table.row.start(a)
a<-table.element(a,'Autocorrelation Function',4,TRUE)
a<-table.row.end(a)
a<-table.row.start(a)
a<-table.element(a,'Time lag k',header=TRUE)
a<-table.element(a,'ACF(k)',header=TRUE)
a<-table.element(a,'T-STAT',header=TRUE)
a<-table.element(a,'P-value',header=TRUE)
a<-table.row.end(a)
for (i in 2:(par1+1)) {
a<-table.row.start(a)
a<-table.element(a,i-1,header=TRUE)
a<-table.element(a,round(myacf[i],6))
mytstat <- myacf[i]*sqrtn
a<-table.element(a,round(mytstat,4))
a<-table.element(a,round(1-pt(abs(mytstat),lengthx),6))
a<-table.row.end(a)
}
a<-table.end(a)
table.save(a,file='mytable.tab')
a<-table.start()
a<-table.row.start(a)
a<-table.element(a,'Partial Autocorrelation Function',4,TRUE)
a<-table.row.end(a)
a<-table.row.start(a)
a<-table.element(a,'Time lag k',header=TRUE)
a<-table.element(a,'PACF(k)',header=TRUE)
a<-table.element(a,'T-STAT',header=TRUE)
a<-table.element(a,'P-value',header=TRUE)
a<-table.row.end(a)
for (i in 1:par1) {
a<-table.row.start(a)
a<-table.element(a,i,header=TRUE)
a<-table.element(a,round(mypacf[i],6))
mytstat <- mypacf[i]*sqrtn
a<-table.element(a,round(mytstat,4))
a<-table.element(a,round(1-pt(abs(mytstat),lengthx),6))
a<-table.row.end(a)
}
a<-table.end(a)
table.save(a,file='mytable1.tab')