| Pearson Product Moment Correlation - Ungrouped Data | ||
| Statistic | Variable X | Variable Y |
| Mean | 0.8248 | 49.68 |
| Biased Variance | 0.01756896 | 912.6976 |
| Biased Standard Deviation | 0.132547953586617 | 30.2108854554116 |
| Covariance | -1.39722702702703 | |
| Correlation | -0.344271405683529 | |
| Determination | 0.118522800771313 | |
| T-Test | -3.13297436467926 | |
| p-value (2 sided) | 0.00249098844158765 | |
| p-value (1 sided) | 0.00124549422079383 | |
| 95% CI of Correlation | [-0.529833898512906, -0.127252632433676] | |
| Degrees of Freedom | 73 | |
| Number of Observations | 75 | |
| Normality Tests |
> jarque.x Jarque-Bera Normality Test data: x JB = 32.634, p-value = 8.195e-08 alternative hypothesis: greater |
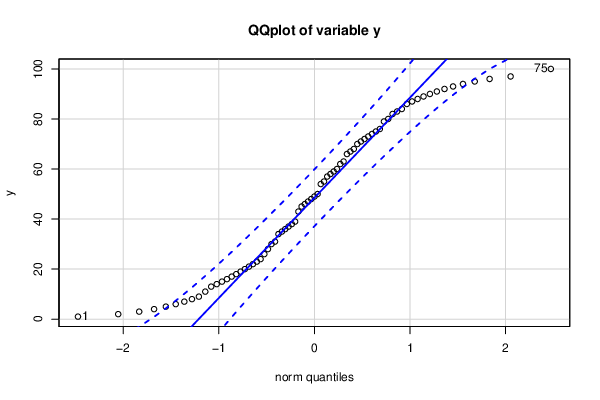
> jarque.y Jarque-Bera Normality Test data: y JB = 5.5132, p-value = 0.06351 alternative hypothesis: greater |
> ad.x Anderson-Darling normality test data: x A = 1.2902, p-value = 0.002205 |
> ad.y Anderson-Darling normality test data: y A = 1.2669, p-value = 0.002519 |