Free Statistics
of Irreproducible Research!
Description of Statistical Computation | ||||||||||||||||||||||||||||||||||||||||||||||
|---|---|---|---|---|---|---|---|---|---|---|---|---|---|---|---|---|---|---|---|---|---|---|---|---|---|---|---|---|---|---|---|---|---|---|---|---|---|---|---|---|---|---|---|---|---|---|
| Author's title | ||||||||||||||||||||||||||||||||||||||||||||||
| Author | *The author of this computation has been verified* | |||||||||||||||||||||||||||||||||||||||||||||
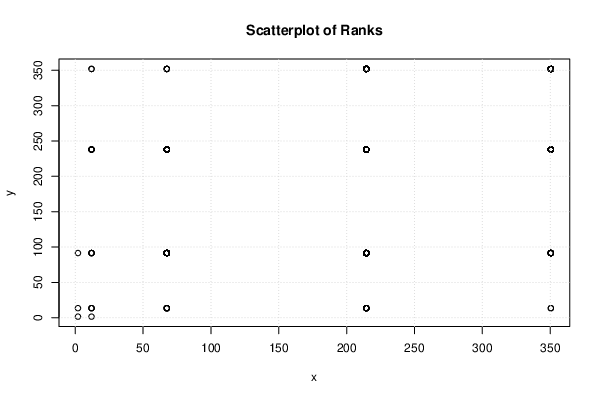
| R Software Module | rwasp_spearman.wasp | |||||||||||||||||||||||||||||||||||||||||||||
| Title produced by software | Spearman Rank Correlation | |||||||||||||||||||||||||||||||||||||||||||||
| Date of computation | Thu, 28 Jan 2021 14:47:22 +0100 | |||||||||||||||||||||||||||||||||||||||||||||
| Cite this page as follows | Statistical Computations at FreeStatistics.org, Office for Research Development and Education, URL https://freestatistics.org/blog/index.php?v=date/2021/Jan/28/t1611841902aihn04qovhat7a8.htm/, Retrieved Sun, 28 Apr 2024 16:57:03 +0200 | |||||||||||||||||||||||||||||||||||||||||||||
| Statistical Computations at FreeStatistics.org, Office for Research Development and Education, URL https://freestatistics.org/blog/index.php?pk=, Retrieved Sun, 28 Apr 2024 16:57:03 +0200 | ||||||||||||||||||||||||||||||||||||||||||||||
| QR Codes: | ||||||||||||||||||||||||||||||||||||||||||||||
|
| ||||||||||||||||||||||||||||||||||||||||||||||
| Original text written by user: | ||||||||||||||||||||||||||||||||||||||||||||||
| IsPrivate? | This computation is private | |||||||||||||||||||||||||||||||||||||||||||||
| User-defined keywords | ||||||||||||||||||||||||||||||||||||||||||||||
| Estimated Impact | 0 | |||||||||||||||||||||||||||||||||||||||||||||
Tree of Dependent Computations | ||||||||||||||||||||||||||||||||||||||||||||||
Dataset | ||||||||||||||||||||||||||||||||||||||||||||||
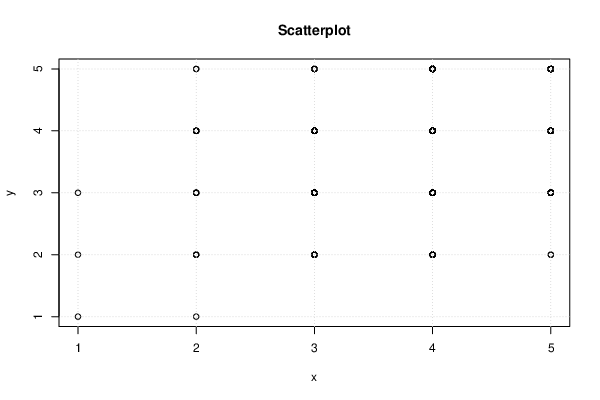
| Dataseries X: | ||||||||||||||||||||||||||||||||||||||||||||||
3 4 3 3 3 4 4 5 2 4 3 4 2 4 4 3 4 4 5 4 3 5 5 4 3 5 3 2 4 3 4 3 4 4 4 4 5 4 4 3 3 4 4 4 4 5 2 5 4 5 4 3 5 3 5 3 4 4 3 4 5 4 4 4 4 4 4 4 4 4 3 5 4 4 5 3 4 4 4 5 4 4 5 3 4 5 4 4 5 4 3 3 3 4 3 4 4 4 5 3 3 4 4 4 3 4 4 3 4 4 4 4 4 4 4 5 3 4 2 5 3 4 5 4 4 4 4 4 5 5 4 4 5 4 3 3 5 4 4 5 4 4 4 4 3 5 2 5 4 4 5 5 4 3 4 4 3 3 4 3 4 3 3 4 4 4 4 5 4 3 4 4 4 3 3 5 5 3 3 3 4 2 4 3 4 2 5 3 3 4 4 4 3 3 2 3 4 4 4 3 5 3 3 4 4 4 4 4 4 2 4 4 4 5 4 3 5 4 4 3 4 5 4 4 4 4 4 3 3 5 3 4 4 4 3 4 3 4 2 3 4 4 4 5 4 4 5 5 4 4 4 4 4 4 3 4 3 4 3 4 3 4 5 4 4 3 4 4 5 4 4 4 4 4 5 4 3 4 5 4 4 4 4 3 3 4 4 5 4 4 5 4 5 4 5 5 4 3 5 3 4 4 4 4 3 4 2 4 2 5 5 4 4 4 3 4 5 3 3 3 5 4 1 2 5 2 3 4 5 4 4 5 3 4 4 5 3 4 4 4 4 5 3 3 3 5 3 4 4 4 2 4 4 5 4 4 3 3 4 5 4 4 4 3 5 4 4 5 3 1 5 3 3 2 3 4 3 3 5 4 5 1 5 3 4 5 | ||||||||||||||||||||||||||||||||||||||||||||||
| Dataseries Y: | ||||||||||||||||||||||||||||||||||||||||||||||
2 3 3 2 4 3 3 4 1 5 5 5 4 4 3 4 4 4 5 5 3 5 4 3 4 5 4 4 4 4 4 4 3 4 4 4 5 2 4 4 5 5 3 4 5 4 4 4 4 3 3 3 5 4 4 3 4 3 3 3 3 5 4 5 4 5 4 3 4 4 4 5 3 4 4 3 3 4 4 3 4 4 4 3 4 4 3 4 5 4 4 3 3 2 4 4 3 5 5 3 3 4 4 2 4 3 3 3 3 5 4 3 5 4 4 5 4 3 3 5 4 2 5 3 4 4 5 5 5 4 4 3 5 4 4 4 3 2 3 5 2 4 3 4 2 5 5 4 4 2 3 4 5 4 4 4 3 3 4 3 3 3 3 4 3 3 4 5 4 4 5 3 4 2 5 5 5 3 3 3 4 4 5 3 4 3 3 3 4 3 4 4 4 4 2 4 2 3 4 3 5 3 3 3 4 4 3 3 3 3 4 3 4 4 4 3 5 3 4 4 3 4 3 4 4 4 4 4 3 2 4 4 3 3 3 4 2 5 4 4 4 4 4 5 4 4 4 5 5 5 5 4 5 5 4 4 3 4 3 4 3 5 5 4 4 3 3 5 4 3 4 4 3 5 5 4 3 4 3 4 2 3 4 2 4 3 4 5 3 3 4 4 5 4 3 4 4 4 4 3 5 5 5 5 3 4 3 3 4 3 4 3 3 3 3 4 4 3 3 3 3 3 1 2 5 4 4 3 3 3 4 4 4 4 3 4 5 4 5 3 4 5 3 5 4 4 3 3 3 4 2 3 3 3 3 3 3 3 4 3 3 5 4 3 3 3 3 5 4 2 5 3 2 5 3 4 4 3 2 4 3 3 3 3 4 5 | ||||||||||||||||||||||||||||||||||||||||||||||
Tables (Output of Computation) | ||||||||||||||||||||||||||||||||||||||||||||||
| ||||||||||||||||||||||||||||||||||||||||||||||
Figures (Output of Computation) | ||||||||||||||||||||||||||||||||||||||||||||||
Input Parameters & R Code | ||||||||||||||||||||||||||||||||||||||||||||||
| Parameters (Session): | ||||||||||||||||||||||||||||||||||||||||||||||
| Parameters (R input): | ||||||||||||||||||||||||||||||||||||||||||||||
| R code (references can be found in the software module): | ||||||||||||||||||||||||||||||||||||||||||||||
k <- cor.test(x,y,method='spearman') | ||||||||||||||||||||||||||||||||||||||||||||||