| Multiple Linear Regression - Estimated Regression Equation |
| TVDC3[t] = -2.43598 + 0.188296SKEOUSUM[t] + 0.11866GWSUM[t] -0.106827KVDD4[t] + 0.0188012EP4[t] + 0.211656EC3[t] + e[t] |
| Multiple Linear Regression - Ordinary Least Squares | |||||
| Variable | Parameter | S.D. | T-STAT H0: parameter = 0 | 2-tail p-value | 1-tail p-value |
| (Intercept) | -2.436 | 0.9075 | -2.6840e+00 | 0.008685 | 0.004343 |
| SKEOUSUM | +0.1883 | 0.02967 | +6.3470e+00 | 9.299e-09 | 4.65e-09 |
| GWSUM | +0.1187 | 0.03514 | +3.3770e+00 | 0.001094 | 0.0005468 |
| KVDD4 | -0.1068 | 0.05872 | -1.8190e+00 | 0.07228 | 0.03614 |
| EP4 | +0.0188 | 0.04096 | +4.5900e-01 | 0.6474 | 0.3237 |
| EC3 | +0.2117 | 0.08435 | +2.5090e+00 | 0.01393 | 0.006963 |
| Multiple Linear Regression - Regression Statistics | |
| Multiple R | 0.6461 |
| R-squared | 0.4175 |
| Adjusted R-squared | 0.3844 |
| F-TEST (value) | 12.61 |
| F-TEST (DF numerator) | 5 |
| F-TEST (DF denominator) | 88 |
| p-value | 3.05e-09 |
| Multiple Linear Regression - Residual Statistics | |
| Residual Standard Deviation | 0.5129 |
| Sum Squared Residuals | 23.15 |
| Menu of Residual Diagnostics | |
| Description | Link |
| Histogram | Compute |
| Central Tendency | Compute |
| QQ Plot | Compute |
| Kernel Density Plot | Compute |
| Skewness/Kurtosis Test | Compute |
| Skewness-Kurtosis Plot | Compute |
| Harrell-Davis Plot | Compute |
| Bootstrap Plot -- Central Tendency | Compute |
| Blocked Bootstrap Plot -- Central Tendency | Compute |
| (Partial) Autocorrelation Plot | Compute |
| Spectral Analysis | Compute |
| Tukey lambda PPCC Plot | Compute |
| Box-Cox Normality Plot | Compute |
| Summary Statistics | Compute |
| Multiple Linear Regression - Actuals, Interpolation, and Residuals | |||
| Time or Index | Actuals | Interpolation Forecast | Residuals Prediction Error |
| 1 | 3 | 3.45 | -0.4499 |
| 2 | 4 | 3.876 | 0.124 |
| 3 | 5 | 4.535 | 0.4646 |
| 4 | 5 | 4.508 | 0.4917 |
| 5 | 5 | 3.699 | 1.301 |
| 6 | 5 | 4.81 | 0.1899 |
| 7 | 5 | 4.182 | 0.8178 |
| 8 | 4 | 4.404 | -0.4035 |
| 9 | 4 | 4.301 | -0.3011 |
| 10 | 4 | 4.244 | -0.2438 |
| 11 | 4 | 4.176 | -0.1756 |
| 12 | 5 | 4.015 | 0.9852 |
| 13 | 4 | 4.01 | -0.009925 |
| 14 | 4 | 4.095 | -0.09455 |
| 15 | 4 | 4.234 | -0.2337 |
| 16 | 4 | 4.389 | -0.3893 |
| 17 | 4 | 3.983 | 0.01724 |
| 18 | 5 | 4.796 | 0.2039 |
| 19 | 3 | 3.945 | -0.9452 |
| 20 | 5 | 4.131 | 0.8693 |
| 21 | 4 | 4.84 | -0.8404 |
| 22 | 4 | 3.913 | 0.08688 |
| 23 | 5 | 4.025 | 0.9751 |
| 24 | 4 | 4.213 | -0.2132 |
| 25 | 4 | 3.799 | 0.201 |
| 26 | 5 | 4.471 | 0.5293 |
| 27 | 5 | 4.698 | 0.3017 |
| 28 | 3 | 3.557 | -0.5567 |
| 29 | 5 | 5.318 | -0.3175 |
| 30 | 4 | 4.145 | -0.1453 |
| 31 | 3 | 3.896 | -0.8961 |
| 32 | 5 | 4.778 | 0.2223 |
| 33 | 3 | 3.51 | -0.5099 |
| 34 | 4 | 3.789 | 0.2107 |
| 35 | 4 | 4.369 | -0.3687 |
| 36 | 4 | 4.064 | -0.06381 |
| 37 | 5 | 4.973 | 0.02705 |
| 38 | 4 | 4.171 | -0.1706 |
| 39 | 4 | 4.652 | -0.6521 |
| 40 | 4 | 3.599 | 0.4011 |
| 41 | 5 | 3.583 | 1.417 |
| 42 | 4 | 4.415 | -0.4153 |
| 43 | 4 | 4.027 | -0.02722 |
| 44 | 4 | 3.799 | 0.201 |
| 45 | 5 | 4.345 | 0.6549 |
| 46 | 4 | 4.108 | -0.1078 |
| 47 | 4 | 4.264 | -0.2636 |
| 48 | 5 | 4.264 | 0.7364 |
| 49 | 5 | 4.385 | 0.6153 |
| 50 | 4 | 4.359 | -0.3589 |
| 51 | 5 | 4.39 | 0.6104 |
| 52 | 5 | 4.352 | 0.6475 |
| 53 | 5 | 4.722 | 0.2783 |
| 54 | 2 | 3.092 | -1.092 |
| 55 | 5 | 4.466 | 0.5338 |
| 56 | 5 | 4.452 | 0.5481 |
| 57 | 4 | 4.332 | -0.3319 |
| 58 | 4 | 4.271 | -0.2713 |
| 59 | 4 | 4.008 | -0.007927 |
| 60 | 4 | 4.829 | -0.8285 |
| 61 | 5 | 4.827 | 0.1729 |
| 62 | 4 | 4.628 | -0.6284 |
| 63 | 4 | 4.238 | -0.2383 |
| 64 | 3 | 3.583 | -0.5828 |
| 65 | 4 | 3.646 | 0.3544 |
| 66 | 4 | 4.275 | -0.2755 |
| 67 | 4 | 4.566 | -0.5658 |
| 68 | 4 | 4.099 | -0.09901 |
| 69 | 4 | 3.976 | 0.02411 |
| 70 | 4 | 3.776 | 0.2243 |
| 71 | 4 | 4.176 | -0.176 |
| 72 | 4 | 4.206 | -0.2058 |
| 73 | 4 | 4.106 | -0.106 |
| 74 | 5 | 3.941 | 1.059 |
| 75 | 3 | 2.98 | 0.01999 |
| 76 | 4 | 4.085 | -0.08502 |
| 77 | 3 | 3.839 | -0.8386 |
| 78 | 5 | 5.048 | -0.04805 |
| 79 | 5 | 5.136 | -0.1359 |
| 80 | 5 | 4.841 | 0.1592 |
| 81 | 4 | 4.026 | -0.02632 |
| 82 | 4 | 4.404 | -0.4035 |
| 83 | 4 | 4.027 | -0.02662 |
| 84 | 5 | 4.383 | 0.6173 |
| 85 | 4 | 4.454 | -0.4543 |
| 86 | 5 | 4.564 | 0.436 |
| 87 | 4 | 4.52 | -0.5202 |
| 88 | 4 | 3.906 | 0.09374 |
| 89 | 4 | 4.127 | -0.1266 |
| 90 | 3 | 3.566 | -0.5658 |
| 91 | 5 | 4.722 | 0.2783 |
| 92 | 4 | 3.919 | 0.08051 |
| 93 | 4 | 4.257 | -0.2571 |
| 94 | 4 | 4.132 | -0.1317 |
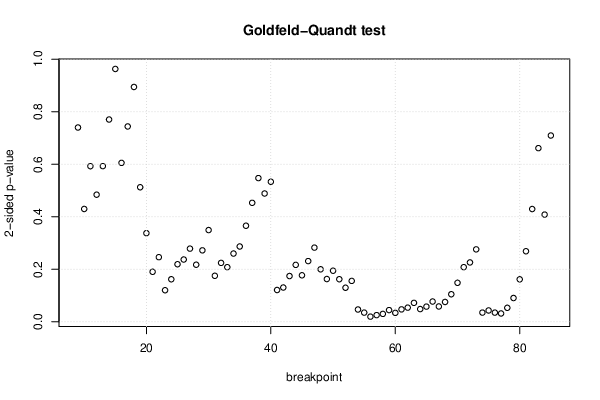
| Goldfeld-Quandt test for Heteroskedasticity | |||
| p-values | Alternative Hypothesis | ||
| breakpoint index | greater | 2-sided | less |
| 9 | 0.3699 | 0.7397 | 0.6301 |
| 10 | 0.2148 | 0.4296 | 0.7852 |
| 11 | 0.2963 | 0.5925 | 0.7037 |
| 12 | 0.758 | 0.484 | 0.242 |
| 13 | 0.7036 | 0.5928 | 0.2964 |
| 14 | 0.6149 | 0.7702 | 0.3851 |
| 15 | 0.5186 | 0.9627 | 0.4814 |
| 16 | 0.6974 | 0.6051 | 0.3026 |
| 17 | 0.6281 | 0.7438 | 0.3719 |
| 18 | 0.553 | 0.8941 | 0.447 |
| 19 | 0.7438 | 0.5123 | 0.2562 |
| 20 | 0.8313 | 0.3375 | 0.1687 |
| 21 | 0.9048 | 0.1904 | 0.0952 |
| 22 | 0.877 | 0.2461 | 0.123 |
| 23 | 0.9398 | 0.1203 | 0.06016 |
| 24 | 0.919 | 0.162 | 0.081 |
| 25 | 0.8904 | 0.2193 | 0.1096 |
| 26 | 0.8814 | 0.2371 | 0.1186 |
| 27 | 0.8607 | 0.2786 | 0.1393 |
| 28 | 0.8913 | 0.2173 | 0.1087 |
| 29 | 0.8639 | 0.2721 | 0.1361 |
| 30 | 0.8254 | 0.3493 | 0.1746 |
| 31 | 0.9124 | 0.1751 | 0.08755 |
| 32 | 0.8878 | 0.2243 | 0.1122 |
| 33 | 0.896 | 0.208 | 0.104 |
| 34 | 0.8701 | 0.2599 | 0.1299 |
| 35 | 0.8566 | 0.2868 | 0.1434 |
| 36 | 0.8172 | 0.3657 | 0.1828 |
| 37 | 0.7735 | 0.453 | 0.2265 |
| 38 | 0.7264 | 0.5472 | 0.2736 |
| 39 | 0.7557 | 0.4885 | 0.2443 |
| 40 | 0.7334 | 0.5332 | 0.2666 |
| 41 | 0.9394 | 0.1211 | 0.06056 |
| 42 | 0.9347 | 0.1306 | 0.06528 |
| 43 | 0.9129 | 0.1742 | 0.08711 |
| 44 | 0.8916 | 0.2168 | 0.1084 |
| 45 | 0.9114 | 0.1771 | 0.08857 |
| 46 | 0.8844 | 0.2312 | 0.1156 |
| 47 | 0.8588 | 0.2824 | 0.1412 |
| 48 | 0.9 | 0.1999 | 0.09997 |
| 49 | 0.9186 | 0.1628 | 0.08141 |
| 50 | 0.9028 | 0.1944 | 0.09721 |
| 51 | 0.9189 | 0.1622 | 0.08109 |
| 52 | 0.9352 | 0.1297 | 0.06485 |
| 53 | 0.9222 | 0.1557 | 0.07783 |
| 54 | 0.9766 | 0.04681 | 0.02341 |
| 55 | 0.9825 | 0.03505 | 0.01753 |
| 56 | 0.9902 | 0.01964 | 0.009818 |
| 57 | 0.9873 | 0.02547 | 0.01274 |
| 58 | 0.985 | 0.03007 | 0.01503 |
| 59 | 0.9777 | 0.04467 | 0.02233 |
| 60 | 0.983 | 0.03403 | 0.01701 |
| 61 | 0.9763 | 0.04735 | 0.02368 |
| 62 | 0.973 | 0.05393 | 0.02697 |
| 63 | 0.9639 | 0.07212 | 0.03606 |
| 64 | 0.9758 | 0.04848 | 0.02424 |
| 65 | 0.9711 | 0.0578 | 0.0289 |
| 66 | 0.9614 | 0.0772 | 0.0386 |
| 67 | 0.9708 | 0.05845 | 0.02923 |
| 68 | 0.9622 | 0.07557 | 0.03779 |
| 69 | 0.9475 | 0.105 | 0.05249 |
| 70 | 0.9258 | 0.1485 | 0.07425 |
| 71 | 0.896 | 0.2081 | 0.104 |
| 72 | 0.887 | 0.2261 | 0.113 |
| 73 | 0.8621 | 0.2759 | 0.1379 |
| 74 | 0.9825 | 0.03505 | 0.01753 |
| 75 | 0.9784 | 0.0432 | 0.0216 |
| 76 | 0.9825 | 0.03507 | 0.01754 |
| 77 | 0.9841 | 0.03175 | 0.01588 |
| 78 | 0.9734 | 0.05325 | 0.02662 |
| 79 | 0.9547 | 0.0906 | 0.0453 |
| 80 | 0.9191 | 0.1618 | 0.08088 |
| 81 | 0.8656 | 0.2687 | 0.1344 |
| 82 | 0.7853 | 0.4294 | 0.2147 |
| 83 | 0.6694 | 0.6612 | 0.3306 |
| 84 | 0.7959 | 0.4083 | 0.2041 |
| 85 | 0.6454 | 0.7092 | 0.3546 |
| Meta Analysis of Goldfeld-Quandt test for Heteroskedasticity | |||
| Description | # significant tests | % significant tests | OK/NOK |
| 1% type I error level | 0 | 0 | OK |
| 5% type I error level | 13 | 0.168831 | NOK |
| 10% type I error level | 21 | 0.272727 | NOK |
| Ramsey RESET F-Test for powers (2 and 3) of fitted values |
> reset_test_fitted RESET test data: mylm RESET = 1.3958, df1 = 2, df2 = 86, p-value = 0.2532 |
| Ramsey RESET F-Test for powers (2 and 3) of regressors |
> reset_test_regressors RESET test data: mylm RESET = 0.90558, df1 = 10, df2 = 78, p-value = 0.5323 |
| Ramsey RESET F-Test for powers (2 and 3) of principal components |
> reset_test_principal_components RESET test data: mylm RESET = 0.15397, df1 = 2, df2 = 86, p-value = 0.8575 |
| Variance Inflation Factors (Multicollinearity) |
> vif SKEOUSUM GWSUM KVDD4 EP4 EC3 1.021859 1.019252 1.021890 1.009794 1.014053 |