Free Statistics

of Irreproducible Research!

Author's title

Author*The author of this computation has been verified*
R Software Modulerwasp_twosampletests_mean.wasp
Title produced by softwarePaired and Unpaired Two Samples Tests about the Mean
Date of computationThu, 11 Feb 2021 21:06:21 +0100
Cite this page as followsStatistical Computations at FreeStatistics.org, Office for Research Development and Education, URL https://freestatistics.org/blog/index.php?v=date/2021/Feb/11/t161307420730xsvzr9a3ihl25.htm/, Retrieved Wed, 24 Apr 2024 02:31:19 +0200
Statistical Computations at FreeStatistics.org, Office for Research Development and Education, URL https://freestatistics.org/blog/index.php?pk=, Retrieved Wed, 24 Apr 2024 02:31:19 +0200
QR Codes:

Original text written by user:
IsPrivate?This computation is private
User-defined keywords
Estimated Impact0
Dataseries X:
13,5554	14,89125
79,67958	10,88372
85,02295	28,91759
31,58927	83,68711
42,94393	163,8376
79,67958	9,547878
11,55164	34,26094
79,01166	26,2459
44,94769	18,89877
8,212039	10,2158
129,7737	8,879958
24,24214	2,868668
101,721	27,58175
20,90254	20,23461
9,547878	7,544112
22,23838	25,57798
115,7473	81,01543
37,60056	24,91006
28,24967	86,35879
30,25343	12,21956
5,540353	4,204506
45,61561	14,89125
4,204506	62,31363
22,23838	9,547878
3,536587	4,872434
48,9552	10,88372
117,0831	36,93264
20,23461	56,97027
107,7323	13,5554
105,7285	9,547878
6,876192
8,879958
26,24500
5,540000


Summary of computational transaction
Raw Input view raw input (R code)
Raw Outputview raw output of R engine
Computing time1 seconds
R ServerBig Analytics Cloud Computing Center

\begin{tabular}{lllllllll}
\hline
Summary of computational transaction \tabularnewline
Raw Input view raw input (R code)  \tabularnewline
Raw Outputview raw output of R engine  \tabularnewline
Computing time1 seconds \tabularnewline
R ServerBig Analytics Cloud Computing Center \tabularnewline
\hline
\end{tabular}
%Source: https://freestatistics.org/blog/index.php?pk=&T=0

[TABLE]
[ROW]
Summary of computational transaction[/C][/ROW] [ROW]Raw Input[/C] view raw input (R code) [/C][/ROW] [ROW]Raw Output[/C]view raw output of R engine [/C][/ROW] [ROW]Computing time[/C]1 seconds[/C][/ROW] [ROW]R Server[/C]Big Analytics Cloud Computing Center[/C][/ROW] [/TABLE] Source: https://freestatistics.org/blog/index.php?pk=&T=0

Globally Unique Identifier (entire table): ba.freestatistics.org/blog/index.php?pk=&T=0

As an alternative you can also use a QR Code:  

The GUIDs for individual cells are displayed in the table below:

Summary of computational transaction
Raw Input view raw input (R code)
Raw Outputview raw output of R engine
Computing time1 seconds
R ServerBig Analytics Cloud Computing Center


Two Sample t-test (unpaired)
Mean of Sample 147.1675192647059
Mean of Sample 228.3085885294118
t-stat2.14238617633926
df66
p-value0.0179278032880619
H0 value0
Alternativegreater
CI Level0.95
CI[4.17353067856307,Inf]
F-test to compare two variances
F-stat1.37282055552624
df33
p-value0.367375603139136
H0 value1
Alternativetwo.sided
CI Level0.95
CI[0.685620939167503,2.74880210041974]

\begin{tabular}{lllllllll}
\hline
Two Sample t-test (unpaired) \tabularnewline
Mean of Sample 1 & 47.1675192647059 \tabularnewline
Mean of Sample 2 & 28.3085885294118 \tabularnewline
t-stat & 2.14238617633926 \tabularnewline
df & 66 \tabularnewline
p-value & 0.0179278032880619 \tabularnewline
H0 value & 0 \tabularnewline
Alternative & greater \tabularnewline
CI Level & 0.95 \tabularnewline
CI & [4.17353067856307,Inf] \tabularnewline
F-test to compare two variances \tabularnewline
F-stat & 1.37282055552624 \tabularnewline
df & 33 \tabularnewline
p-value & 0.367375603139136 \tabularnewline
H0 value & 1 \tabularnewline
Alternative & two.sided \tabularnewline
CI Level & 0.95 \tabularnewline
CI & [0.685620939167503,2.74880210041974] \tabularnewline
\hline
\end{tabular}
%Source: https://freestatistics.org/blog/index.php?pk=&T=1

[TABLE]
[ROW][C]Two Sample t-test (unpaired)[/C][/ROW]
[ROW][C]Mean of Sample 1[/C][C]47.1675192647059[/C][/ROW]
[ROW][C]Mean of Sample 2[/C][C]28.3085885294118[/C][/ROW]
[ROW][C]t-stat[/C][C]2.14238617633926[/C][/ROW]
[ROW][C]df[/C][C]66[/C][/ROW]
[ROW][C]p-value[/C][C]0.0179278032880619[/C][/ROW]
[ROW][C]H0 value[/C][C]0[/C][/ROW]
[ROW][C]Alternative[/C][C]greater[/C][/ROW]
[ROW][C]CI Level[/C][C]0.95[/C][/ROW]
[ROW][C]CI[/C][C][4.17353067856307,Inf][/C][/ROW]
[ROW][C]F-test to compare two variances[/C][/ROW]
[ROW][C]F-stat[/C][C]1.37282055552624[/C][/ROW]
[ROW][C]df[/C][C]33[/C][/ROW]
[ROW][C]p-value[/C][C]0.367375603139136[/C][/ROW]
[ROW][C]H0 value[/C][C]1[/C][/ROW]
[ROW][C]Alternative[/C][C]two.sided[/C][/ROW]
[ROW][C]CI Level[/C][C]0.95[/C][/ROW]
[ROW][C]CI[/C][C][0.685620939167503,2.74880210041974][/C][/ROW]
[/TABLE]
Source: https://freestatistics.org/blog/index.php?pk=&T=1

Globally Unique Identifier (entire table): ba.freestatistics.org/blog/index.php?pk=&T=1

As an alternative you can also use a QR Code:  

The GUIDs for individual cells are displayed in the table below:

Two Sample t-test (unpaired)
Mean of Sample 147.1675192647059
Mean of Sample 228.3085885294118
t-stat2.14238617633926
df66
p-value0.0179278032880619
H0 value0
Alternativegreater
CI Level0.95
CI[4.17353067856307,Inf]
F-test to compare two variances
F-stat1.37282055552624
df33
p-value0.367375603139136
H0 value1
Alternativetwo.sided
CI Level0.95
CI[0.685620939167503,2.74880210041974]


Welch Two Sample t-test (unpaired)
Mean of Sample 147.1675192647059
Mean of Sample 228.3085885294118
t-stat2.14238617633926
df64.4099068107637
p-value0.0179739447583158
H0 value0
Alternativegreater
CI Level0.95
CI[4.16836768500703,Inf]

\begin{tabular}{lllllllll}
\hline
Welch Two Sample t-test (unpaired) \tabularnewline
Mean of Sample 1 & 47.1675192647059 \tabularnewline
Mean of Sample 2 & 28.3085885294118 \tabularnewline
t-stat & 2.14238617633926 \tabularnewline
df & 64.4099068107637 \tabularnewline
p-value & 0.0179739447583158 \tabularnewline
H0 value & 0 \tabularnewline
Alternative & greater \tabularnewline
CI Level & 0.95 \tabularnewline
CI & [4.16836768500703,Inf] \tabularnewline
\hline
\end{tabular}
%Source: https://freestatistics.org/blog/index.php?pk=&T=2

[TABLE]
[ROW][C]Welch Two Sample t-test (unpaired)[/C][/ROW]
[ROW][C]Mean of Sample 1[/C][C]47.1675192647059[/C][/ROW]
[ROW][C]Mean of Sample 2[/C][C]28.3085885294118[/C][/ROW]
[ROW][C]t-stat[/C][C]2.14238617633926[/C][/ROW]
[ROW][C]df[/C][C]64.4099068107637[/C][/ROW]
[ROW][C]p-value[/C][C]0.0179739447583158[/C][/ROW]
[ROW][C]H0 value[/C][C]0[/C][/ROW]
[ROW][C]Alternative[/C][C]greater[/C][/ROW]
[ROW][C]CI Level[/C][C]0.95[/C][/ROW]
[ROW][C]CI[/C][C][4.16836768500703,Inf][/C][/ROW]
[/TABLE]
Source: https://freestatistics.org/blog/index.php?pk=&T=2

Globally Unique Identifier (entire table): ba.freestatistics.org/blog/index.php?pk=&T=2

As an alternative you can also use a QR Code:  

The GUIDs for individual cells are displayed in the table below:

Welch Two Sample t-test (unpaired)
Mean of Sample 147.1675192647059
Mean of Sample 228.3085885294118
t-stat2.14238617633926
df64.4099068107637
p-value0.0179739447583158
H0 value0
Alternativegreater
CI Level0.95
CI[4.16836768500703,Inf]


Wilcoxon Rank-Sum Test (Mann–Whitney U test) with continuity correction (unpaired)
W763.5
p-value0.0116105474503592
H0 value0
Alternativegreater
Kolmogorov-Smirnov Test to compare Distributions of two Samples
KS Statistic0.0294117647058824
p-value0.971016551792437
Kolmogorov-Smirnov Test to compare Distributional Shape of two Samples
KS Statistic0.352941176470588
p-value0.0144755520562825

\begin{tabular}{lllllllll}
\hline
Wilcoxon Rank-Sum Test (Mann–Whitney U test) with continuity correction (unpaired) \tabularnewline
W & 763.5 \tabularnewline
p-value & 0.0116105474503592 \tabularnewline
H0 value & 0 \tabularnewline
Alternative & greater \tabularnewline
Kolmogorov-Smirnov Test to compare Distributions of two Samples \tabularnewline
KS Statistic & 0.0294117647058824 \tabularnewline
p-value & 0.971016551792437 \tabularnewline
Kolmogorov-Smirnov Test to compare Distributional Shape of two Samples \tabularnewline
KS Statistic & 0.352941176470588 \tabularnewline
p-value & 0.0144755520562825 \tabularnewline
\hline
\end{tabular}
%Source: https://freestatistics.org/blog/index.php?pk=&T=3

[TABLE]
[ROW][C]Wilcoxon Rank-Sum Test (Mann–Whitney U test) with continuity correction (unpaired)[/C][/ROW]
[ROW][C]W[/C][C]763.5[/C][/ROW]
[ROW][C]p-value[/C][C]0.0116105474503592[/C][/ROW]
[ROW][C]H0 value[/C][C]0[/C][/ROW]
[ROW][C]Alternative[/C][C]greater[/C][/ROW]
[ROW][C]Kolmogorov-Smirnov Test to compare Distributions of two Samples[/C][/ROW]
[ROW][C]KS Statistic[/C][C]0.0294117647058824[/C][/ROW]
[ROW][C]p-value[/C][C]0.971016551792437[/C][/ROW]
[ROW][C]Kolmogorov-Smirnov Test to compare Distributional Shape of two Samples[/C][/ROW]
[ROW][C]KS Statistic[/C][C]0.352941176470588[/C][/ROW]
[ROW][C]p-value[/C][C]0.0144755520562825[/C][/ROW]
[/TABLE]
Source: https://freestatistics.org/blog/index.php?pk=&T=3

Globally Unique Identifier (entire table): ba.freestatistics.org/blog/index.php?pk=&T=3

As an alternative you can also use a QR Code:  

The GUIDs for individual cells are displayed in the table below:

Wilcoxon Rank-Sum Test (Mann–Whitney U test) with continuity correction (unpaired)
W763.5
p-value0.0116105474503592
H0 value0
Alternativegreater
Kolmogorov-Smirnov Test to compare Distributions of two Samples
KS Statistic0.0294117647058824
p-value0.971016551792437
Kolmogorov-Smirnov Test to compare Distributional Shape of two Samples
KS Statistic0.352941176470588
p-value0.0144755520562825


Parameters (Session):
par1 = 1 ; par2 = 2 ; par3 = 0.95 ; par4 = greater ; par5 = unpaired ; par6 = 0.0 ;
Parameters (R input):
par1 = 1 ; par2 = 2 ; par3 = 0.95 ; par4 = greater ; par5 = unpaired ; par6 = 0.0 ;
R code (references can be found in the software module):
par1 <- as.numeric(par1) #column number of first sample
par2 <- as.numeric(par2) #column number of second sample
par3 <- as.numeric(par3) #confidence (= 1 - alpha)
if (par5 == 'unpaired') paired <- FALSE else paired <- TRUE
par6 <- as.numeric(par6) #H0
z <- t(y)
if (par1 == par2) stop('Please, select two different column numbers')
if (par1 < 1) stop('Please, select a column number greater than zero for the first sample')
if (par2 < 1) stop('Please, select a column number greater than zero for the second sample')
if (par1 > length(z[1,])) stop('The column number for the first sample should be smaller')
if (par2 > length(z[1,])) stop('The column number for the second sample should be smaller')
if (par3 <= 0) stop('The confidence level should be larger than zero')
if (par3 >= 1) stop('The confidence level should be smaller than zero')
(r.t <- t.test(z[,par1],z[,par2],var.equal=TRUE,alternative=par4,paired=paired,mu=par6,conf.level=par3))
(v.t <- var.test(z[,par1],z[,par2],conf.level=par3))
(r.w <- t.test(z[,par1],z[,par2],var.equal=FALSE,alternative=par4,paired=paired,mu=par6,conf.level=par3))
(w.t <- wilcox.test(z[,par1],z[,par2],alternative=par4,paired=paired,mu=par6,conf.level=par3))
(ks.t <- ks.test(z[,par1],z[,par2],alternative=par4))
m1 <- mean(z[,par1],na.rm=T)
m2 <- mean(z[,par2],na.rm=T)
mdiff <- m1 - m2
newsam1 <- z[!is.na(z[,par1]),par1]
newsam2 <- z[,par2]+mdiff
newsam2 <- newsam2[!is.na(newsam2)]
(ks1.t <- ks.test(newsam1,newsam2,alternative=par4))
mydf <- data.frame(cbind(z[,par1],z[,par2]))
colnames(mydf) <- c('Variable 1','Variable 2')
bitmap(file='test1.png')
boxplot(mydf, notch=TRUE, ylab='value',main=main)
dev.off()
bitmap(file='test2.png')
qqnorm(z[,par1],main='Normal QQplot - Variable 1')
qqline(z[,par1])
dev.off()
bitmap(file='test3.png')
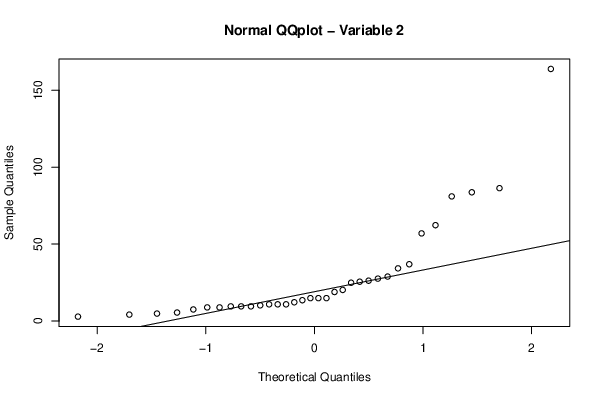
qqnorm(z[,par2],main='Normal QQplot - Variable 2')
qqline(z[,par2])
dev.off()
load(file='createtable')
a<-table.start()
a<-table.row.start(a)
a<-table.element(a,paste('Two Sample t-test (',par5,')',sep=''),2,TRUE)
a<-table.row.end(a)
if(!paired){
a<-table.row.start(a)
a<-table.element(a,'Mean of Sample 1',header=TRUE)
a<-table.element(a,r.t$estimate[[1]])
a<-table.row.end(a)
a<-table.row.start(a)
a<-table.element(a,'Mean of Sample 2',header=TRUE)
a<-table.element(a,r.t$estimate[[2]])
a<-table.row.end(a)
} else {
a<-table.row.start(a)
a<-table.element(a,'Difference: Mean1 - Mean2',header=TRUE)
a<-table.element(a,r.t$estimate)
a<-table.row.end(a)
}
a<-table.row.start(a)
a<-table.element(a,'t-stat',header=TRUE)
a<-table.element(a,r.t$statistic[[1]])
a<-table.row.end(a)
a<-table.row.start(a)
a<-table.element(a,'df',header=TRUE)
a<-table.element(a,r.t$parameter[[1]])
a<-table.row.end(a)
a<-table.row.start(a)
a<-table.element(a,'p-value',header=TRUE)
a<-table.element(a,r.t$p.value)
a<-table.row.end(a)
a<-table.row.start(a)
a<-table.element(a,'H0 value',header=TRUE)
a<-table.element(a,r.t$null.value[[1]])
a<-table.row.end(a)
a<-table.row.start(a)
a<-table.element(a,'Alternative',header=TRUE)
a<-table.element(a,r.t$alternative)
a<-table.row.end(a)
a<-table.row.start(a)
a<-table.element(a,'CI Level',header=TRUE)
a<-table.element(a,attr(r.t$conf.int,'conf.level'))
a<-table.row.end(a)
a<-table.row.start(a)
a<-table.element(a,'CI',header=TRUE)
a<-table.element(a,paste('[',r.t$conf.int[1],',',r.t$conf.int[2],']',sep=''))
a<-table.row.end(a)
a<-table.row.start(a)
a<-table.element(a,'F-test to compare two variances',2,TRUE)
a<-table.row.end(a)
a<-table.row.start(a)
a<-table.element(a,'F-stat',header=TRUE)
a<-table.element(a,v.t$statistic[[1]])
a<-table.row.end(a)
a<-table.row.start(a)
a<-table.element(a,'df',header=TRUE)
a<-table.element(a,v.t$parameter[[1]])
a<-table.row.end(a)
a<-table.row.start(a)
a<-table.element(a,'p-value',header=TRUE)
a<-table.element(a,v.t$p.value)
a<-table.row.end(a)
a<-table.row.start(a)
a<-table.element(a,'H0 value',header=TRUE)
a<-table.element(a,v.t$null.value[[1]])
a<-table.row.end(a)
a<-table.row.start(a)
a<-table.element(a,'Alternative',header=TRUE)
a<-table.element(a,v.t$alternative)
a<-table.row.end(a)
a<-table.row.start(a)
a<-table.element(a,'CI Level',header=TRUE)
a<-table.element(a,attr(v.t$conf.int,'conf.level'))
a<-table.row.end(a)
a<-table.row.start(a)
a<-table.element(a,'CI',header=TRUE)
a<-table.element(a,paste('[',v.t$conf.int[1],',',v.t$conf.int[2],']',sep=''))
a<-table.row.end(a)
a<-table.end(a)
table.save(a,file='mytable.tab')
a<-table.start()
a<-table.row.start(a)
a<-table.element(a,paste('Welch Two Sample t-test (',par5,')',sep=''),2,TRUE)
a<-table.row.end(a)
if(!paired){
a<-table.row.start(a)
a<-table.element(a,'Mean of Sample 1',header=TRUE)
a<-table.element(a,r.w$estimate[[1]])
a<-table.row.end(a)
a<-table.row.start(a)
a<-table.element(a,'Mean of Sample 2',header=TRUE)
a<-table.element(a,r.w$estimate[[2]])
a<-table.row.end(a)
} else {
a<-table.row.start(a)
a<-table.element(a,'Difference: Mean1 - Mean2',header=TRUE)
a<-table.element(a,r.w$estimate)
a<-table.row.end(a)
}
a<-table.row.start(a)
a<-table.element(a,'t-stat',header=TRUE)
a<-table.element(a,r.w$statistic[[1]])
a<-table.row.end(a)
a<-table.row.start(a)
a<-table.element(a,'df',header=TRUE)
a<-table.element(a,r.w$parameter[[1]])
a<-table.row.end(a)
a<-table.row.start(a)
a<-table.element(a,'p-value',header=TRUE)
a<-table.element(a,r.w$p.value)
a<-table.row.end(a)
a<-table.row.start(a)
a<-table.element(a,'H0 value',header=TRUE)
a<-table.element(a,r.w$null.value[[1]])
a<-table.row.end(a)
a<-table.row.start(a)
a<-table.element(a,'Alternative',header=TRUE)
a<-table.element(a,r.w$alternative)
a<-table.row.end(a)
a<-table.row.start(a)
a<-table.element(a,'CI Level',header=TRUE)
a<-table.element(a,attr(r.w$conf.int,'conf.level'))
a<-table.row.end(a)
a<-table.row.start(a)
a<-table.element(a,'CI',header=TRUE)
a<-table.element(a,paste('[',r.w$conf.int[1],',',r.w$conf.int[2],']',sep=''))
a<-table.row.end(a)
a<-table.end(a)
table.save(a,file='mytable1.tab')
a<-table.start()
a<-table.row.start(a)
myWlabel <- 'Wilcoxon Signed-Rank Test'
if (par5=='unpaired') myWlabel = 'Wilcoxon Rank-Sum Test (Mann–Whitney U test)'
a<-table.element(a,paste(myWlabel,' with continuity correction (',par5,')',sep=''),2,TRUE)
a<-table.row.end(a)
a<-table.row.start(a)
a<-table.element(a,'W',header=TRUE)
a<-table.element(a,w.t$statistic[[1]])
a<-table.row.end(a)
a<-table.row.start(a)
a<-table.element(a,'p-value',header=TRUE)
a<-table.element(a,w.t$p.value)
a<-table.row.end(a)
a<-table.row.start(a)
a<-table.element(a,'H0 value',header=TRUE)
a<-table.element(a,w.t$null.value[[1]])
a<-table.row.end(a)
a<-table.row.start(a)
a<-table.element(a,'Alternative',header=TRUE)
a<-table.element(a,w.t$alternative)
a<-table.row.end(a)
a<-table.row.start(a)
a<-table.element(a,'Kolmogorov-Smirnov Test to compare Distributions of two Samples',2,TRUE)
a<-table.row.end(a)
a<-table.row.start(a)
a<-table.element(a,'KS Statistic',header=TRUE)
a<-table.element(a,ks.t$statistic[[1]])
a<-table.row.end(a)
a<-table.row.start(a)
a<-table.element(a,'p-value',header=TRUE)
a<-table.element(a,ks.t$p.value)
a<-table.row.end(a)
a<-table.row.start(a)
a<-table.element(a,'Kolmogorov-Smirnov Test to compare Distributional Shape of two Samples',2,TRUE)
a<-table.row.end(a)
a<-table.row.start(a)
a<-table.element(a,'KS Statistic',header=TRUE)
a<-table.element(a,ks1.t$statistic[[1]])
a<-table.row.end(a)
a<-table.row.start(a)
a<-table.element(a,'p-value',header=TRUE)
a<-table.element(a,ks1.t$p.value)
a<-table.row.end(a)
a<-table.end(a)
table.save(a,file='mytable2.tab')