Free Statistics

of Irreproducible Research!

Author's title

Author*Unverified author*
R Software Modulerwasp_rngnorm.wasp
Title produced by softwareRandom Number Generator - Normal Distribution
Date of computationMon, 27 Dec 2021 03:52:15 +0100
Cite this page as followsStatistical Computations at FreeStatistics.org, Office for Research Development and Education, URL https://freestatistics.org/blog/index.php?v=date/2021/Dec/27/t1640573637wtbha0xduomvdu0.htm/, Retrieved Wed, 15 May 2024 13:40:55 +0000
Statistical Computations at FreeStatistics.org, Office for Research Development and Education, URL https://freestatistics.org/blog/index.php?pk=319589, Retrieved Wed, 15 May 2024 13:40:55 +0000
QR Codes:

Original text written by user:
IsPrivate?No (this computation is public)
User-defined keywordsSD = 6
Estimated Impact56
Family? (F = Feedback message, R = changed R code, M = changed R Module, P = changed Parameters, D = changed Data)
-       [Random Number Generator - Normal Distribution] [Normal RNG 45 mph] [2021-12-27 02:52:15] [d41d8cd98f00b204e9800998ecf8427e] [Current]
Feedback Forum

Post a new message


Summary of computational transaction
Raw Input view raw input (R code)
Raw Outputview raw output of R engine
Computing time1 seconds
R ServerBig Analytics Cloud Computing Center

\begin{tabular}{lllllllll}
\hline
Summary of computational transaction \tabularnewline
Raw Input view raw input (R code)  \tabularnewline
Raw Outputview raw output of R engine  \tabularnewline
Computing time1 seconds \tabularnewline
R ServerBig Analytics Cloud Computing Center \tabularnewline
\hline
\end{tabular}
%Source: https://freestatistics.org/blog/index.php?pk=319589&T=0

[TABLE]
[ROW]
Summary of computational transaction[/C][/ROW] [ROW]Raw Input[/C] view raw input (R code) [/C][/ROW] [ROW]Raw Output[/C]view raw output of R engine [/C][/ROW] [ROW]Computing time[/C]1 seconds[/C][/ROW] [ROW]R Server[/C]Big Analytics Cloud Computing Center[/C][/ROW] [/TABLE] Source: https://freestatistics.org/blog/index.php?pk=319589&T=0

Globally Unique Identifier (entire table): ba.freestatistics.org/blog/index.php?pk=319589&T=0

As an alternative you can also use a QR Code:  

The GUIDs for individual cells are displayed in the table below:

Summary of computational transaction
Raw Input view raw input (R code)
Raw Outputview raw output of R engine
Computing time1 seconds
R ServerBig Analytics Cloud Computing Center


IndexValue
137.0062292332343
245.4886307269041
358.1216766710828
439.8619019699665
544.3508084099839
644.7740239527965
741.9351302656681
839.073011930595
941.3000145357796
1049.4586782934466
1154.1678092406618
1247.7823598402776
1344.0432459973266
1444.0548251523241
1544.8557688439695
1649.9718697644041
1740.8572249929882
1842.6537468471229
1954.5237782029218
2051.1673409521362
2148.3322839092395
2245.9395941465782
2341.4516513831658
2453.2574889153105
2540.7147044286991
2651.2438176830708
2740.8558166265556
2842.252500978232
2947.0326914945845
3043.0931000201947
3147.3344098835345
3247.081671180471
3340.3920890154065
3443.6436055835449
3547.1124555866318
3640.623883075419
3736.9654431218173
3851.0093229271098
3937.0206973019906
4046.8975153775868
4136.3784511725279
4241.5581154672333
4340.3304965043586
4453.3516800417166
4545.4989801559428
4633.6129709892438
4746.8844896547453
4846.7095049833099
4943.6394943279604
5041.9611751830899
5146.202955739231
5249.4687615864536
5334.9630458752597
5441.5736593433748
5547.2105768983756
5644.3445617961276
5743.1563428348777
5849.723337434442
5947.9394218400162
6046.3173354424945
6145.7727055971326
6236.2016081531942
6347.8178756483407
6456.3864579490856
6549.1694319159171
6642.2622497960451
6749.9925100206683
6846.9353492008161
6935.1433122546602
7046.0095966121462
7144.1935693267052
7246.3771534271626
7345.6990311428956
7445.2777824592168
7547.4226160569128
7640.1951315100471
7739.9899203302325
7850.7321058647168
7945.6770339132122
8053.1593633739248
8139.0087668261072
8244.2503102176421
8354.3882471294887
8443.5004313394433
8545.8062624312625
8653.9761475583143
8735.4565324958655
8836.7436516203483
8948.2328731415357
9044.4987781784083
9145.9324986746618
9239.6937221238631
9349.772259046422
9451.7117323734624
9545.6854500200726
9656.2013480159028
9752.8503644127806
9839.0785229848705
9944.9195622386788
10053.3042478538737

\begin{tabular}{lllllllll}
\hline
Index & Value \tabularnewline
1 & 37.0062292332343 \tabularnewline
2 & 45.4886307269041 \tabularnewline
3 & 58.1216766710828 \tabularnewline
4 & 39.8619019699665 \tabularnewline
5 & 44.3508084099839 \tabularnewline
6 & 44.7740239527965 \tabularnewline
7 & 41.9351302656681 \tabularnewline
8 & 39.073011930595 \tabularnewline
9 & 41.3000145357796 \tabularnewline
10 & 49.4586782934466 \tabularnewline
11 & 54.1678092406618 \tabularnewline
12 & 47.7823598402776 \tabularnewline
13 & 44.0432459973266 \tabularnewline
14 & 44.0548251523241 \tabularnewline
15 & 44.8557688439695 \tabularnewline
16 & 49.9718697644041 \tabularnewline
17 & 40.8572249929882 \tabularnewline
18 & 42.6537468471229 \tabularnewline
19 & 54.5237782029218 \tabularnewline
20 & 51.1673409521362 \tabularnewline
21 & 48.3322839092395 \tabularnewline
22 & 45.9395941465782 \tabularnewline
23 & 41.4516513831658 \tabularnewline
24 & 53.2574889153105 \tabularnewline
25 & 40.7147044286991 \tabularnewline
26 & 51.2438176830708 \tabularnewline
27 & 40.8558166265556 \tabularnewline
28 & 42.252500978232 \tabularnewline
29 & 47.0326914945845 \tabularnewline
30 & 43.0931000201947 \tabularnewline
31 & 47.3344098835345 \tabularnewline
32 & 47.081671180471 \tabularnewline
33 & 40.3920890154065 \tabularnewline
34 & 43.6436055835449 \tabularnewline
35 & 47.1124555866318 \tabularnewline
36 & 40.623883075419 \tabularnewline
37 & 36.9654431218173 \tabularnewline
38 & 51.0093229271098 \tabularnewline
39 & 37.0206973019906 \tabularnewline
40 & 46.8975153775868 \tabularnewline
41 & 36.3784511725279 \tabularnewline
42 & 41.5581154672333 \tabularnewline
43 & 40.3304965043586 \tabularnewline
44 & 53.3516800417166 \tabularnewline
45 & 45.4989801559428 \tabularnewline
46 & 33.6129709892438 \tabularnewline
47 & 46.8844896547453 \tabularnewline
48 & 46.7095049833099 \tabularnewline
49 & 43.6394943279604 \tabularnewline
50 & 41.9611751830899 \tabularnewline
51 & 46.202955739231 \tabularnewline
52 & 49.4687615864536 \tabularnewline
53 & 34.9630458752597 \tabularnewline
54 & 41.5736593433748 \tabularnewline
55 & 47.2105768983756 \tabularnewline
56 & 44.3445617961276 \tabularnewline
57 & 43.1563428348777 \tabularnewline
58 & 49.723337434442 \tabularnewline
59 & 47.9394218400162 \tabularnewline
60 & 46.3173354424945 \tabularnewline
61 & 45.7727055971326 \tabularnewline
62 & 36.2016081531942 \tabularnewline
63 & 47.8178756483407 \tabularnewline
64 & 56.3864579490856 \tabularnewline
65 & 49.1694319159171 \tabularnewline
66 & 42.2622497960451 \tabularnewline
67 & 49.9925100206683 \tabularnewline
68 & 46.9353492008161 \tabularnewline
69 & 35.1433122546602 \tabularnewline
70 & 46.0095966121462 \tabularnewline
71 & 44.1935693267052 \tabularnewline
72 & 46.3771534271626 \tabularnewline
73 & 45.6990311428956 \tabularnewline
74 & 45.2777824592168 \tabularnewline
75 & 47.4226160569128 \tabularnewline
76 & 40.1951315100471 \tabularnewline
77 & 39.9899203302325 \tabularnewline
78 & 50.7321058647168 \tabularnewline
79 & 45.6770339132122 \tabularnewline
80 & 53.1593633739248 \tabularnewline
81 & 39.0087668261072 \tabularnewline
82 & 44.2503102176421 \tabularnewline
83 & 54.3882471294887 \tabularnewline
84 & 43.5004313394433 \tabularnewline
85 & 45.8062624312625 \tabularnewline
86 & 53.9761475583143 \tabularnewline
87 & 35.4565324958655 \tabularnewline
88 & 36.7436516203483 \tabularnewline
89 & 48.2328731415357 \tabularnewline
90 & 44.4987781784083 \tabularnewline
91 & 45.9324986746618 \tabularnewline
92 & 39.6937221238631 \tabularnewline
93 & 49.772259046422 \tabularnewline
94 & 51.7117323734624 \tabularnewline
95 & 45.6854500200726 \tabularnewline
96 & 56.2013480159028 \tabularnewline
97 & 52.8503644127806 \tabularnewline
98 & 39.0785229848705 \tabularnewline
99 & 44.9195622386788 \tabularnewline
100 & 53.3042478538737 \tabularnewline
\hline
\end{tabular}
%Source: https://freestatistics.org/blog/index.php?pk=319589&T=1

[TABLE]
[ROW][C]Index[/C][C]Value[/C][/ROW]
[ROW][C]1[/C][C]37.0062292332343[/C][/ROW]
[ROW][C]2[/C][C]45.4886307269041[/C][/ROW]
[ROW][C]3[/C][C]58.1216766710828[/C][/ROW]
[ROW][C]4[/C][C]39.8619019699665[/C][/ROW]
[ROW][C]5[/C][C]44.3508084099839[/C][/ROW]
[ROW][C]6[/C][C]44.7740239527965[/C][/ROW]
[ROW][C]7[/C][C]41.9351302656681[/C][/ROW]
[ROW][C]8[/C][C]39.073011930595[/C][/ROW]
[ROW][C]9[/C][C]41.3000145357796[/C][/ROW]
[ROW][C]10[/C][C]49.4586782934466[/C][/ROW]
[ROW][C]11[/C][C]54.1678092406618[/C][/ROW]
[ROW][C]12[/C][C]47.7823598402776[/C][/ROW]
[ROW][C]13[/C][C]44.0432459973266[/C][/ROW]
[ROW][C]14[/C][C]44.0548251523241[/C][/ROW]
[ROW][C]15[/C][C]44.8557688439695[/C][/ROW]
[ROW][C]16[/C][C]49.9718697644041[/C][/ROW]
[ROW][C]17[/C][C]40.8572249929882[/C][/ROW]
[ROW][C]18[/C][C]42.6537468471229[/C][/ROW]
[ROW][C]19[/C][C]54.5237782029218[/C][/ROW]
[ROW][C]20[/C][C]51.1673409521362[/C][/ROW]
[ROW][C]21[/C][C]48.3322839092395[/C][/ROW]
[ROW][C]22[/C][C]45.9395941465782[/C][/ROW]
[ROW][C]23[/C][C]41.4516513831658[/C][/ROW]
[ROW][C]24[/C][C]53.2574889153105[/C][/ROW]
[ROW][C]25[/C][C]40.7147044286991[/C][/ROW]
[ROW][C]26[/C][C]51.2438176830708[/C][/ROW]
[ROW][C]27[/C][C]40.8558166265556[/C][/ROW]
[ROW][C]28[/C][C]42.252500978232[/C][/ROW]
[ROW][C]29[/C][C]47.0326914945845[/C][/ROW]
[ROW][C]30[/C][C]43.0931000201947[/C][/ROW]
[ROW][C]31[/C][C]47.3344098835345[/C][/ROW]
[ROW][C]32[/C][C]47.081671180471[/C][/ROW]
[ROW][C]33[/C][C]40.3920890154065[/C][/ROW]
[ROW][C]34[/C][C]43.6436055835449[/C][/ROW]
[ROW][C]35[/C][C]47.1124555866318[/C][/ROW]
[ROW][C]36[/C][C]40.623883075419[/C][/ROW]
[ROW][C]37[/C][C]36.9654431218173[/C][/ROW]
[ROW][C]38[/C][C]51.0093229271098[/C][/ROW]
[ROW][C]39[/C][C]37.0206973019906[/C][/ROW]
[ROW][C]40[/C][C]46.8975153775868[/C][/ROW]
[ROW][C]41[/C][C]36.3784511725279[/C][/ROW]
[ROW][C]42[/C][C]41.5581154672333[/C][/ROW]
[ROW][C]43[/C][C]40.3304965043586[/C][/ROW]
[ROW][C]44[/C][C]53.3516800417166[/C][/ROW]
[ROW][C]45[/C][C]45.4989801559428[/C][/ROW]
[ROW][C]46[/C][C]33.6129709892438[/C][/ROW]
[ROW][C]47[/C][C]46.8844896547453[/C][/ROW]
[ROW][C]48[/C][C]46.7095049833099[/C][/ROW]
[ROW][C]49[/C][C]43.6394943279604[/C][/ROW]
[ROW][C]50[/C][C]41.9611751830899[/C][/ROW]
[ROW][C]51[/C][C]46.202955739231[/C][/ROW]
[ROW][C]52[/C][C]49.4687615864536[/C][/ROW]
[ROW][C]53[/C][C]34.9630458752597[/C][/ROW]
[ROW][C]54[/C][C]41.5736593433748[/C][/ROW]
[ROW][C]55[/C][C]47.2105768983756[/C][/ROW]
[ROW][C]56[/C][C]44.3445617961276[/C][/ROW]
[ROW][C]57[/C][C]43.1563428348777[/C][/ROW]
[ROW][C]58[/C][C]49.723337434442[/C][/ROW]
[ROW][C]59[/C][C]47.9394218400162[/C][/ROW]
[ROW][C]60[/C][C]46.3173354424945[/C][/ROW]
[ROW][C]61[/C][C]45.7727055971326[/C][/ROW]
[ROW][C]62[/C][C]36.2016081531942[/C][/ROW]
[ROW][C]63[/C][C]47.8178756483407[/C][/ROW]
[ROW][C]64[/C][C]56.3864579490856[/C][/ROW]
[ROW][C]65[/C][C]49.1694319159171[/C][/ROW]
[ROW][C]66[/C][C]42.2622497960451[/C][/ROW]
[ROW][C]67[/C][C]49.9925100206683[/C][/ROW]
[ROW][C]68[/C][C]46.9353492008161[/C][/ROW]
[ROW][C]69[/C][C]35.1433122546602[/C][/ROW]
[ROW][C]70[/C][C]46.0095966121462[/C][/ROW]
[ROW][C]71[/C][C]44.1935693267052[/C][/ROW]
[ROW][C]72[/C][C]46.3771534271626[/C][/ROW]
[ROW][C]73[/C][C]45.6990311428956[/C][/ROW]
[ROW][C]74[/C][C]45.2777824592168[/C][/ROW]
[ROW][C]75[/C][C]47.4226160569128[/C][/ROW]
[ROW][C]76[/C][C]40.1951315100471[/C][/ROW]
[ROW][C]77[/C][C]39.9899203302325[/C][/ROW]
[ROW][C]78[/C][C]50.7321058647168[/C][/ROW]
[ROW][C]79[/C][C]45.6770339132122[/C][/ROW]
[ROW][C]80[/C][C]53.1593633739248[/C][/ROW]
[ROW][C]81[/C][C]39.0087668261072[/C][/ROW]
[ROW][C]82[/C][C]44.2503102176421[/C][/ROW]
[ROW][C]83[/C][C]54.3882471294887[/C][/ROW]
[ROW][C]84[/C][C]43.5004313394433[/C][/ROW]
[ROW][C]85[/C][C]45.8062624312625[/C][/ROW]
[ROW][C]86[/C][C]53.9761475583143[/C][/ROW]
[ROW][C]87[/C][C]35.4565324958655[/C][/ROW]
[ROW][C]88[/C][C]36.7436516203483[/C][/ROW]
[ROW][C]89[/C][C]48.2328731415357[/C][/ROW]
[ROW][C]90[/C][C]44.4987781784083[/C][/ROW]
[ROW][C]91[/C][C]45.9324986746618[/C][/ROW]
[ROW][C]92[/C][C]39.6937221238631[/C][/ROW]
[ROW][C]93[/C][C]49.772259046422[/C][/ROW]
[ROW][C]94[/C][C]51.7117323734624[/C][/ROW]
[ROW][C]95[/C][C]45.6854500200726[/C][/ROW]
[ROW][C]96[/C][C]56.2013480159028[/C][/ROW]
[ROW][C]97[/C][C]52.8503644127806[/C][/ROW]
[ROW][C]98[/C][C]39.0785229848705[/C][/ROW]
[ROW][C]99[/C][C]44.9195622386788[/C][/ROW]
[ROW][C]100[/C][C]53.3042478538737[/C][/ROW]
[/TABLE]
Source: https://freestatistics.org/blog/index.php?pk=319589&T=1

Globally Unique Identifier (entire table): ba.freestatistics.org/blog/index.php?pk=319589&T=1

As an alternative you can also use a QR Code:  

The GUIDs for individual cells are displayed in the table below:

IndexValue
137.0062292332343
245.4886307269041
358.1216766710828
439.8619019699665
544.3508084099839
644.7740239527965
741.9351302656681
839.073011930595
941.3000145357796
1049.4586782934466
1154.1678092406618
1247.7823598402776
1344.0432459973266
1444.0548251523241
1544.8557688439695
1649.9718697644041
1740.8572249929882
1842.6537468471229
1954.5237782029218
2051.1673409521362
2148.3322839092395
2245.9395941465782
2341.4516513831658
2453.2574889153105
2540.7147044286991
2651.2438176830708
2740.8558166265556
2842.252500978232
2947.0326914945845
3043.0931000201947
3147.3344098835345
3247.081671180471
3340.3920890154065
3443.6436055835449
3547.1124555866318
3640.623883075419
3736.9654431218173
3851.0093229271098
3937.0206973019906
4046.8975153775868
4136.3784511725279
4241.5581154672333
4340.3304965043586
4453.3516800417166
4545.4989801559428
4633.6129709892438
4746.8844896547453
4846.7095049833099
4943.6394943279604
5041.9611751830899
5146.202955739231
5249.4687615864536
5334.9630458752597
5441.5736593433748
5547.2105768983756
5644.3445617961276
5743.1563428348777
5849.723337434442
5947.9394218400162
6046.3173354424945
6145.7727055971326
6236.2016081531942
6347.8178756483407
6456.3864579490856
6549.1694319159171
6642.2622497960451
6749.9925100206683
6846.9353492008161
6935.1433122546602
7046.0095966121462
7144.1935693267052
7246.3771534271626
7345.6990311428956
7445.2777824592168
7547.4226160569128
7640.1951315100471
7739.9899203302325
7850.7321058647168
7945.6770339132122
8053.1593633739248
8139.0087668261072
8244.2503102176421
8354.3882471294887
8443.5004313394433
8545.8062624312625
8653.9761475583143
8735.4565324958655
8836.7436516203483
8948.2328731415357
9044.4987781784083
9145.9324986746618
9239.6937221238631
9349.772259046422
9451.7117323734624
9545.6854500200726
9656.2013480159028
9752.8503644127806
9839.0785229848705
9944.9195622386788
10053.3042478538737


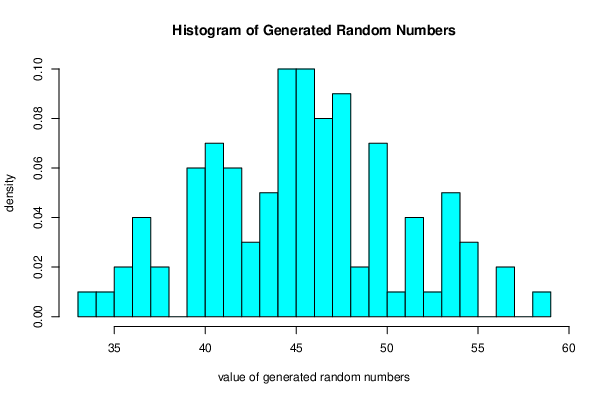
Frequency Table (Histogram)
BinsMidpointAbs. FrequencyRel. FrequencyCumul. Rel. Freq.Density
[33,34[33.510.010.010.01
[34,35[34.510.010.020.01
[35,36[35.520.020.040.02
[36,37[36.540.040.080.04
[37,38[37.520.020.10.02
[38,39[38.5000.10
[39,40[39.560.060.160.06
[40,41[40.570.070.230.07
[41,42[41.560.060.290.06
[42,43[42.530.030.320.03
[43,44[43.550.050.370.05
[44,45[44.5100.10.470.1
[45,46[45.5100.10.570.1
[46,47[46.580.080.650.08
[47,48[47.590.090.740.09
[48,49[48.520.020.760.02
[49,50[49.570.070.830.07
[50,51[50.510.010.840.01
[51,52[51.540.040.880.04
[52,53[52.510.010.890.01
[53,54[53.550.050.940.05
[54,55[54.530.030.970.03
[55,56[55.5000.970
[56,57[56.520.020.990.02
[57,58[57.5000.990
[58,59]58.510.0110.01

\begin{tabular}{lllllllll}
\hline
Frequency Table (Histogram) \tabularnewline
Bins & Midpoint & Abs. Frequency & Rel. Frequency & Cumul. Rel. Freq. & Density \tabularnewline
[33,34[ & 33.5 & 1 & 0.01 & 0.01 & 0.01 \tabularnewline
[34,35[ & 34.5 & 1 & 0.01 & 0.02 & 0.01 \tabularnewline
[35,36[ & 35.5 & 2 & 0.02 & 0.04 & 0.02 \tabularnewline
[36,37[ & 36.5 & 4 & 0.04 & 0.08 & 0.04 \tabularnewline
[37,38[ & 37.5 & 2 & 0.02 & 0.1 & 0.02 \tabularnewline
[38,39[ & 38.5 & 0 & 0 & 0.1 & 0 \tabularnewline
[39,40[ & 39.5 & 6 & 0.06 & 0.16 & 0.06 \tabularnewline
[40,41[ & 40.5 & 7 & 0.07 & 0.23 & 0.07 \tabularnewline
[41,42[ & 41.5 & 6 & 0.06 & 0.29 & 0.06 \tabularnewline
[42,43[ & 42.5 & 3 & 0.03 & 0.32 & 0.03 \tabularnewline
[43,44[ & 43.5 & 5 & 0.05 & 0.37 & 0.05 \tabularnewline
[44,45[ & 44.5 & 10 & 0.1 & 0.47 & 0.1 \tabularnewline
[45,46[ & 45.5 & 10 & 0.1 & 0.57 & 0.1 \tabularnewline
[46,47[ & 46.5 & 8 & 0.08 & 0.65 & 0.08 \tabularnewline
[47,48[ & 47.5 & 9 & 0.09 & 0.74 & 0.09 \tabularnewline
[48,49[ & 48.5 & 2 & 0.02 & 0.76 & 0.02 \tabularnewline
[49,50[ & 49.5 & 7 & 0.07 & 0.83 & 0.07 \tabularnewline
[50,51[ & 50.5 & 1 & 0.01 & 0.84 & 0.01 \tabularnewline
[51,52[ & 51.5 & 4 & 0.04 & 0.88 & 0.04 \tabularnewline
[52,53[ & 52.5 & 1 & 0.01 & 0.89 & 0.01 \tabularnewline
[53,54[ & 53.5 & 5 & 0.05 & 0.94 & 0.05 \tabularnewline
[54,55[ & 54.5 & 3 & 0.03 & 0.97 & 0.03 \tabularnewline
[55,56[ & 55.5 & 0 & 0 & 0.97 & 0 \tabularnewline
[56,57[ & 56.5 & 2 & 0.02 & 0.99 & 0.02 \tabularnewline
[57,58[ & 57.5 & 0 & 0 & 0.99 & 0 \tabularnewline
[58,59] & 58.5 & 1 & 0.01 & 1 & 0.01 \tabularnewline
\hline
\end{tabular}
%Source: https://freestatistics.org/blog/index.php?pk=319589&T=2

[TABLE]
[ROW][C]Frequency Table (Histogram)[/C][/ROW]
[ROW][C]Bins[/C][C]Midpoint[/C][C]Abs. Frequency[/C][C]Rel. Frequency[/C][C]Cumul. Rel. Freq.[/C][C]Density[/C][/ROW]
[ROW][C][33,34[[/C][C]33.5[/C][C]1[/C][C]0.01[/C][C]0.01[/C][C]0.01[/C][/ROW]
[ROW][C][34,35[[/C][C]34.5[/C][C]1[/C][C]0.01[/C][C]0.02[/C][C]0.01[/C][/ROW]
[ROW][C][35,36[[/C][C]35.5[/C][C]2[/C][C]0.02[/C][C]0.04[/C][C]0.02[/C][/ROW]
[ROW][C][36,37[[/C][C]36.5[/C][C]4[/C][C]0.04[/C][C]0.08[/C][C]0.04[/C][/ROW]
[ROW][C][37,38[[/C][C]37.5[/C][C]2[/C][C]0.02[/C][C]0.1[/C][C]0.02[/C][/ROW]
[ROW][C][38,39[[/C][C]38.5[/C][C]0[/C][C]0[/C][C]0.1[/C][C]0[/C][/ROW]
[ROW][C][39,40[[/C][C]39.5[/C][C]6[/C][C]0.06[/C][C]0.16[/C][C]0.06[/C][/ROW]
[ROW][C][40,41[[/C][C]40.5[/C][C]7[/C][C]0.07[/C][C]0.23[/C][C]0.07[/C][/ROW]
[ROW][C][41,42[[/C][C]41.5[/C][C]6[/C][C]0.06[/C][C]0.29[/C][C]0.06[/C][/ROW]
[ROW][C][42,43[[/C][C]42.5[/C][C]3[/C][C]0.03[/C][C]0.32[/C][C]0.03[/C][/ROW]
[ROW][C][43,44[[/C][C]43.5[/C][C]5[/C][C]0.05[/C][C]0.37[/C][C]0.05[/C][/ROW]
[ROW][C][44,45[[/C][C]44.5[/C][C]10[/C][C]0.1[/C][C]0.47[/C][C]0.1[/C][/ROW]
[ROW][C][45,46[[/C][C]45.5[/C][C]10[/C][C]0.1[/C][C]0.57[/C][C]0.1[/C][/ROW]
[ROW][C][46,47[[/C][C]46.5[/C][C]8[/C][C]0.08[/C][C]0.65[/C][C]0.08[/C][/ROW]
[ROW][C][47,48[[/C][C]47.5[/C][C]9[/C][C]0.09[/C][C]0.74[/C][C]0.09[/C][/ROW]
[ROW][C][48,49[[/C][C]48.5[/C][C]2[/C][C]0.02[/C][C]0.76[/C][C]0.02[/C][/ROW]
[ROW][C][49,50[[/C][C]49.5[/C][C]7[/C][C]0.07[/C][C]0.83[/C][C]0.07[/C][/ROW]
[ROW][C][50,51[[/C][C]50.5[/C][C]1[/C][C]0.01[/C][C]0.84[/C][C]0.01[/C][/ROW]
[ROW][C][51,52[[/C][C]51.5[/C][C]4[/C][C]0.04[/C][C]0.88[/C][C]0.04[/C][/ROW]
[ROW][C][52,53[[/C][C]52.5[/C][C]1[/C][C]0.01[/C][C]0.89[/C][C]0.01[/C][/ROW]
[ROW][C][53,54[[/C][C]53.5[/C][C]5[/C][C]0.05[/C][C]0.94[/C][C]0.05[/C][/ROW]
[ROW][C][54,55[[/C][C]54.5[/C][C]3[/C][C]0.03[/C][C]0.97[/C][C]0.03[/C][/ROW]
[ROW][C][55,56[[/C][C]55.5[/C][C]0[/C][C]0[/C][C]0.97[/C][C]0[/C][/ROW]
[ROW][C][56,57[[/C][C]56.5[/C][C]2[/C][C]0.02[/C][C]0.99[/C][C]0.02[/C][/ROW]
[ROW][C][57,58[[/C][C]57.5[/C][C]0[/C][C]0[/C][C]0.99[/C][C]0[/C][/ROW]
[ROW][C][58,59][/C][C]58.5[/C][C]1[/C][C]0.01[/C][C]1[/C][C]0.01[/C][/ROW]
[/TABLE]
Source: https://freestatistics.org/blog/index.php?pk=319589&T=2

Globally Unique Identifier (entire table): ba.freestatistics.org/blog/index.php?pk=319589&T=2

As an alternative you can also use a QR Code:  

The GUIDs for individual cells are displayed in the table below:

Frequency Table (Histogram)
BinsMidpointAbs. FrequencyRel. FrequencyCumul. Rel. Freq.Density
[33,34[33.510.010.010.01
[34,35[34.510.010.020.01
[35,36[35.520.020.040.02
[36,37[36.540.040.080.04
[37,38[37.520.020.10.02
[38,39[38.5000.10
[39,40[39.560.060.160.06
[40,41[40.570.070.230.07
[41,42[41.560.060.290.06
[42,43[42.530.030.320.03
[43,44[43.550.050.370.05
[44,45[44.5100.10.470.1
[45,46[45.5100.10.570.1
[46,47[46.580.080.650.08
[47,48[47.590.090.740.09
[48,49[48.520.020.760.02
[49,50[49.570.070.830.07
[50,51[50.510.010.840.01
[51,52[51.540.040.880.04
[52,53[52.510.010.890.01
[53,54[53.550.050.940.05
[54,55[54.530.030.970.03
[55,56[55.5000.970
[56,57[56.520.020.990.02
[57,58[57.5000.990
[58,59]58.510.0110.01


Parameters (Session):
par1 = 100 ; par2 = 45 ; par3 = 6 ; par4 = 5 ; par5 = Y ; par6 = 20 ; par7 = 30 ; par8 = 65 ;
Parameters (R input):
par1 = 100 ; par2 = 45 ; par3 = 6 ; par4 = 5 ; par5 = Y ; par6 = 20 ; par7 = 30 ; par8 = 65 ;
R code (references can be found in the software module):
par8 <- '65'
par7 <- '30'
par6 <- '20'
par5 <- 'Y'
par4 <- '5'
par3 <- '1'
par2 <- '45'
par1 <- '100'
library(MASS)
library(msm)
par1 <- sub(',','.',par1)
par2 <- sub(',','.',par2)
par3 <- sub(',','.',par3)
par4 <- sub(',','.',par4)
par1 <- as.numeric(par1)
if (par1 > 10000) par1=10000 #impose restriction on number of random values
par2 <- as.numeric(par2)
par3 <- as.numeric(par3)
par4 <- as.numeric(par4)
if (par6 == '0') par6 = 'Sturges' else {
par6 <- as.numeric(par6)
if (par6 > 50) par6 = 50 #impose restriction on the number of bins
}
if (par7 == '') par7 <- -Inf else par7 <- as.numeric(par7)
if (par8 == '') par8 <- Inf else par8 <- as.numeric(par8)
x <- rtnorm(par1,par2,par3,par7,par8)
x <- as.ts(x) #otherwise the fitdistr function does not work properly
if ((par7 == -Inf) & (par8 == Inf)) (r <- fitdistr(x,'normal'))
bitmap(file='test1.png')
myhist<-hist(x,col=par4,breaks=par6,main=main,ylab=ylab,xlab=xlab,freq=F)
if ((par7 == -Inf) & (par8 == Inf)) {
curve(1/(r$estimate[2]*sqrt(2*pi))*exp(-1/2*((x-r$estimate[1])/r$estimate[2])^2),min(x),max(x),add=T)
}
dev.off()
load(file='createtable')
if (par5 == 'Y')
{
a<-table.start()
a<-table.row.start(a)
a<-table.element(a,'Index',1,TRUE)
a<-table.element(a,'Value',1,TRUE)
a<-table.row.end(a)
for (i in 1:par1)
{
a<-table.row.start(a)
a<-table.element(a,i,header=TRUE)
a<-table.element(a,x[i])
a<-table.row.end(a)
}
a<-table.end(a)
table.save(a,file='mytable1.tab')
}
if ((par7 == -Inf) & (par8 == Inf)) {
a<-table.start()
a<-table.row.start(a)
a<-table.element(a,'Parameter',1,TRUE)
a<-table.element(a,'Value',1,TRUE)
a<-table.element(a,'Standard Deviation',1,TRUE)
a<-table.row.end(a)
a<-table.row.start(a)
a<-table.element(a,'# simulated values',header=TRUE)
a<-table.element(a,par1)
a<-table.element(a,'-')
a<-table.row.end(a)
a<-table.row.start(a)
a<-table.element(a,'true mean',header=TRUE)
a<-table.element(a,par2)
a<-table.element(a,'-')
a<-table.row.end(a)
a<-table.row.start(a)
a<-table.element(a,'true standard deviation',header=TRUE)
a<-table.element(a,par3)
a<-table.element(a,'-')
a<-table.row.end(a)
a<-table.row.start(a)
a<-table.element(a,'mean',header=TRUE)
a<-table.element(a,r$estimate[1])
a<-table.element(a,r$sd[1])
a<-table.row.end(a)
a<-table.row.start(a)
a<-table.element(a,'standard deviation',header=TRUE)
a<-table.element(a,r$estimate[2])
a<-table.element(a,r$sd[2])
a<-table.row.end(a)
a<-table.end(a)
table.save(a,file='mytable.tab')
}
a<-table.start()
a<-table.row.start(a)
a<-table.element(a,'Frequency Table (Histogram)',6,TRUE)
a<-table.row.end(a)
a<-table.row.start(a)
a<-table.element(a,'Bins',header=TRUE)
a<-table.element(a,'Midpoint',header=TRUE)
a<-table.element(a,'Abs. Frequency',header=TRUE)
a<-table.element(a,'Rel. Frequency',header=TRUE)
a<-table.element(a,'Cumul. Rel. Freq.',header=TRUE)
a<-table.element(a,'Density',header=TRUE)
a<-table.row.end(a)
crf <- 0
mynumrows <- (length(myhist$breaks)-1)
for (i in 1:mynumrows) {
a<-table.row.start(a)
dum <- paste('[',myhist$breaks[i],sep='')
dum <- paste(dum,myhist$breaks[i+1],sep=',')
if (i==mynumrows)
dum <- paste(dum,']',sep='')
else
dum <- paste(dum,'[',sep='')
a<-table.element(a,dum,header=TRUE)
a<-table.element(a,myhist$mids[i])
a<-table.element(a,myhist$counts[i])
rf <- myhist$counts[i]/par1
crf <- crf + rf
a<-table.element(a,round(rf,6))
a<-table.element(a,round(crf,6))
a<-table.element(a,round(myhist$density[i],6))
a<-table.row.end(a)
}
a<-table.end(a)
table.save(a,file='mytable3.tab')