Free Statistics
of Irreproducible Research!
Description of Statistical Computation | ||||||||||||||||||||||||||||||||||||||||||||||||||||||
|---|---|---|---|---|---|---|---|---|---|---|---|---|---|---|---|---|---|---|---|---|---|---|---|---|---|---|---|---|---|---|---|---|---|---|---|---|---|---|---|---|---|---|---|---|---|---|---|---|---|---|---|---|---|---|
| Author's title | ||||||||||||||||||||||||||||||||||||||||||||||||||||||
| Author | *The author of this computation has been verified* | |||||||||||||||||||||||||||||||||||||||||||||||||||||
| R Software Module | rwasp_univariatedataseries.wasp | |||||||||||||||||||||||||||||||||||||||||||||||||||||
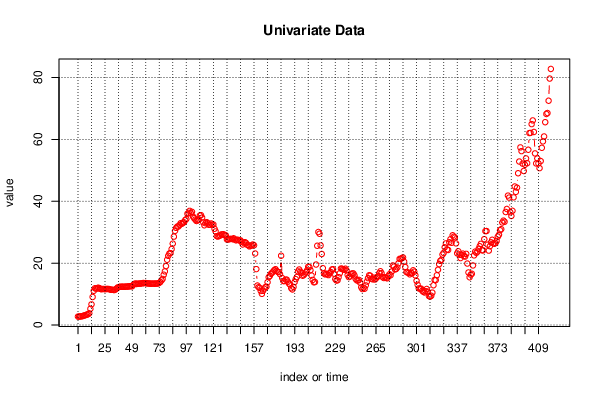
| Title produced by software | Univariate Data Series | |||||||||||||||||||||||||||||||||||||||||||||||||||||
| Date of computation | Sun, 26 Dec 2021 20:57:02 +0100 | |||||||||||||||||||||||||||||||||||||||||||||||||||||
| Cite this page as follows | Statistical Computations at FreeStatistics.org, Office for Research Development and Education, URL https://freestatistics.org/blog/index.php?v=date/2021/Dec/26/t1640549669p2mnbc0b8xhjiml.htm/, Retrieved Tue, 14 May 2024 10:15:41 +0000 | |||||||||||||||||||||||||||||||||||||||||||||||||||||
| Statistical Computations at FreeStatistics.org, Office for Research Development and Education, URL https://freestatistics.org/blog/index.php?pk=319588, Retrieved Tue, 14 May 2024 10:15:41 +0000 | ||||||||||||||||||||||||||||||||||||||||||||||||||||||
| QR Codes: | ||||||||||||||||||||||||||||||||||||||||||||||||||||||
|
| ||||||||||||||||||||||||||||||||||||||||||||||||||||||
| Original text written by user: | ||||||||||||||||||||||||||||||||||||||||||||||||||||||
| IsPrivate? | No (this computation is public) | |||||||||||||||||||||||||||||||||||||||||||||||||||||
| User-defined keywords | ||||||||||||||||||||||||||||||||||||||||||||||||||||||
| Estimated Impact | 50 | |||||||||||||||||||||||||||||||||||||||||||||||||||||
Tree of Dependent Computations | ||||||||||||||||||||||||||||||||||||||||||||||||||||||
| Family? (F = Feedback message, R = changed R code, M = changed R Module, P = changed Parameters, D = changed Data) | ||||||||||||||||||||||||||||||||||||||||||||||||||||||
| - [Univariate Data Series] [Univariate Data -...] [2021-12-26 19:57:02] [09a89fa00852e402e9bf95e823929ca7] [Current] | ||||||||||||||||||||||||||||||||||||||||||||||||||||||
| Feedback Forum | ||||||||||||||||||||||||||||||||||||||||||||||||||||||
Post a new message | ||||||||||||||||||||||||||||||||||||||||||||||||||||||
Dataset | ||||||||||||||||||||||||||||||||||||||||||||||||||||||
| Dataseries X: | ||||||||||||||||||||||||||||||||||||||||||||||||||||||
2.75 2.73 2.82 2.83 2.9 3.05 3.15 3.26 3.38 3.54 3.81 5.27 6.71 9.09 11.08 11.91 11.81 11.81 12.09 11.95 11.67 11.6 11.71 11.62 11.64 11.66 11.67 11.69 11.58 11.4 11.44 11.38 11.31 11.45 11.73 12.11 12.23 12.39 12.34 12.42 12.37 12.37 12.39 12.43 12.48 12.45 12.58 12.59 12.54 13.01 13.31 13.45 13.28 13.38 13.36 13.4 13.49 13.47 13.62 13.57 13.59 13.48 13.47 13.47 13.36 13.37 13.4 13.41 13.37 13.42 13.41 13.46 13.64 13.93 14.46 14.92 16.27 17.36 19.07 21.1 22.39 23.13 23.27 24.57 26.32 28.57 30.44 31.4 31.84 31.86 32.3 32.93 32.73 33.1 33.23 33.94 34.27 35.96 36.25 36.92 36.16 36.59 35.05 34.53 34.07 33.65 33.84 33.99 35.41 35.53 34.71 33.2 32.25 32.92 33.27 32.91 32.39 32.44 32.84 32.44 32.5 31.12 30.28 28.76 28.59 28.83 28.93 29.31 29.27 29.36 29.05 29 27.65 27.64 27.8 27.84 27.85 27.76 28.05 27.66 27.39 27.56 27.55 27.3 27.38 26.91 26.05 26.52 26.79 26.52 25.91 25.76 25.42 25.65 25.69 26.04 25.8 23.13 18.1 12.78 12.24 12.04 11.03 10.09 11.08 11.79 12.23 12.4 13.86 15.47 15.87 16.57 16.92 17.31 17.77 18.07 17.49 17.21 17.12 16.46 22.4 15.2 14.24 14.21 14.69 14.68 14.02 13.38 13.08 11.92 11.52 12.34 13.91 14.84 15.54 17.33 17.97 17.27 16.93 15.95 16.14 16.61 17.08 17.72 18.85 18.79 17.75 16.02 14.61 13.83 13.92 19.57 25.63 30.08 29.51 25.75 22.98 18.39 16.75 16.39 16.57 16.4 16.15 16.8 17.14 17.97 18.06 16.6 14.87 14.42 14.48 15.5 16.74 18.27 18.2 18.03 17.86 18.22 17.63 16.22 15.5 15.71 16.49 16.69 16.71 16.07 14.96 14.51 14.37 14.59 13.72 12.2 11.64 12.09 11.76 12.85 14.05 15.18 16.09 15.97 15 14.8 15.31 14.7 15.06 15.53 15.78 16.76 17.4 16.78 15.51 15.22 15.44 15.25 15.1 15.82 16.43 16.1 17.31 19.27 18.9 17.96 18.16 18.65 19.97 21.41 21.38 21.63 21.86 20.48 18.76 17.13 17.06 16.85 16.41 16.95 16.73 17.71 17.25 16.05 14.31 13.02 11.88 11.77 11.8 11.12 10.78 10.55 10.99 11.66 10.79 9.38 9.21 9.48 10.5 12.88 14.6 14.52 16.11 17.88 19.69 20.76 21.05 22.79 23.31 25.14 26.41 24.41 24.28 26.78 27.73 26.59 29.03 28.57 28.34 26.4 23.19 23.85 22.75 21.66 22.65 23.09 22.33 22.14 23.02 19.88 17 15.46 16.29 16.58 19.27 22.53 23.75 23.35 23.73 24.58 25.49 26.25 24.19 24.15 27.76 30.37 30.39 26.01 24.05 25.5 26.75 27.56 26.43 26.28 26.54 27.17 28.57 29.17 30.66 31 33.14 33.74 33.38 36.54 37.52 41.84 41.19 36.46 35.27 36.93 41.28 44.78 43.04 44.41 49.07 52.85 57.42 56.21 52.16 49.79 51.8 53.86 52.32 56.65 62.04 62.12 64.93 66.13 62.4 55.47 52.22 53.84 52.23 50.71 53 57.28 59.36 60.95 65.56 68.21 68.51 72.49 79.65 82.76 | ||||||||||||||||||||||||||||||||||||||||||||||||||||||
Tables (Output of Computation) | ||||||||||||||||||||||||||||||||||||||||||||||||||||||
| ||||||||||||||||||||||||||||||||||||||||||||||||||||||
Figures (Output of Computation) | ||||||||||||||||||||||||||||||||||||||||||||||||||||||
Input Parameters & R Code | ||||||||||||||||||||||||||||||||||||||||||||||||||||||
| Parameters (Session): | ||||||||||||||||||||||||||||||||||||||||||||||||||||||
| par4 = 12 ; | ||||||||||||||||||||||||||||||||||||||||||||||||||||||
| Parameters (R input): | ||||||||||||||||||||||||||||||||||||||||||||||||||||||
| par1 = ; par2 = ; par3 = ; par4 = 12 ; | ||||||||||||||||||||||||||||||||||||||||||||||||||||||
| R code (references can be found in the software module): | ||||||||||||||||||||||||||||||||||||||||||||||||||||||
if (par4 != 'No season') { | ||||||||||||||||||||||||||||||||||||||||||||||||||||||