Free Statistics

of Irreproducible Research!

Author's title

Author*Unverified author*
R Software Modulerwasp_concentration.wasp
Title produced by softwareConcentration and Inequality
Date of computationThu, 09 Dec 2021 15:21:34 +0100
Cite this page as followsStatistical Computations at FreeStatistics.org, Office for Research Development and Education, URL https://freestatistics.org/blog/index.php?v=date/2021/Dec/09/t1639059917d9ooiq7tfdq6ypx.htm/, Retrieved Tue, 14 May 2024 03:53:38 +0000
Statistical Computations at FreeStatistics.org, Office for Research Development and Education, URL https://freestatistics.org/blog/index.php?pk=319574, Retrieved Tue, 14 May 2024 03:53:38 +0000
QR Codes:

Original text written by user:
IsPrivate?No (this computation is public)
User-defined keywords
Estimated Impact48
Family? (F = Feedback message, R = changed R code, M = changed R Module, P = changed Parameters, D = changed Data)
-       [Concentration and Inequality] [concentrazione] [2021-12-09 14:21:34] [d41d8cd98f00b204e9800998ecf8427e] [Current]
Feedback Forum

Post a new message
Dataseries X:
35
40
28
33
16
21
50
25
44
52
28
60
58
36
18


Summary of computational transaction
Raw Input view raw input (R code)
Raw Outputview raw output of R engine
Computing time1 seconds
R ServerBig Analytics Cloud Computing Center

\begin{tabular}{lllllllll}
\hline
Summary of computational transaction \tabularnewline
Raw Input view raw input (R code)  \tabularnewline
Raw Outputview raw output of R engine  \tabularnewline
Computing time1 seconds \tabularnewline
R ServerBig Analytics Cloud Computing Center \tabularnewline
\hline
\end{tabular}
%Source: https://freestatistics.org/blog/index.php?pk=319574&T=0

[TABLE]
[ROW]
Summary of computational transaction[/C][/ROW] [ROW]Raw Input[/C] view raw input (R code) [/C][/ROW] [ROW]Raw Output[/C]view raw output of R engine [/C][/ROW] [ROW]Computing time[/C]1 seconds[/C][/ROW] [ROW]R Server[/C]Big Analytics Cloud Computing Center[/C][/ROW] [/TABLE] Source: https://freestatistics.org/blog/index.php?pk=319574&T=0

Globally Unique Identifier (entire table): ba.freestatistics.org/blog/index.php?pk=319574&T=0

As an alternative you can also use a QR Code:  

The GUIDs for individual cells are displayed in the table below:

Summary of computational transaction
Raw Input view raw input (R code)
Raw Outputview raw output of R engine
Computing time1 seconds
R ServerBig Analytics Cloud Computing Center


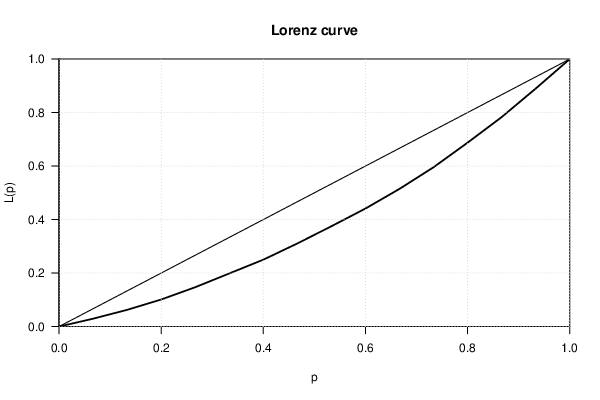
Concentration - Ungrouped Data
MeasureValue
Number of Categories15
Maximum Entropy2.70805020110221
Entropy2.63623094155035
Normalised Entropy0.973479347051017
Max. Entropy - Entropy0.0718192595518556
Theil Entropy Index0.0718192595518555
Exponential Index0.0716307418618141
Herfindahl0.0761245674740484
Normalised Herfindahl0.0101334651507662
Rosenbluth0.084946908182386
Gini0.215196078431372
Concentration0.230567226890756
Ricci-Schutz (Pietra)0.158823529411765
Atkinson0.0364618135860765
Kolm17.6915805526721
Coefficient of Variation0.376654366907815
Squared Coefficient of Variation0.141868512110727

\begin{tabular}{lllllllll}
\hline
Concentration - Ungrouped Data \tabularnewline
Measure & Value \tabularnewline
Number of Categories & 15 \tabularnewline
Maximum Entropy & 2.70805020110221 \tabularnewline
Entropy & 2.63623094155035 \tabularnewline
Normalised Entropy & 0.973479347051017 \tabularnewline
Max. Entropy - Entropy & 0.0718192595518556 \tabularnewline
Theil Entropy Index & 0.0718192595518555 \tabularnewline
Exponential Index & 0.0716307418618141 \tabularnewline
Herfindahl & 0.0761245674740484 \tabularnewline
Normalised Herfindahl & 0.0101334651507662 \tabularnewline
Rosenbluth & 0.084946908182386 \tabularnewline
Gini & 0.215196078431372 \tabularnewline
Concentration & 0.230567226890756 \tabularnewline
Ricci-Schutz (Pietra) & 0.158823529411765 \tabularnewline
Atkinson & 0.0364618135860765 \tabularnewline
Kolm & 17.6915805526721 \tabularnewline
Coefficient of Variation & 0.376654366907815 \tabularnewline
Squared Coefficient of Variation & 0.141868512110727 \tabularnewline
\hline
\end{tabular}
%Source: https://freestatistics.org/blog/index.php?pk=319574&T=1

[TABLE]
[ROW][C]Concentration - Ungrouped Data[/C][/ROW]
[ROW][C]Measure[/C][C]Value[/C][/ROW]
[ROW][C]Number of Categories[/C][C]15[/C][/ROW]
[ROW][C]Maximum Entropy[/C][C]2.70805020110221[/C][/ROW]
[ROW][C]Entropy[/C][C]2.63623094155035[/C][/ROW]
[ROW][C]Normalised Entropy[/C][C]0.973479347051017[/C][/ROW]
[ROW][C]Max. Entropy - Entropy[/C][C]0.0718192595518556[/C][/ROW]
[ROW][C]Theil Entropy Index[/C][C]0.0718192595518555[/C][/ROW]
[ROW][C]Exponential Index[/C][C]0.0716307418618141[/C][/ROW]
[ROW][C]Herfindahl[/C][C]0.0761245674740484[/C][/ROW]
[ROW][C]Normalised Herfindahl[/C][C]0.0101334651507662[/C][/ROW]
[ROW][C]Rosenbluth[/C][C]0.084946908182386[/C][/ROW]
[ROW][C]Gini[/C][C]0.215196078431372[/C][/ROW]
[ROW][C]Concentration[/C][C]0.230567226890756[/C][/ROW]
[ROW][C]Ricci-Schutz (Pietra)[/C][C]0.158823529411765[/C][/ROW]
[ROW][C]Atkinson[/C][C]0.0364618135860765[/C][/ROW]
[ROW][C]Kolm[/C][C]17.6915805526721[/C][/ROW]
[ROW][C]Coefficient of Variation[/C][C]0.376654366907815[/C][/ROW]
[ROW][C]Squared Coefficient of Variation[/C][C]0.141868512110727[/C][/ROW]
[/TABLE]
Source: https://freestatistics.org/blog/index.php?pk=319574&T=1

Globally Unique Identifier (entire table): ba.freestatistics.org/blog/index.php?pk=319574&T=1

As an alternative you can also use a QR Code:  

The GUIDs for individual cells are displayed in the table below:

Concentration - Ungrouped Data
MeasureValue
Number of Categories15
Maximum Entropy2.70805020110221
Entropy2.63623094155035
Normalised Entropy0.973479347051017
Max. Entropy - Entropy0.0718192595518556
Theil Entropy Index0.0718192595518555
Exponential Index0.0716307418618141
Herfindahl0.0761245674740484
Normalised Herfindahl0.0101334651507662
Rosenbluth0.084946908182386
Gini0.215196078431372
Concentration0.230567226890756
Ricci-Schutz (Pietra)0.158823529411765
Atkinson0.0364618135860765
Kolm17.6915805526721
Coefficient of Variation0.376654366907815
Squared Coefficient of Variation0.141868512110727


Parameters (Session):
Parameters (R input):
R code (references can be found in the software module):
library(ineq)
my_minimum <- min(x)
if(my_minimum < 0) {
stop('Negative values are not allowed.')
}
myLength <- length(x)
myMaximumEntropy <- log(myLength)
mySum <- sum(x)
myProportion <- x/mySum
myEntropy <- -sum(myProportion * log(myProportion))
myNormalizedEntropy <- myEntropy / myMaximumEntropy
myDifference <- myMaximumEntropy - myEntropy
myTheilEntropyIndex <- entropy(x,parameter=1,na.rm=T)
myExponentialIndex <- exp(-myEntropy)
myHerfindahlMeasure <- sum(myProportion^2)
myHerfindahl <- conc(x,type='Herfindahl',na.rm=T)
myRosenbluth <- conc(x,type='Rosenbluth',na.rm=T)
myNormalizedHerfindahlMeasure <- (myHerfindahlMeasure - 1/myLength) / (1 - 1/myLength)
myGini <- Gini(x,na.rm=T)
myConcentrationCoefficient <- myLength/(myLength -1)*myGini
myRS <- RS(x,na.rm=T)
myAtkinson <- Atkinson(x,na.rm=T)
myKolm <- Kolm(x,na.rm=T)
myCoefficientOfVariation <- var.coeff(x,square=F,na.rm=T)
mySquaredCoefficientOfVariation <- var.coeff(x,square=T,na.rm=T)
bitmap(file='plot1.png')
plot(Lc(x))
grid()
dev.off()
bitmap(file='plot2.png')
plot(Lc(x),general=T)
grid()
dev.off()
load(file='createtable')
a<-table.start()
a<-table.row.start(a)
a<-table.element(a,'Concentration - Ungrouped Data',2,TRUE)
a<-table.row.end(a)
a<-table.row.start(a)
a<-table.element(a,'Measure',header=TRUE)
a<-table.element(a,'Value',header=TRUE)
a<-table.row.end(a)
a<-table.row.start(a)
a<-table.element(a,'Number of Categories',header=F)
a<-table.element(a,myLength,header=F)
a<-table.row.end(a)
a<-table.row.start(a)
a<-table.element(a,'Maximum Entropy',header=F)
a<-table.element(a,myMaximumEntropy,header=F)
a<-table.row.end(a)
a<-table.row.start(a)
a<-table.element(a,'Entropy',header=F)
a<-table.element(a,myEntropy,header=F)
a<-table.row.end(a)
a<-table.row.start(a)
a<-table.element(a,'Normalised Entropy',header=F)
a<-table.element(a,myNormalizedEntropy,header=F)
a<-table.row.end(a)
a<-table.row.start(a)
a<-table.element(a,'Max. Entropy - Entropy',header=F)
a<-table.element(a,myDifference,header=F)
a<-table.row.end(a)
a<-table.row.start(a)
a<-table.element(a,'Theil Entropy Index',header=F)
a<-table.element(a,myTheilEntropyIndex,header=F)
a<-table.row.end(a)
a<-table.row.start(a)
a<-table.element(a,'Exponential Index',header=F)
a<-table.element(a,myExponentialIndex,header=F)
a<-table.row.end(a)
a<-table.row.start(a)
a<-table.element(a,'Herfindahl',header=F)
a<-table.element(a,myHerfindahl,header=F)
a<-table.row.end(a)
a<-table.row.start(a)
a<-table.element(a,'Normalised Herfindahl',header=F)
a<-table.element(a,myNormalizedHerfindahlMeasure,header=F)
a<-table.row.end(a)
a<-table.row.start(a)
a<-table.element(a,'Rosenbluth',header=F)
a<-table.element(a,myRosenbluth,header=F)
a<-table.row.end(a)
a<-table.row.start(a)
a<-table.element(a,'Gini',header=F)
a<-table.element(a,myGini,header=F)
a<-table.row.end(a)
a<-table.row.start(a)
a<-table.element(a,'Concentration',header=F)
a<-table.element(a,myConcentrationCoefficient,header=F)
a<-table.row.end(a)
a<-table.row.start(a)
a<-table.element(a,'Ricci-Schutz (Pietra)',header=F)
a<-table.element(a,myRS,header=F)
a<-table.row.end(a)
a<-table.row.start(a)
a<-table.element(a,'Atkinson',header=F)
a<-table.element(a,myAtkinson,header=F)
a<-table.row.end(a)
a<-table.row.start(a)
a<-table.element(a,'Kolm',header=F)
a<-table.element(a,myKolm,header=F)
a<-table.row.end(a)
a<-table.row.start(a)
a<-table.element(a,'Coefficient of Variation',header=F)
a<-table.element(a,myCoefficientOfVariation,header=F)
a<-table.row.end(a)
a<-table.row.start(a)
a<-table.element(a,'Squared Coefficient of Variation',header=F)
a<-table.element(a,mySquaredCoefficientOfVariation,header=F)
a<-table.row.end(a)
a<-table.end(a)
table.save(a,file='mytable.tab')